77 Maps
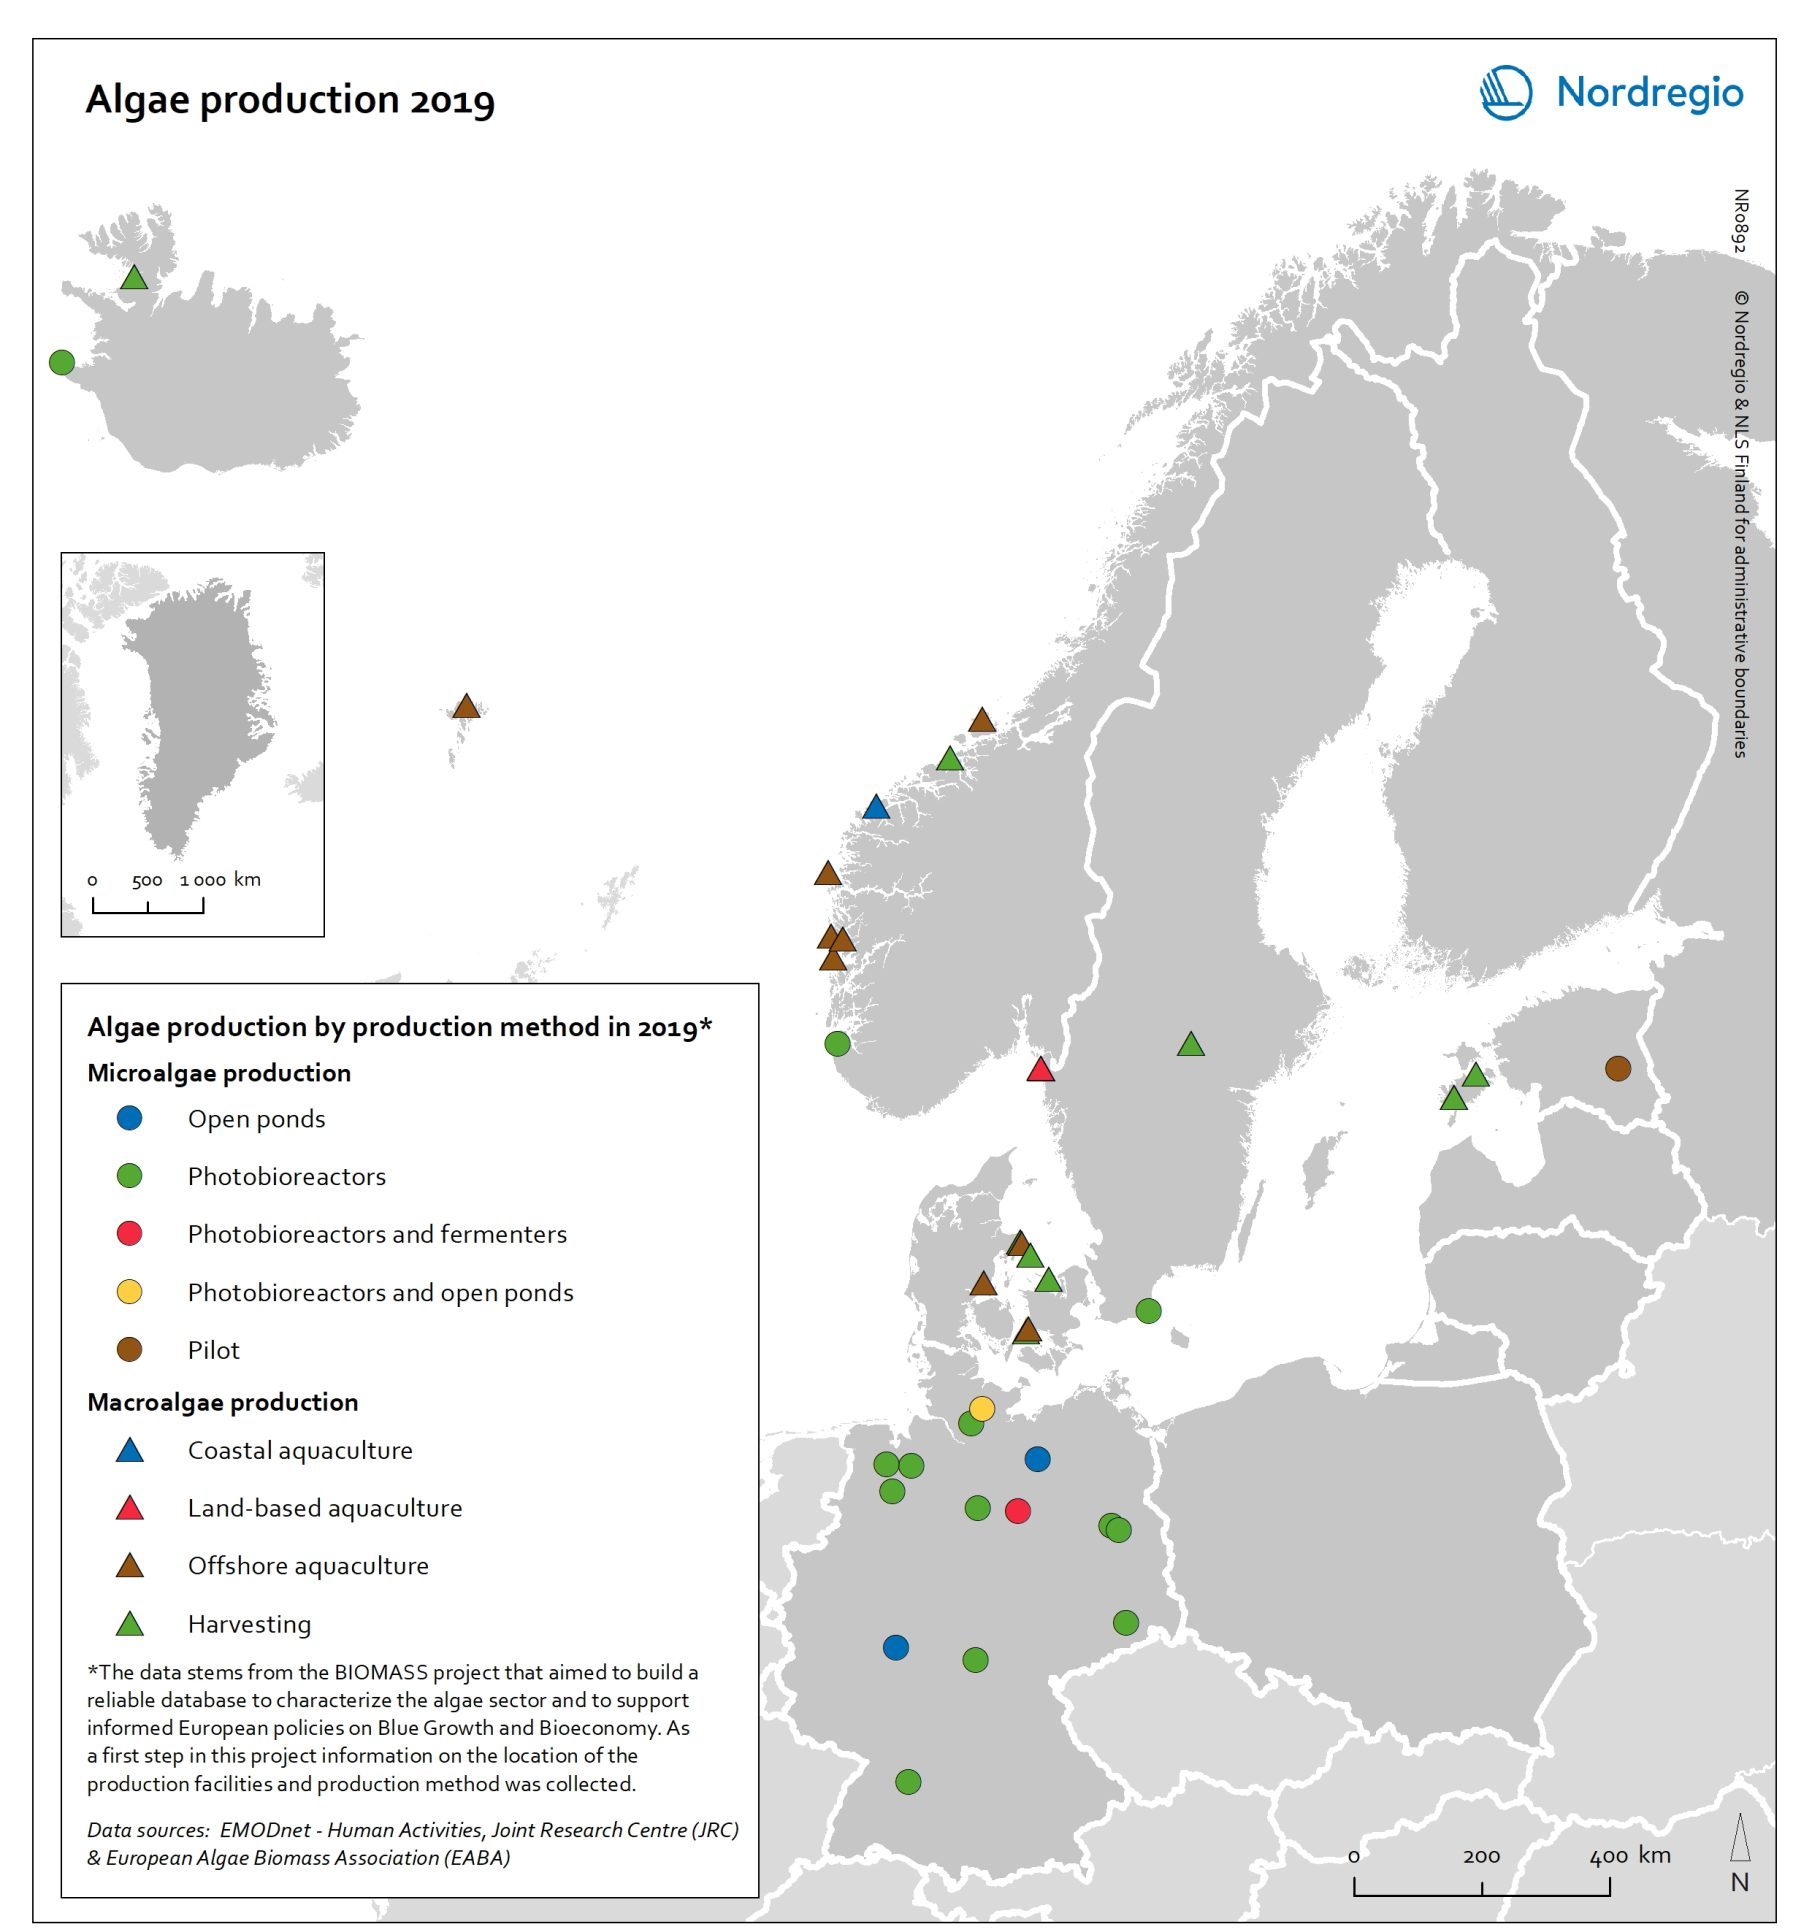
Algae production in 2019
This map shows location of algae production by production method in the Nordic Arctic and Baltic Sea Region in 2019 Algae and seaweeds are gaining attention as useful inputs for industries as diverse as energy and human food production. Aquatic vegetation – both in the seas and in freshwater – can grow at several times the pace of terrestrial plants, and the high natural oil content of some algae makes them ideal for producing a variety of products, from cosmetic oils to biofuels. At the same time, algae farming has added value in potential synergies with farming on land, as algae farms utilise nutrient run-off and reduce eutrophication. In addition, aquatic vegetation is a highly versatile feedstock. Algae and seaweed thrive in challenging and varied conditions and can be transformed into products ranging from fuel, feeds, fertiliser, and chemicals, to third-generation sugar and biomass. These benefits are the basis for seaweed and algae emerging as one of the most important bioeconomy trends in the Nordic Arctic and Baltic Sea region. The production of algae for food and industrial uses has hence significant potential, particularly in terms of environmental impact, but it is still at an early stage. The production of algae (both micro- and macroalgae) can take numerous forms, as shown by this map. At least nine different production methods were identified in the region covered in this analysis. A total of 41 production sites were operating in Denmark, Estonia, the Faroe Islands, Iceland, Norway, Germany, and Sweden. Germany has by far the most sites for microalgae production, whereas Denmark and Norway have the most macroalgae sites.
 2021 December
 - Arctic
- Baltic Sea Region
- Nordic Region
- Others
Change in share of biofuels in transport from 2010 to 2018
This map shows change in share of biofuels in final energy consumption in transport in the Nordic Arctic and Baltic Sea Region from 2010 to 2018. Even though a target for greater use of biofuels has been EU policy since the Renewable Energy and Fuel Quality Directives of 2009, development has been slow. The darker shades of blue on the map represent higher increase, and the lighter shades of blue reflect lower increase. The lilac color represent decrease. The Baltic Sea represents a divide in the region, with countries to the north and west experiencing growth in the use of biofuels for transport in recent years. Sweden stands out (16 per cent growth), while the other Nordic countries has experienced more modest increase. In the southern and eastern parts of the region, the use of biofuels for transport has largely stagnated. Total biofuel consumption for transport has risen more than the figure indicates due to an increase in transport use over the period.
- 2021 December
- Arctic
- Baltic Sea Region
- Nordic Region
- Transport
Share of biofuels in transport in 2018
This map shows the share of biofuels in final energy consumption in transport in the Nordic Arctic and Baltic Sea Region in 2018. There has been considerable political support for biofuels and in the EU, this debate has been driven by the aim of reducing dependency on imported fuels. For instance, 10 per cent of transport fuel should be produced from renewable sources. The darker shades on the map represent higher proportions, and the lighter shades reflect lower proportions. As presented by the map, only Sweden (20.7%) had reached the 10 per cent target in the Nordic Arctic and Baltic Region in 2018. Both Finland (8.3%) and Norway (8.3%) were close by the target, while the other countries in the region were still lagging behind, particularly the Baltic countries.
- 2021 December
- Arctic
- Baltic Sea Region
- Nordic Region
- Transport
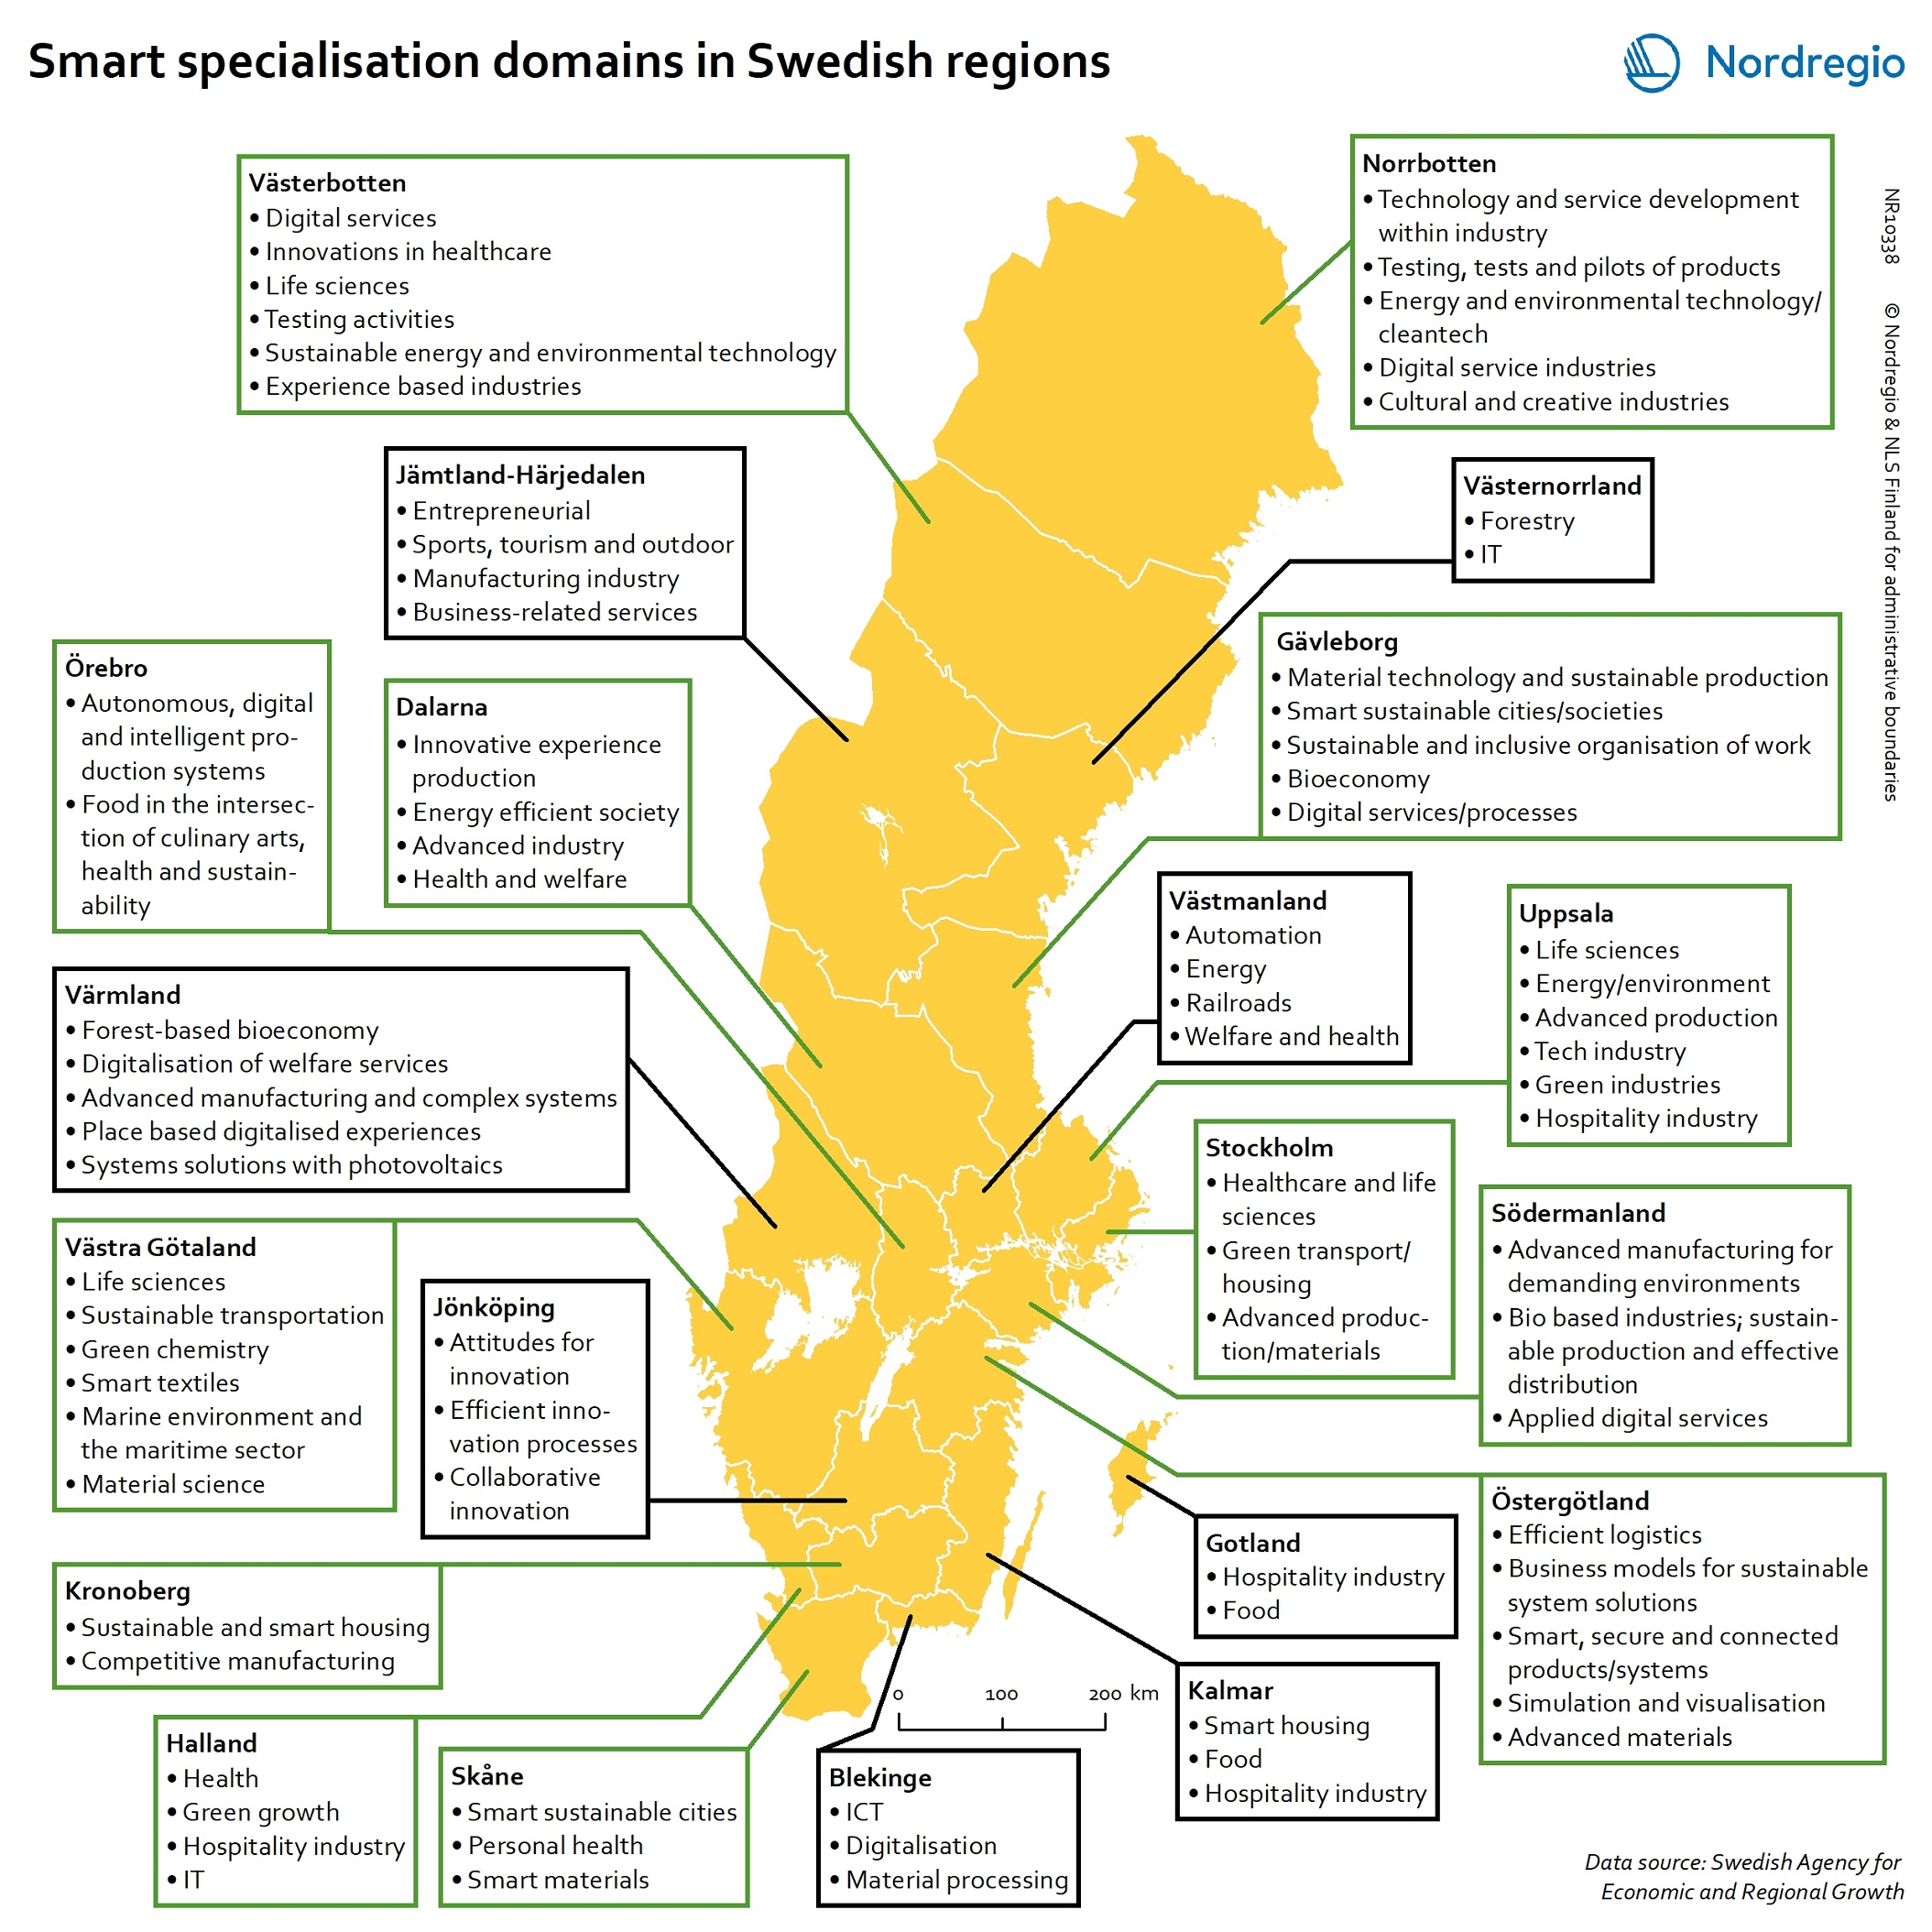
Smart specialisation domains in Swedish regions
This map gives an overview of the S3 focus areas in the Swedish regions in 2019. The major S3 domains in Sweden shown in the map provide a good overview of the key specialisation areas in Sweden. It is possible, for example, to check which Swedish regions have “green”, “sustainable”, “environment” at their smart specialisation domains (marked in green in their respective infoboxes for the domains in the figure). The information illustrated in the map can assist Swedish regions when they are considering opportunities for S3 synergy and co-operation with each other. In Sweden, the Swedish Agency for Economic and Regional Growth (Tillväxtverket) is a central actor in assisting regions in their work with smart specialisation. Tillväxtverket promotes opportunities for cooperation between the Swedish regional S3 processes and provides relevant information and learning seminars related to S3. Read the digital publication here.
- 2020 February
- Economy
- Research and innovation
- Sweden
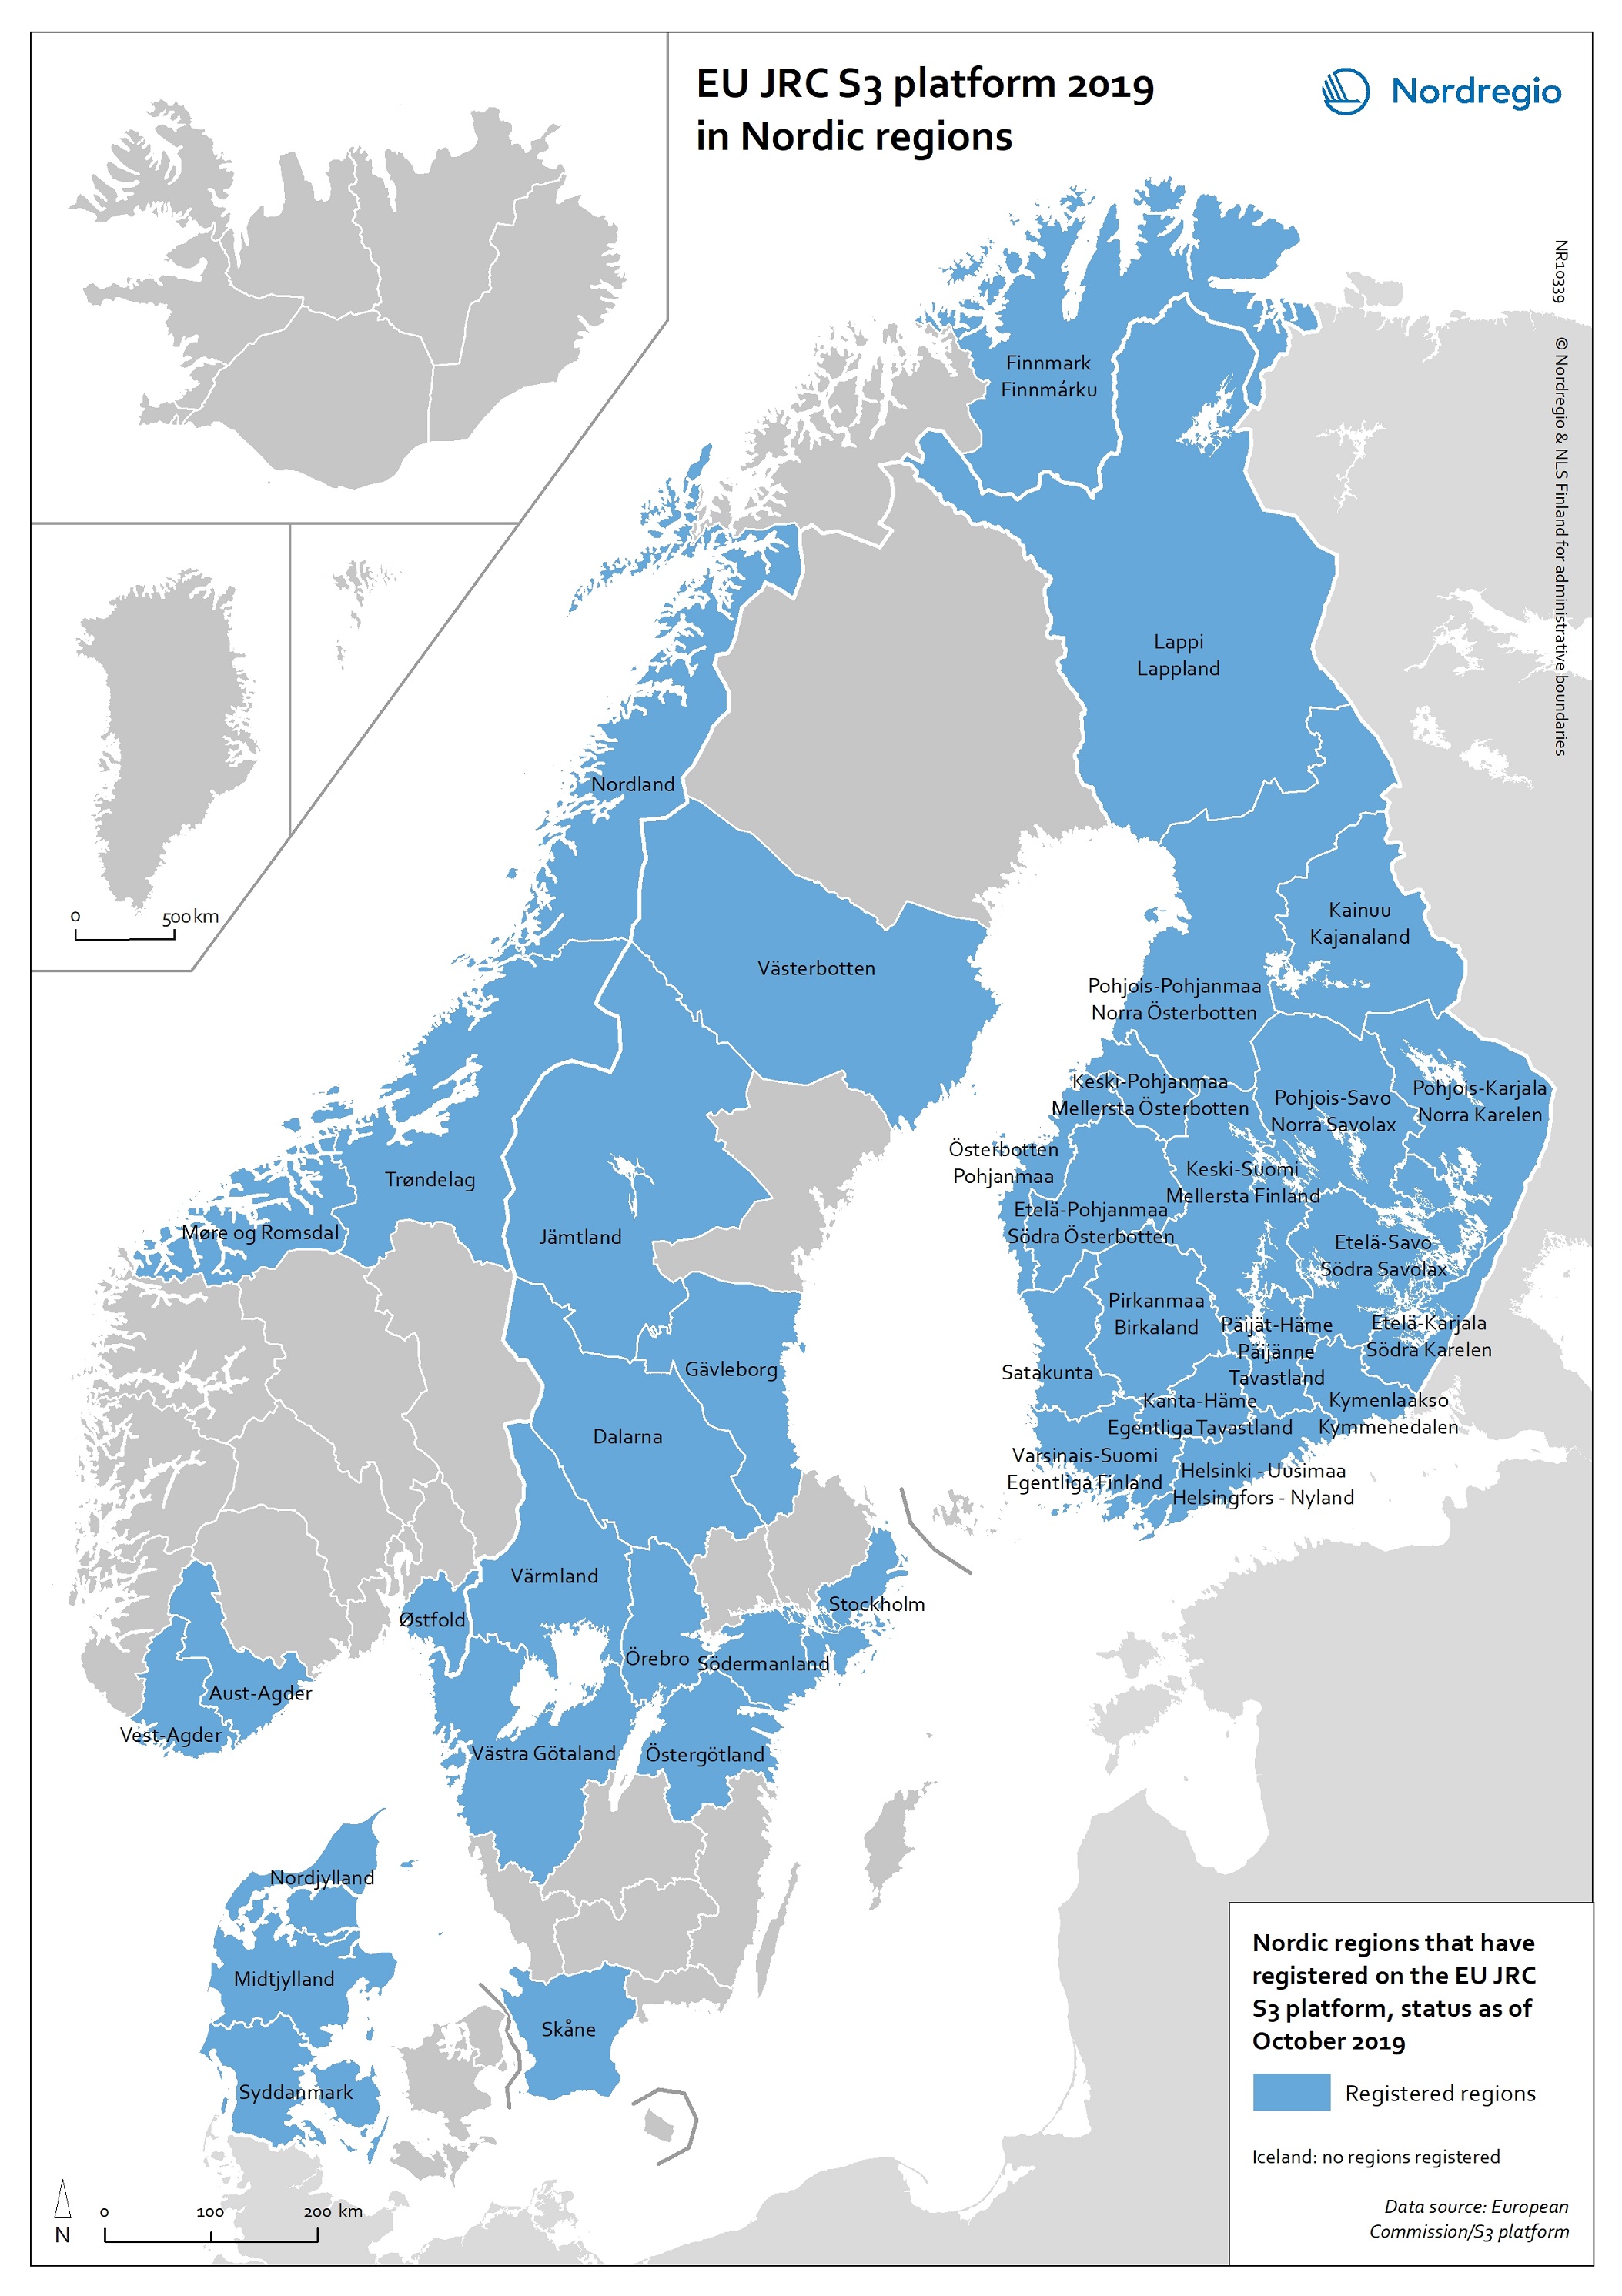
EU JRC S3 Platform 2019 in Nordic regions
This map shows the Nordic Regions that have registered on the EU JRC S3 platform, status as of October 2019. The regions that have registered on the S3 platform receive practical advice and broadened opportunities for international networking. In October 2019, there were 182 EU regions registered on the S3 platform, as well as 18 non-EU Member State regions. Of these regions, 38 are Nordic. It is worth noting that, as a non-EU member state, Norway has seven registered regions on the platform. Registration on the S3 platform is by no means a guarantee of success of a regional smart specialisation process, but it indicates the willingness of the region to learn more about S3 and to participate in international and interregional S3 cooperation through the possibilities provided by the S3 platform. The smart specialisation concept has been diffusing rapidly across Europe in the 2010s, as an increasing number of regions adopt it and design strategies departing from their own preconditions. The S3 platform in Seville, Spain, hosted by the Institute for Prospective Technological Studies (IPTS), was established in 2011 to assist EU countries and regions to develop, implement and review their smart specialisation strategies. The S3 platform provides information, methodologies, expertise and advice to national and regional policymakers, promotes mutual learning and transnational co-operation, and contributes to academic debates around the concept of smart specialisation. Read the digital publication here.
- 2020 February
- Economy
- Nordic Region
- Research and innovation
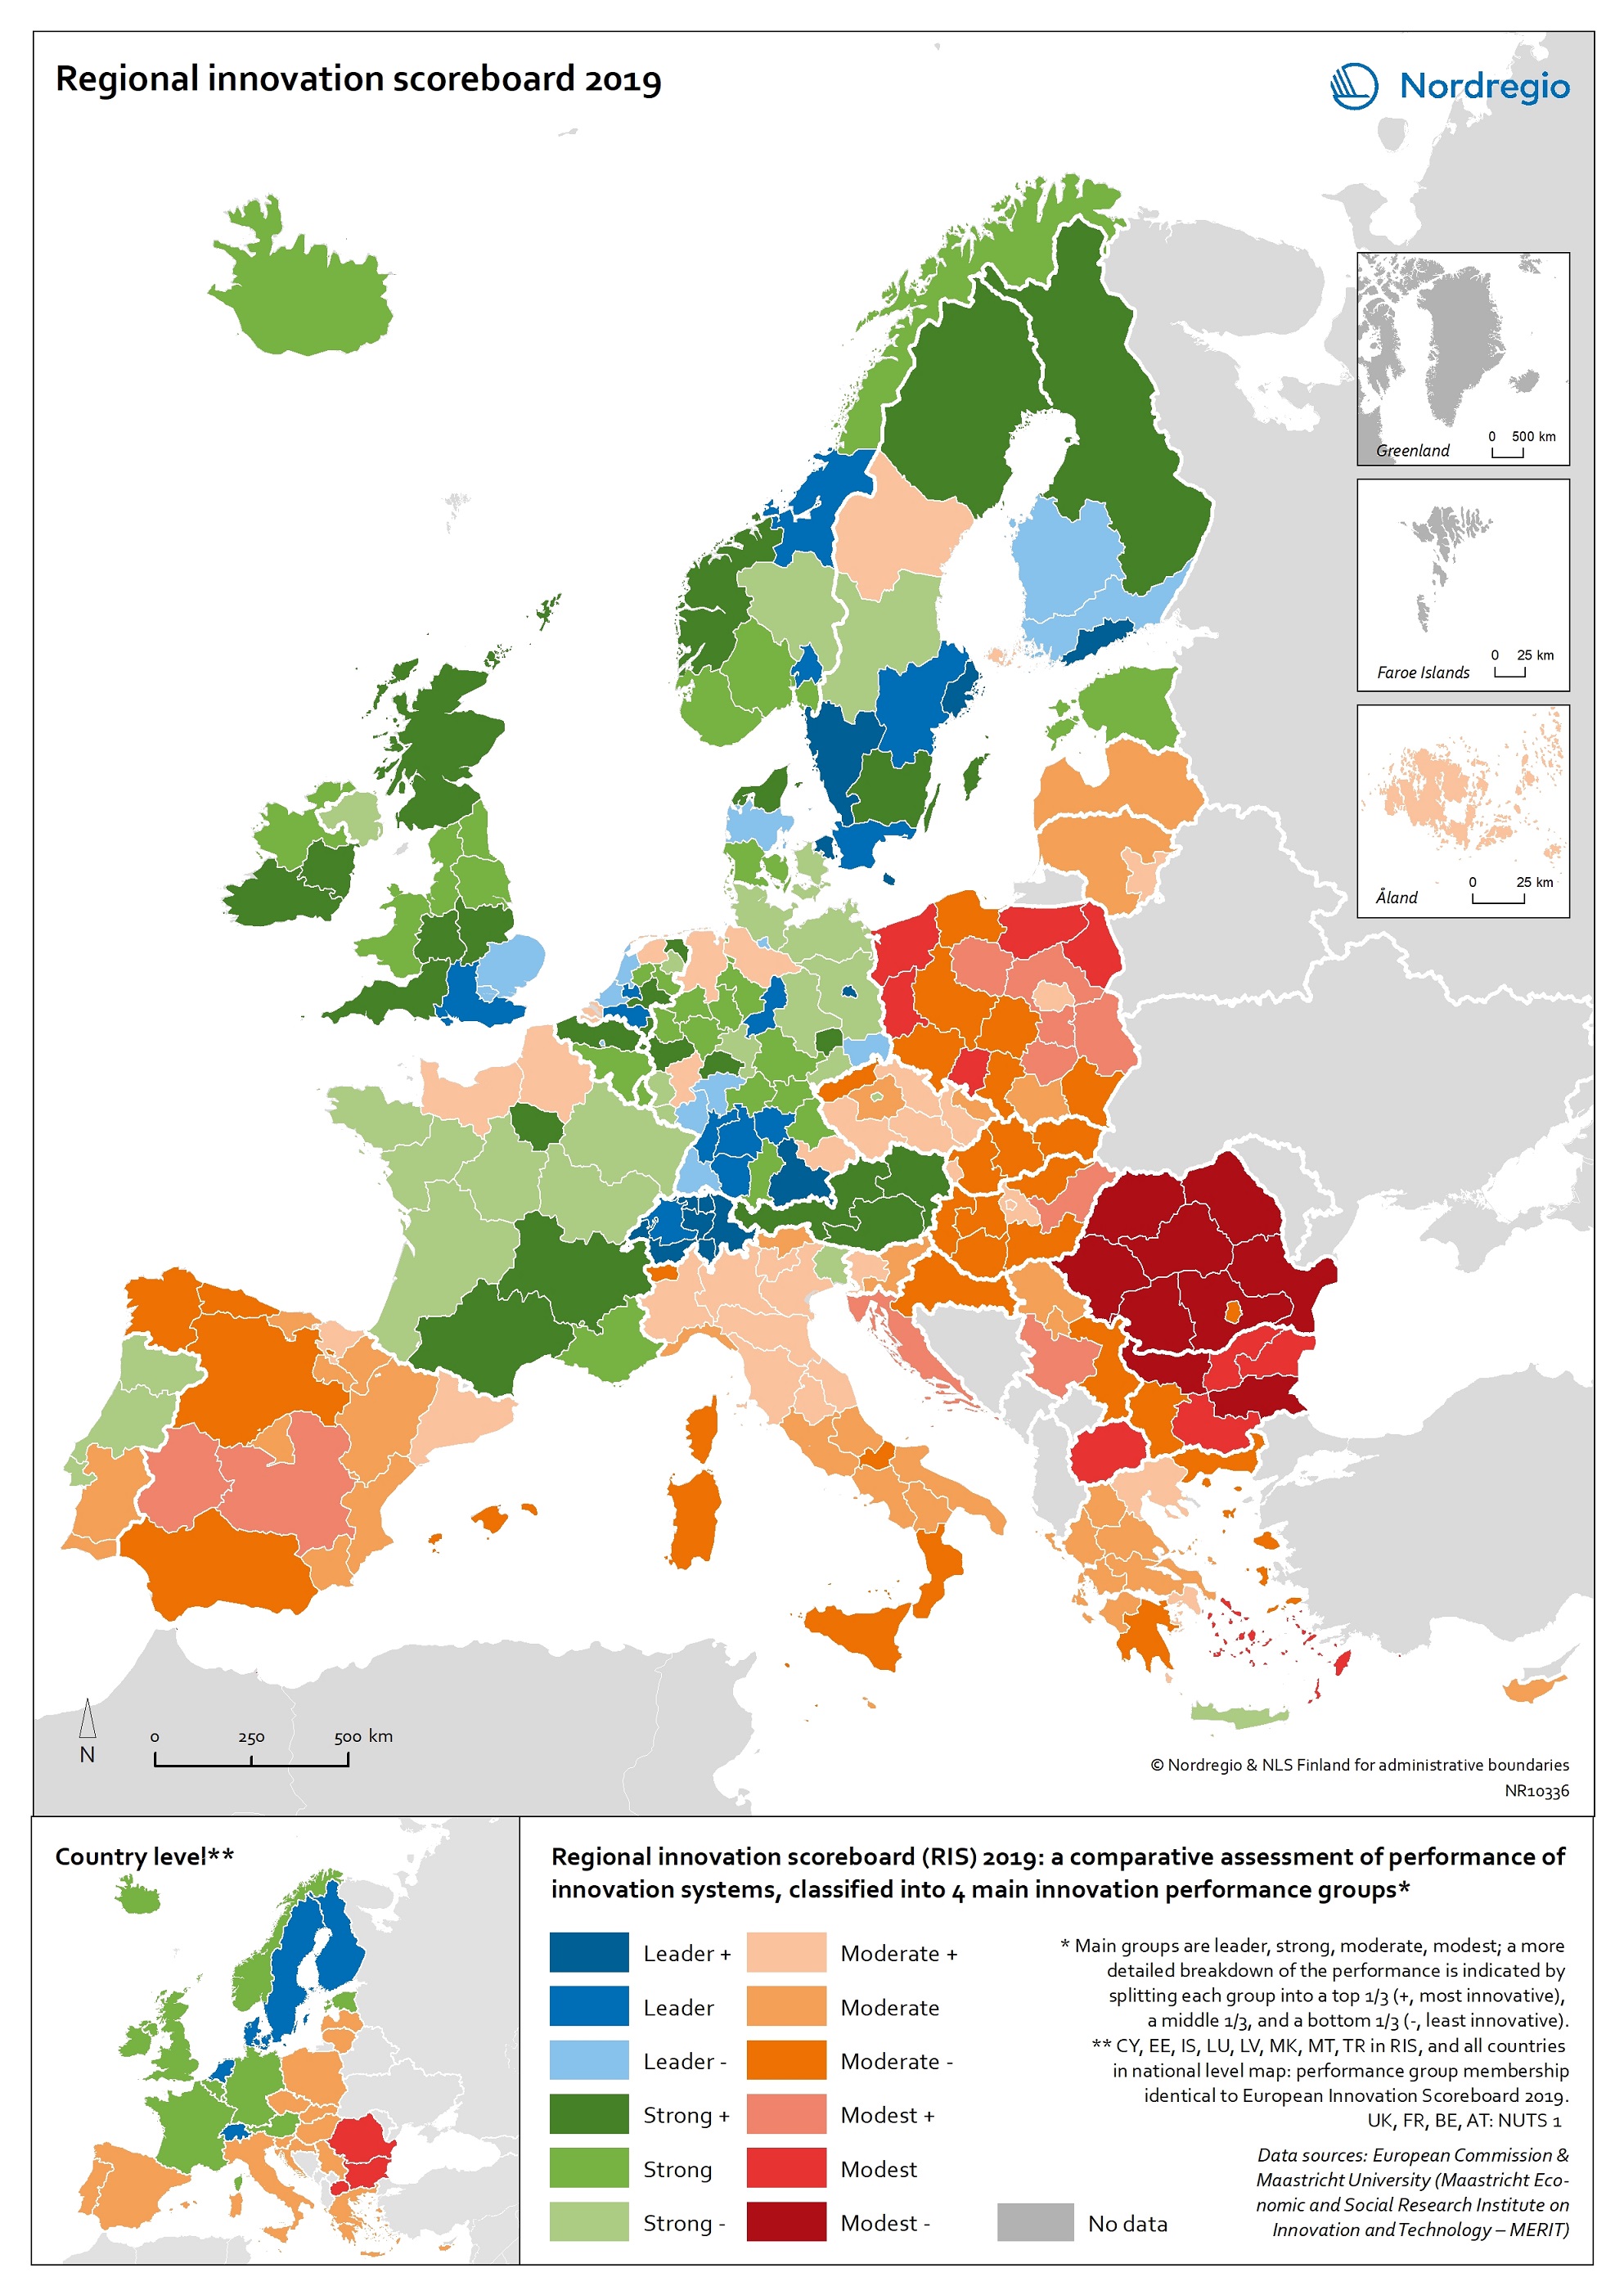
Regional innovation scoreboard 2019
This map shows the regional innovation scoreboard (RIS) in the European regions in 2019. The small map shows the innovation scoreboard at national level. The index shows the performance of innovation systems, classified into four main performance groups (leader, strong, moderate and modest). The European innovation scoreboard provides a comparative assessment of the research and innovation performance in European countries. It assesses the relative strengths and weaknesses of national innovation systems and helps countries identify areas they need to address. The Regional innovation scoreboard (RIS), a regional extension of the European innovation scoreboard, assesses the innovation performance of European regions on a limited number of indicators. The RIS 2019 covers 238 regions across 23 EU countries, as well as Norway, Serbia and Switzerland. Cyprus, Estonia, Latvia, Luxembourg and Malta are also included at country level. The RIS 2019 is a comparative assessment of regional innovation based on the European innovation scoreboard methodology, using 18 of the latter’s 27 indicators. It provides a more detailed breakdown of the performance groups with contextual data that can be used to analyse and compare structural economic, business and socio-demographic differences between regions. The Nordic regions are doing well in an overall RIS comparison regarding innovation performance. There are, however, considerable differences in innovation performance between the Nordic regions. For example, the capital regions have higher levels of innovation performance than more rural and peripheral regions, according to RIS 2019. This is often due to the critical mass of companies and the spatial significance of the proximity of firms and entrepreneurs, enabling knowledge-sharing and spill-over effects. Read the digital publication here.
- 2020 February
- Economy
- Europe
- Research and innovation
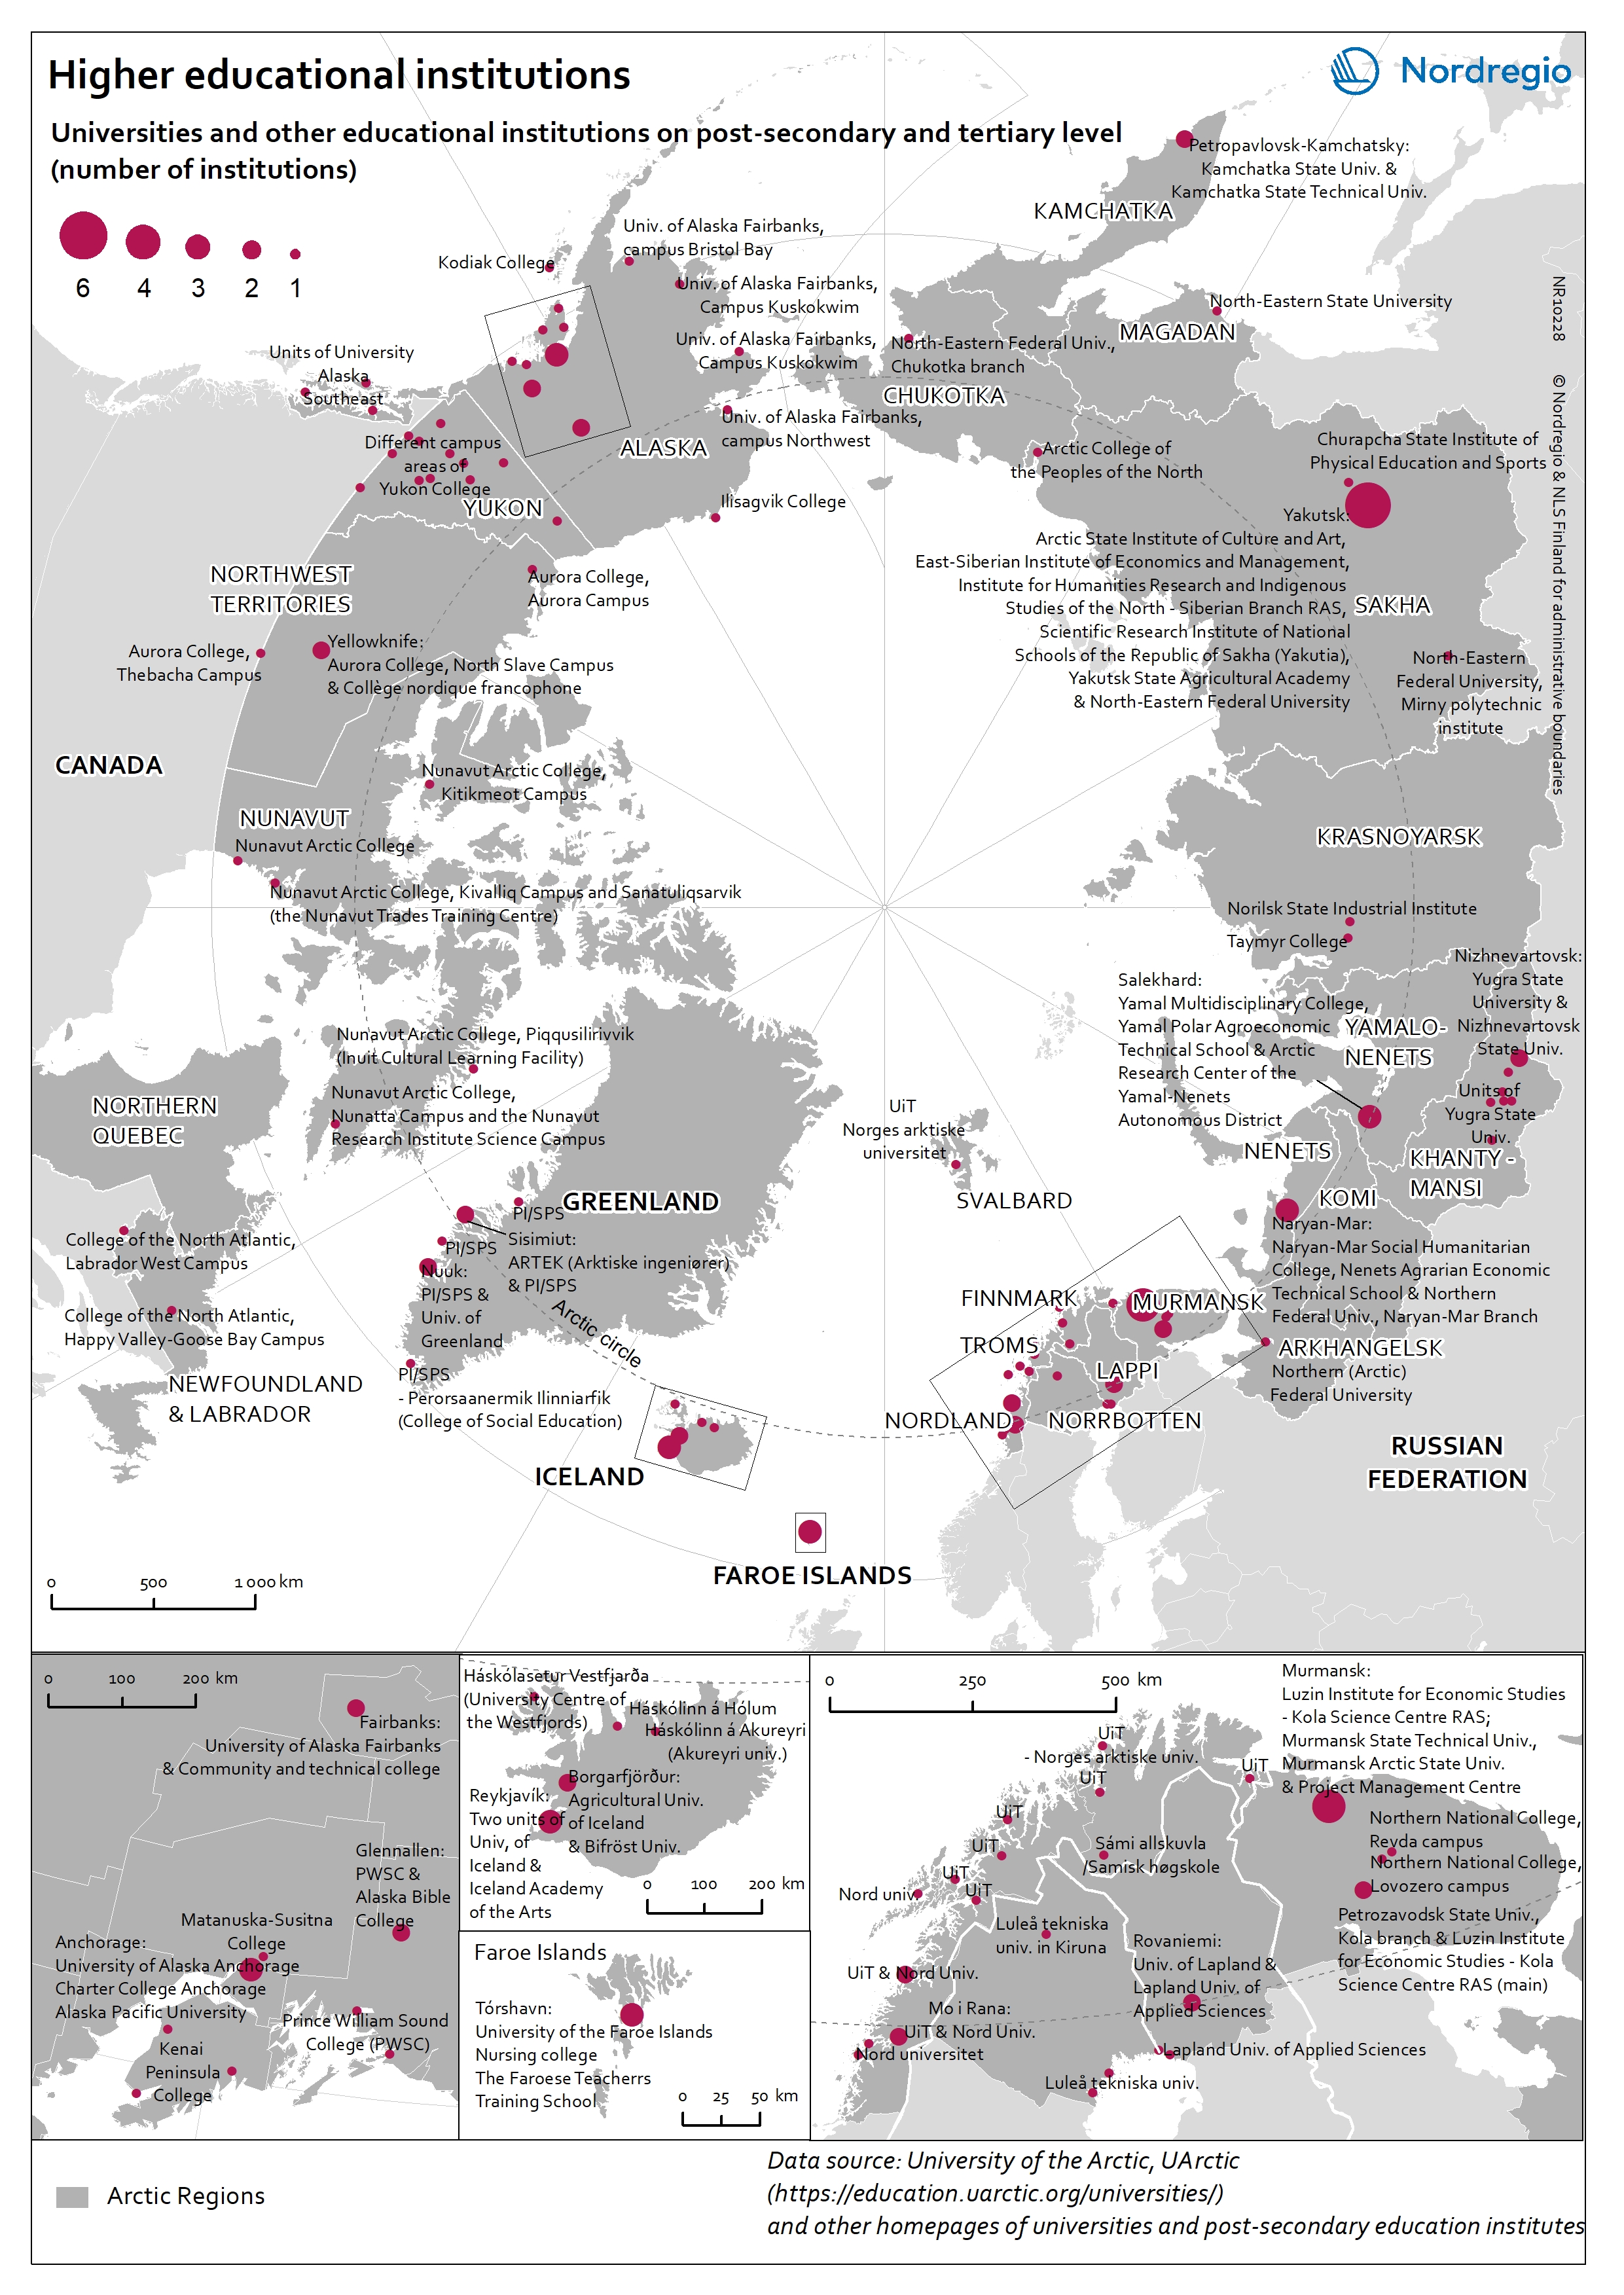
Higher educational institutions in the Arctic
The map shows universities and other educational institutions on post-secondary and tertiary level located in the Arctic. The red circles indicate a location of a university, college, or campus areas within the Arctic. The size of the circle corresponds to the number of educational institutions in a specific location. There is a high density of educational education institutions around Anchorage (Alaska), in Iceland, the Faroe Islands and the Arctic Fennoscandia (see zoom-in maps). In the Yukon (Canada), the Yukon College is the main educational institution, which has several campus areas across the region. In the Russian Arctic the largest centres with higher educational institutions are in Murmansk, Naryan-Mar (Nenets), Nizhnevartovsk (Khanty-Mansi), Salekhard (Yamalo-Nenets), and Yakutsk (Sakha).
- 2019 March
- Arctic
- Others
- Research and innovation
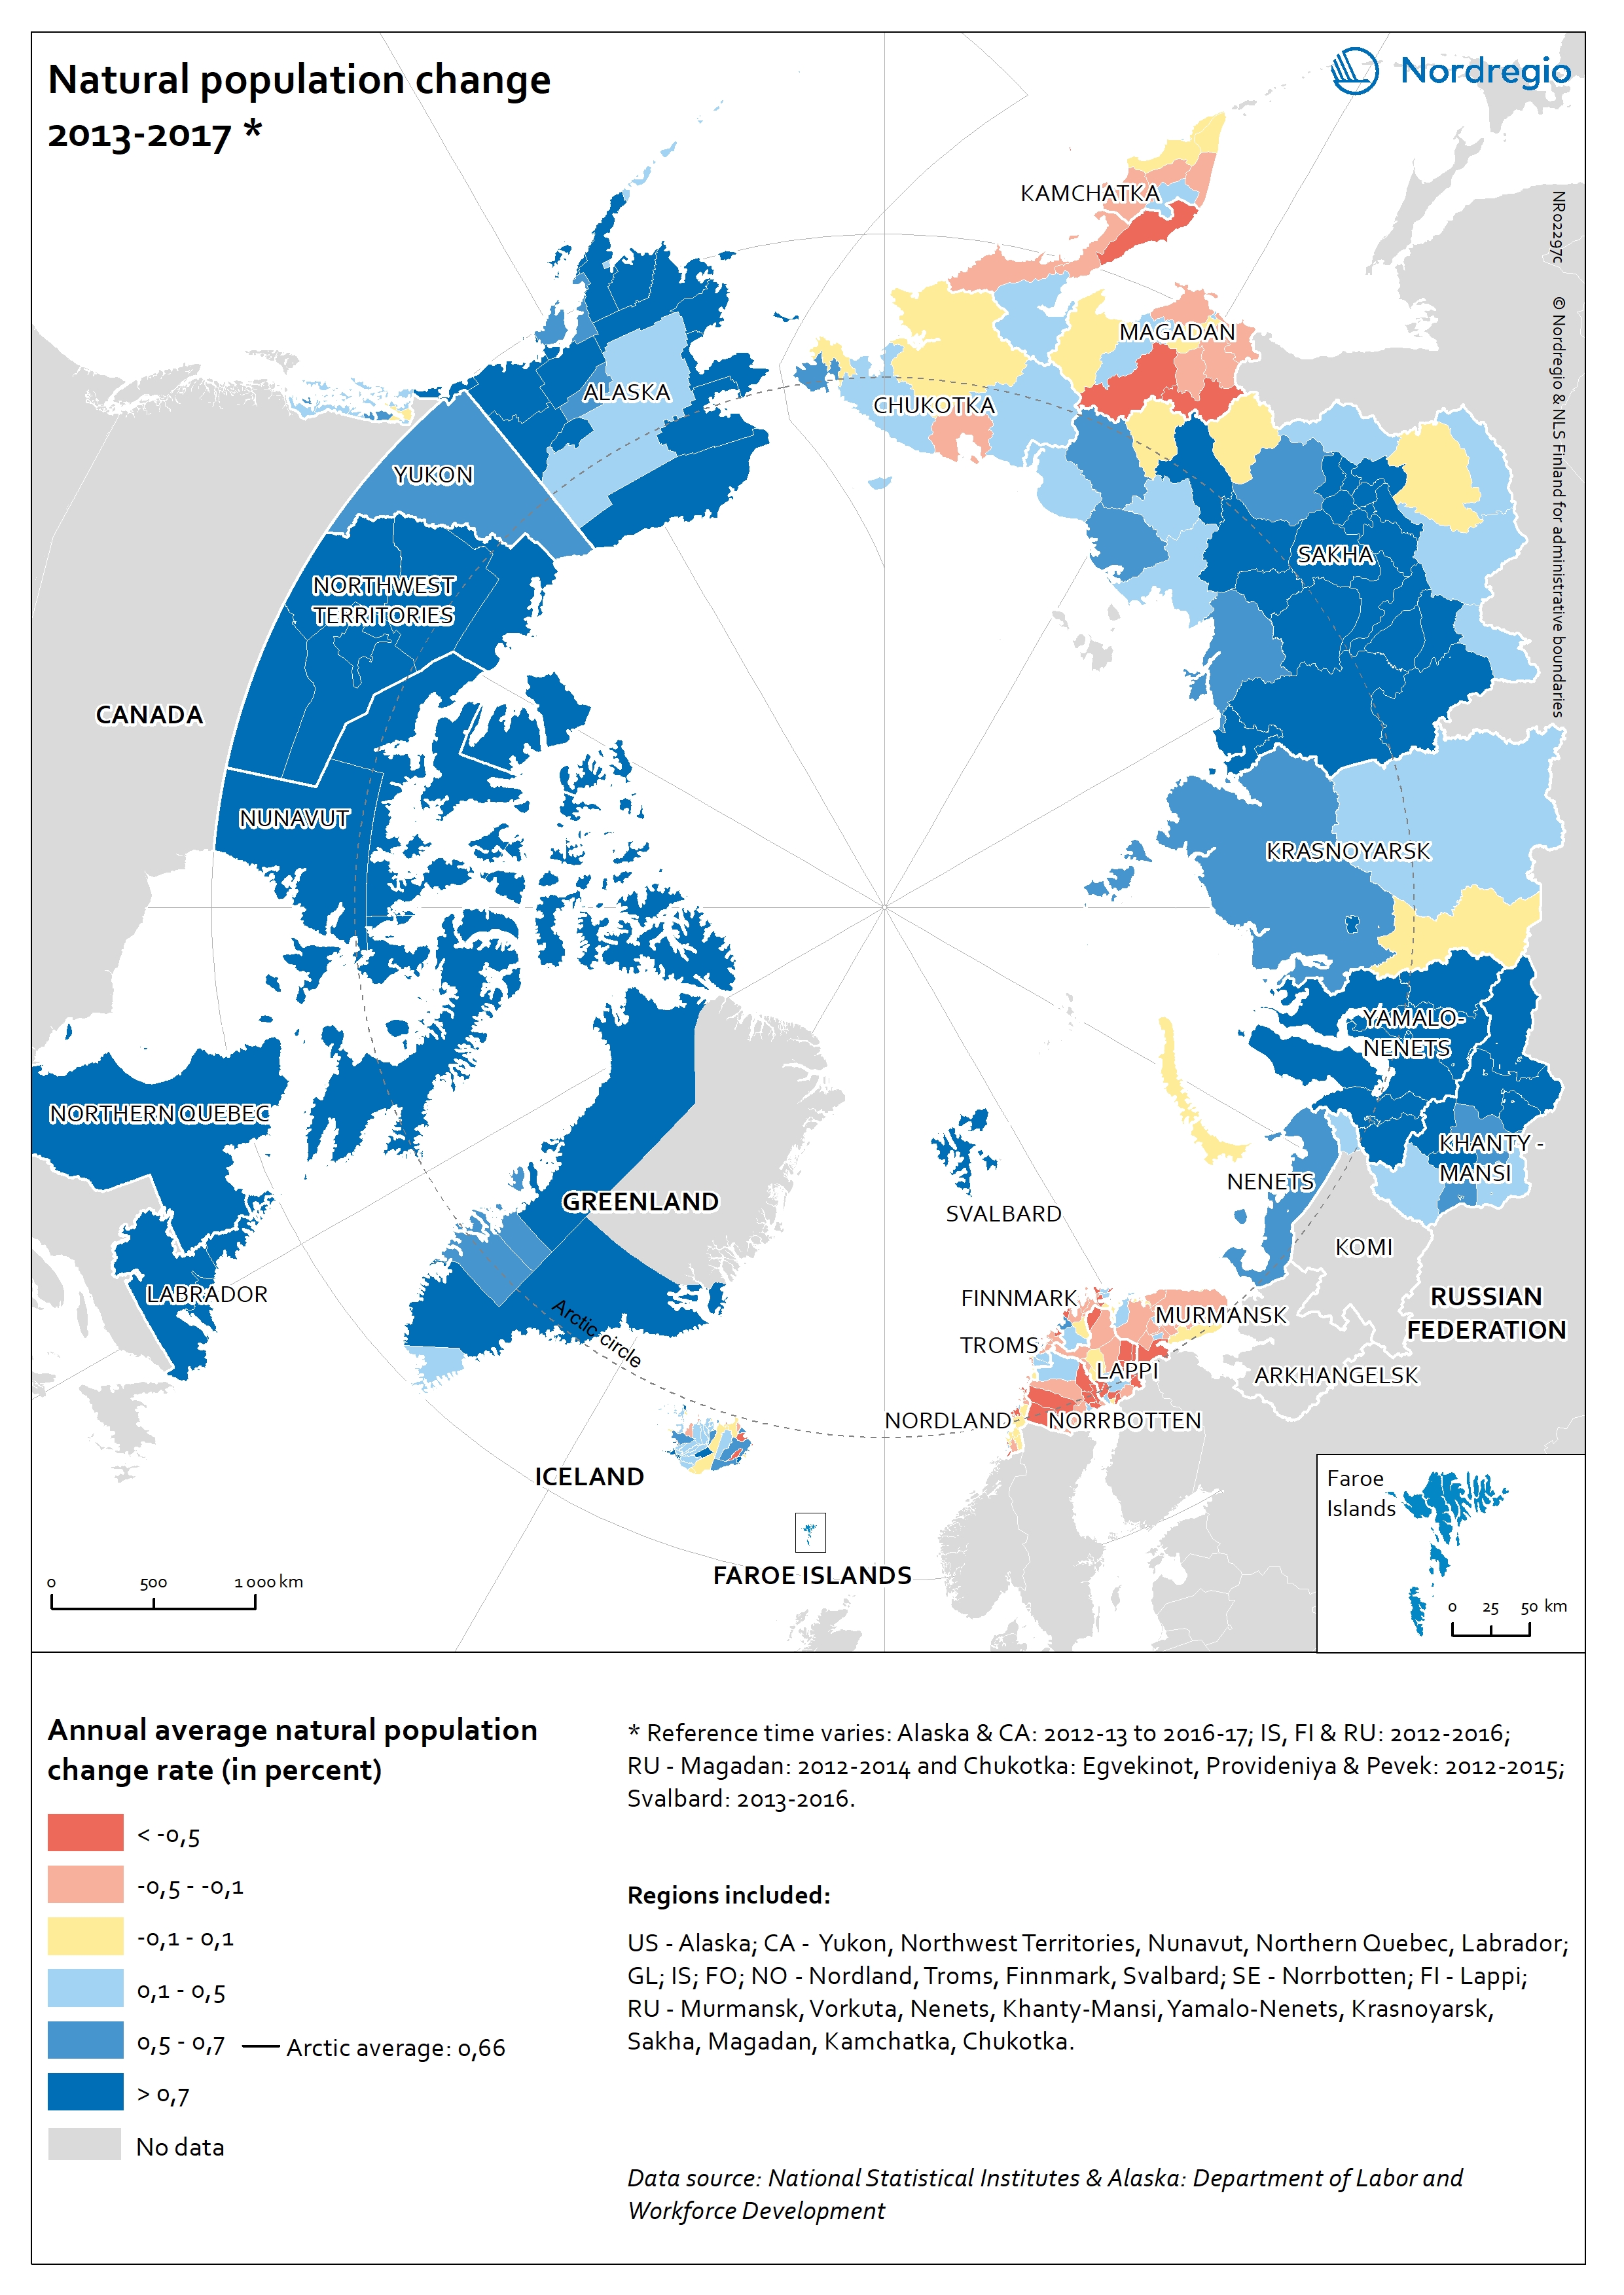
Natural population change in the Arctic
The map shows the annual natural population change rates in the Arctic subregions between 2013 and 2017. The blue tones indicate a positive change: subregions where the number of live births exceeds the number of deaths. The yellow colour indicates no or little change: subregions where the difference between births and deaths are close to zero. The red tones indicate negative change: subregions where the number of deaths exceed the number of live births. In the Artic the annual average natural population change rate was 0,66% between 2013 and 2017. The natural population change was positive especially in the Canadian Arctic, Alaska (USA), Greenland as well as in Yamalo-Nenets, Khanty-Mansi and in Sakha regions (Russian Federation). Natural population decline was the strongest in the Nordic Arctic, as well as in Murmansk, Magadan, and Kamchatka (Russian Federation).
- 2019 March
- Arctic
- Demography
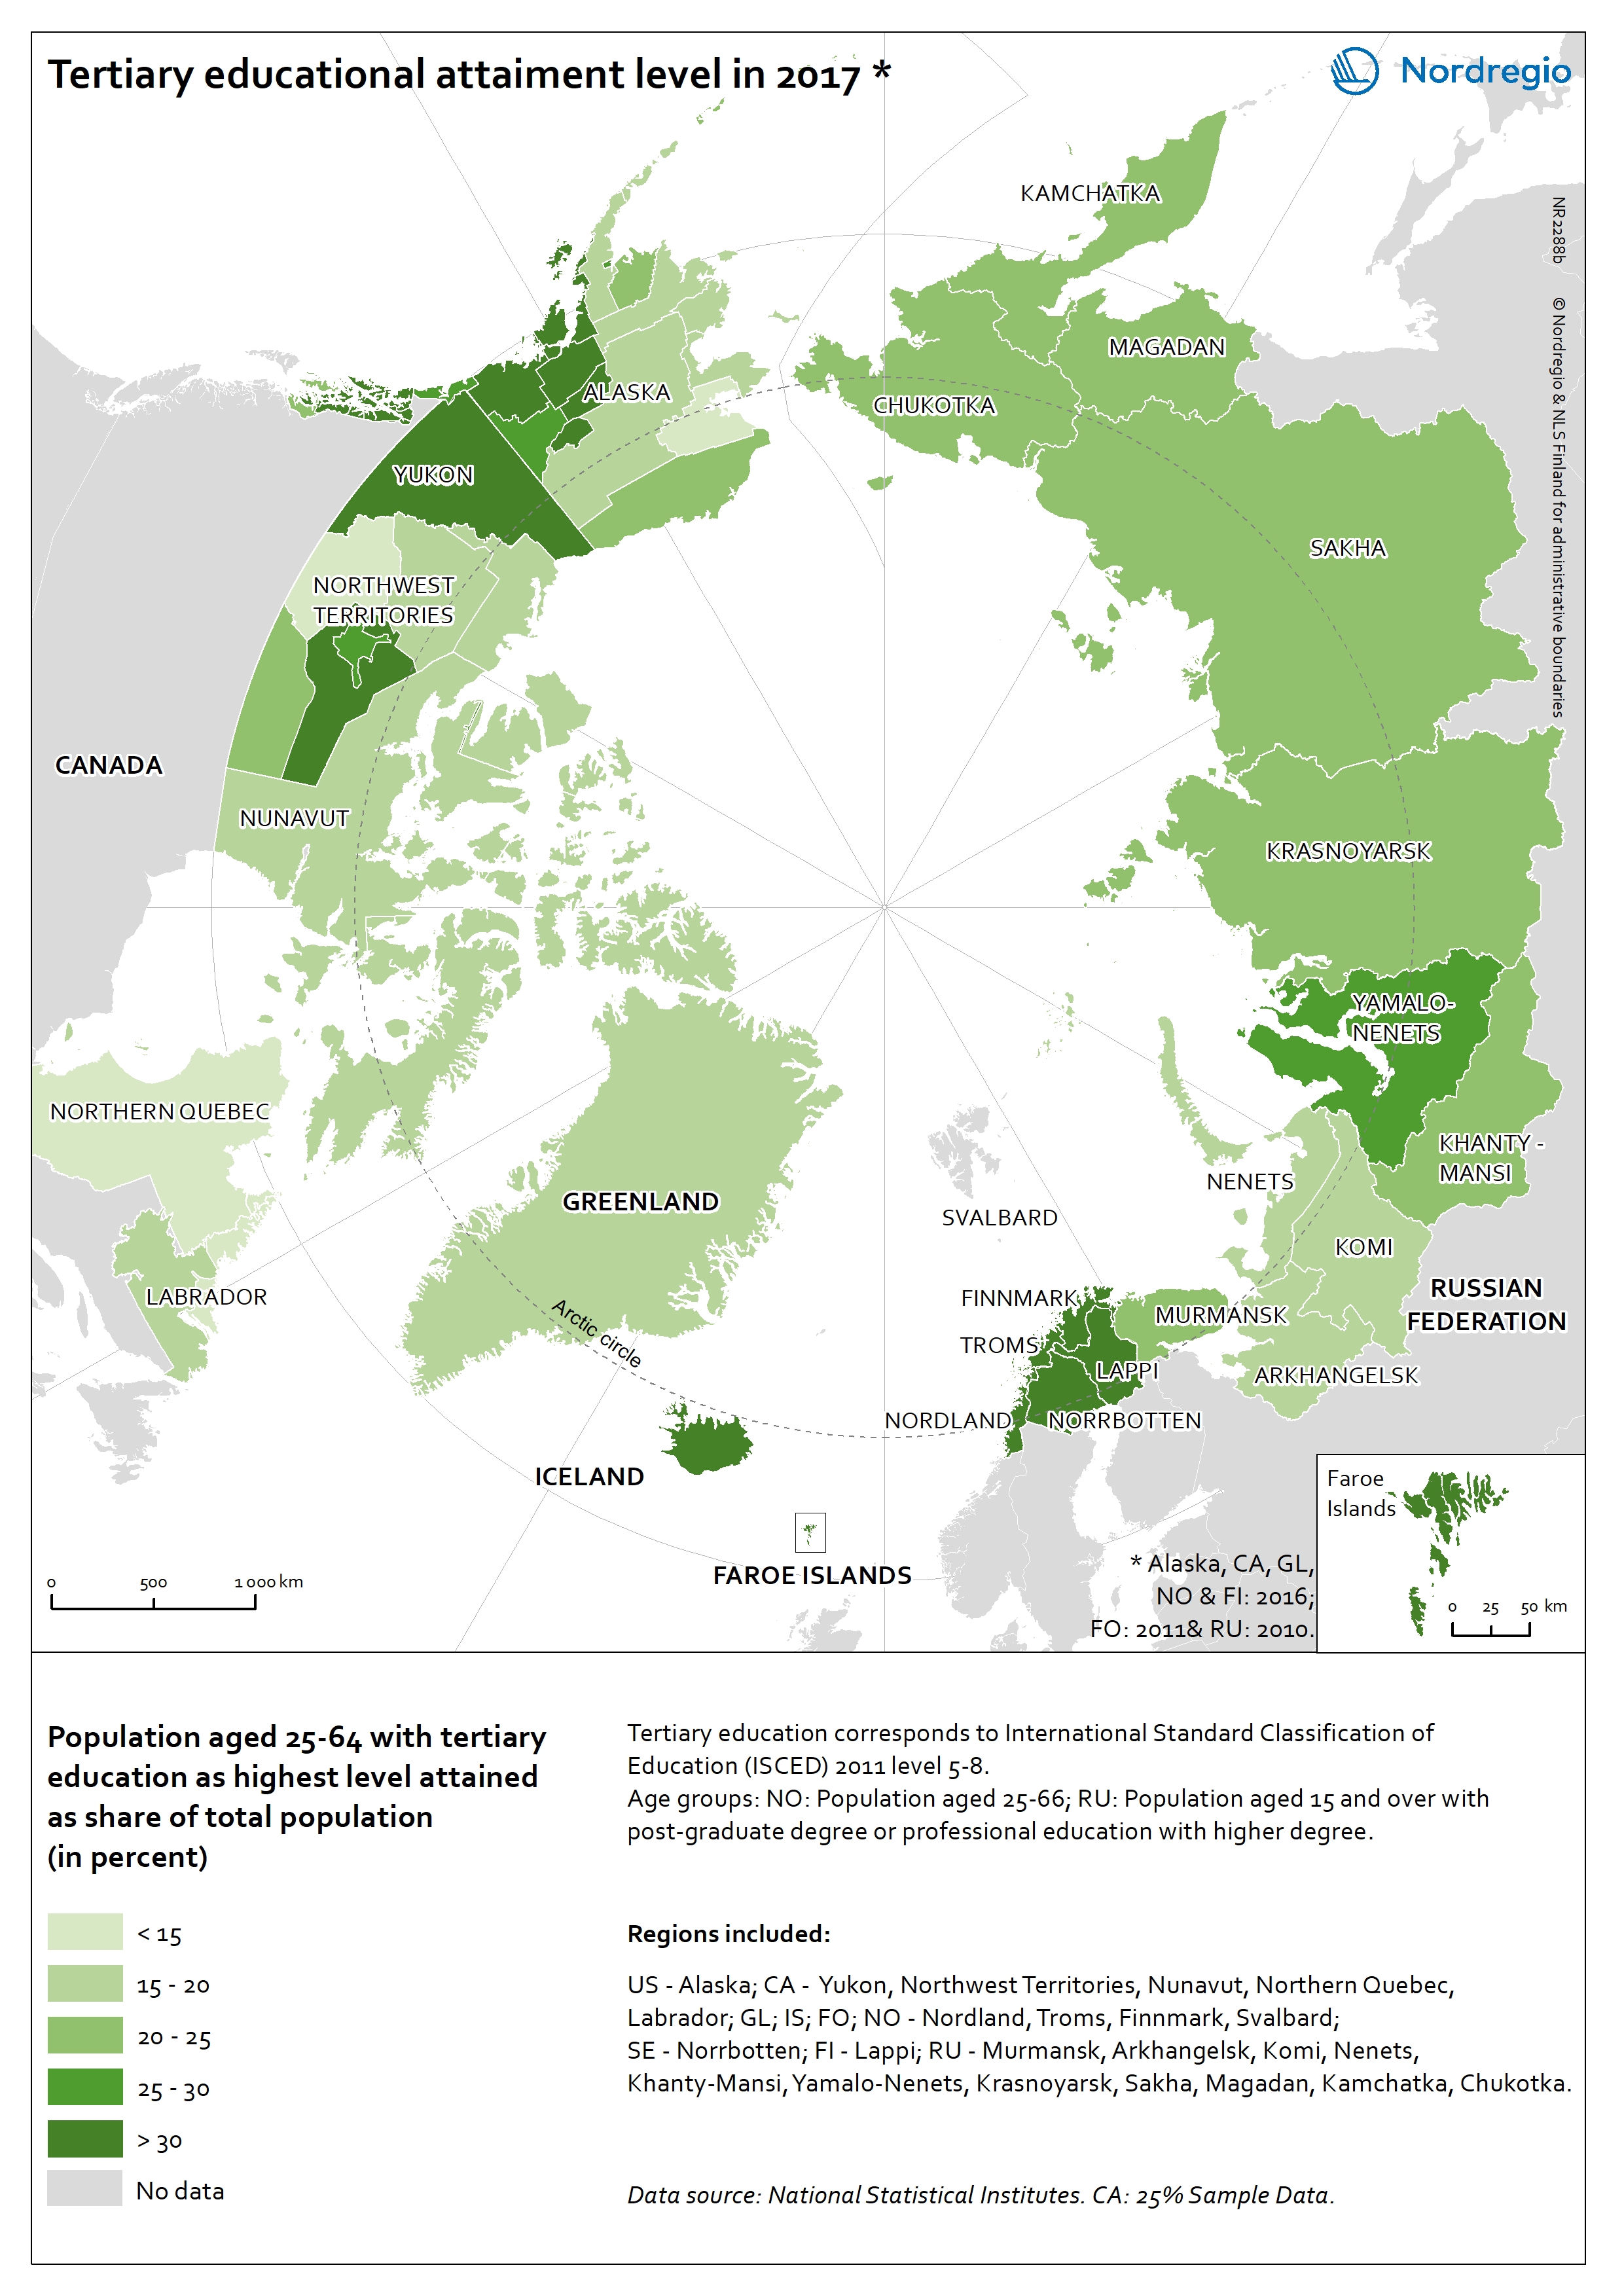
Tertiary educational attainment level in the Arctic
The map shows the percent of individuals aged 25-64 with tertiary education as the highest attainment level in the Arctic regions in 2017. Tertiary education corresponds to International Standard Classification of Education (ISCED) 2011 levels 5-8, which represent bachelor or equivalent and all higher attainment levels. The dark green tones show regions where more than 30% of individuals attained tertiary education as highest level. The light green tones show regions where less than 15% of individuals attained tertiary education as highest level. Highest shares of working aged population with tertiary education were found in Troms (Norway, 43,8%) and Iceland (42,5%). All other Nordic Arctic regions as well as Yukon (Canada, 33,3%) and in some regions in Alaska (USA) had high shares of highly educated people. Northern Quebec (Canada) had the lowest share of working aged population that attained tertiary education (13,0%).
- 2019 March
- Arctic
- Demography
- Economy
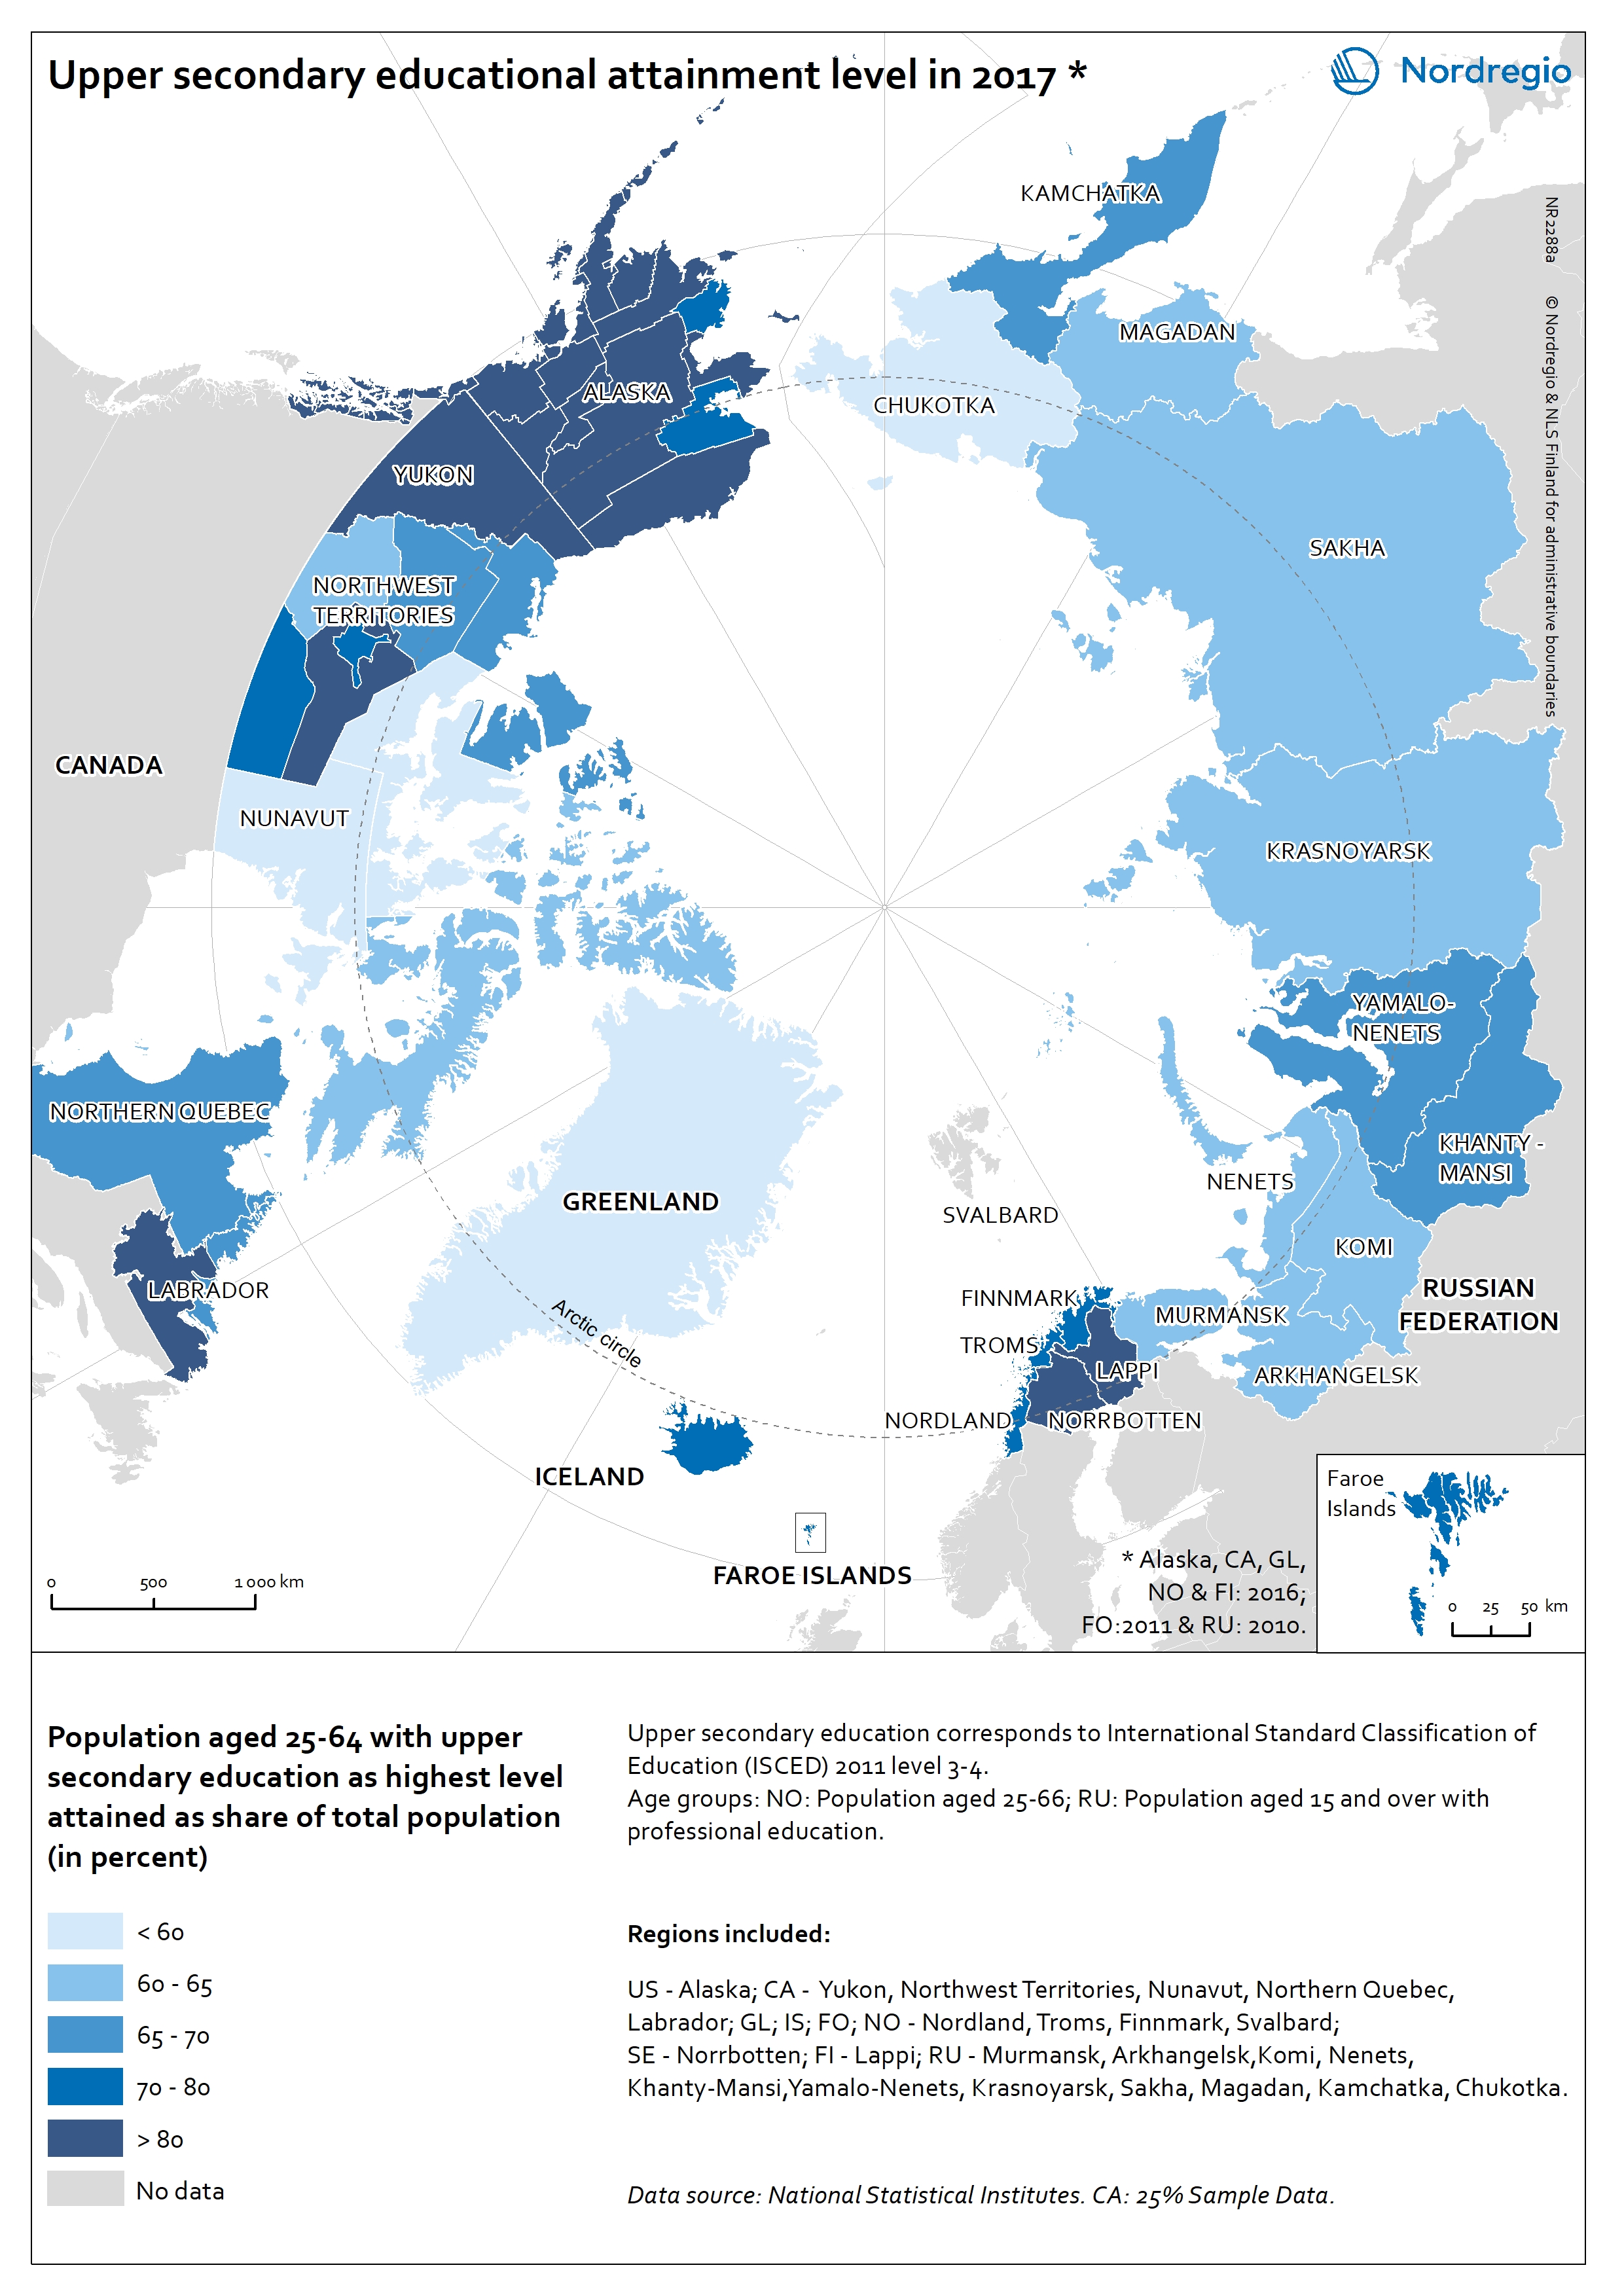
Upper secondary educational attainment level in the Arctic
The map shows the percent of individuals aged 25-64 with upper secondary education as highest level attained in 2017 in Arctic regions. The upper secondary education corresponds to International Standard Classification of Education (ISCED) 2011 levels 3-4. The dark blue tones show regions where more than 80% of individuals attained upper secondary education as highest level. The lightest blue tones show regions where less than 60% of individuals attained upper secondary education as highest level. Among the working age population, the number of individuals with upper secondary education was the highest in Alaska (USA, over 90%). Individuals with upper secondary education attainment level was also high – above 80% – in the Yukon and Labrador (Canada), Norrbotten (Sweden), and in Lappi (Finland). The lowest share of individual with upper secondary education was in Greenland (45,6%), Chukotka (Russian Federation, 58,4%) and in Nunavut (Canada, 59,1%).
- 2019 March
- Arctic
- Demography
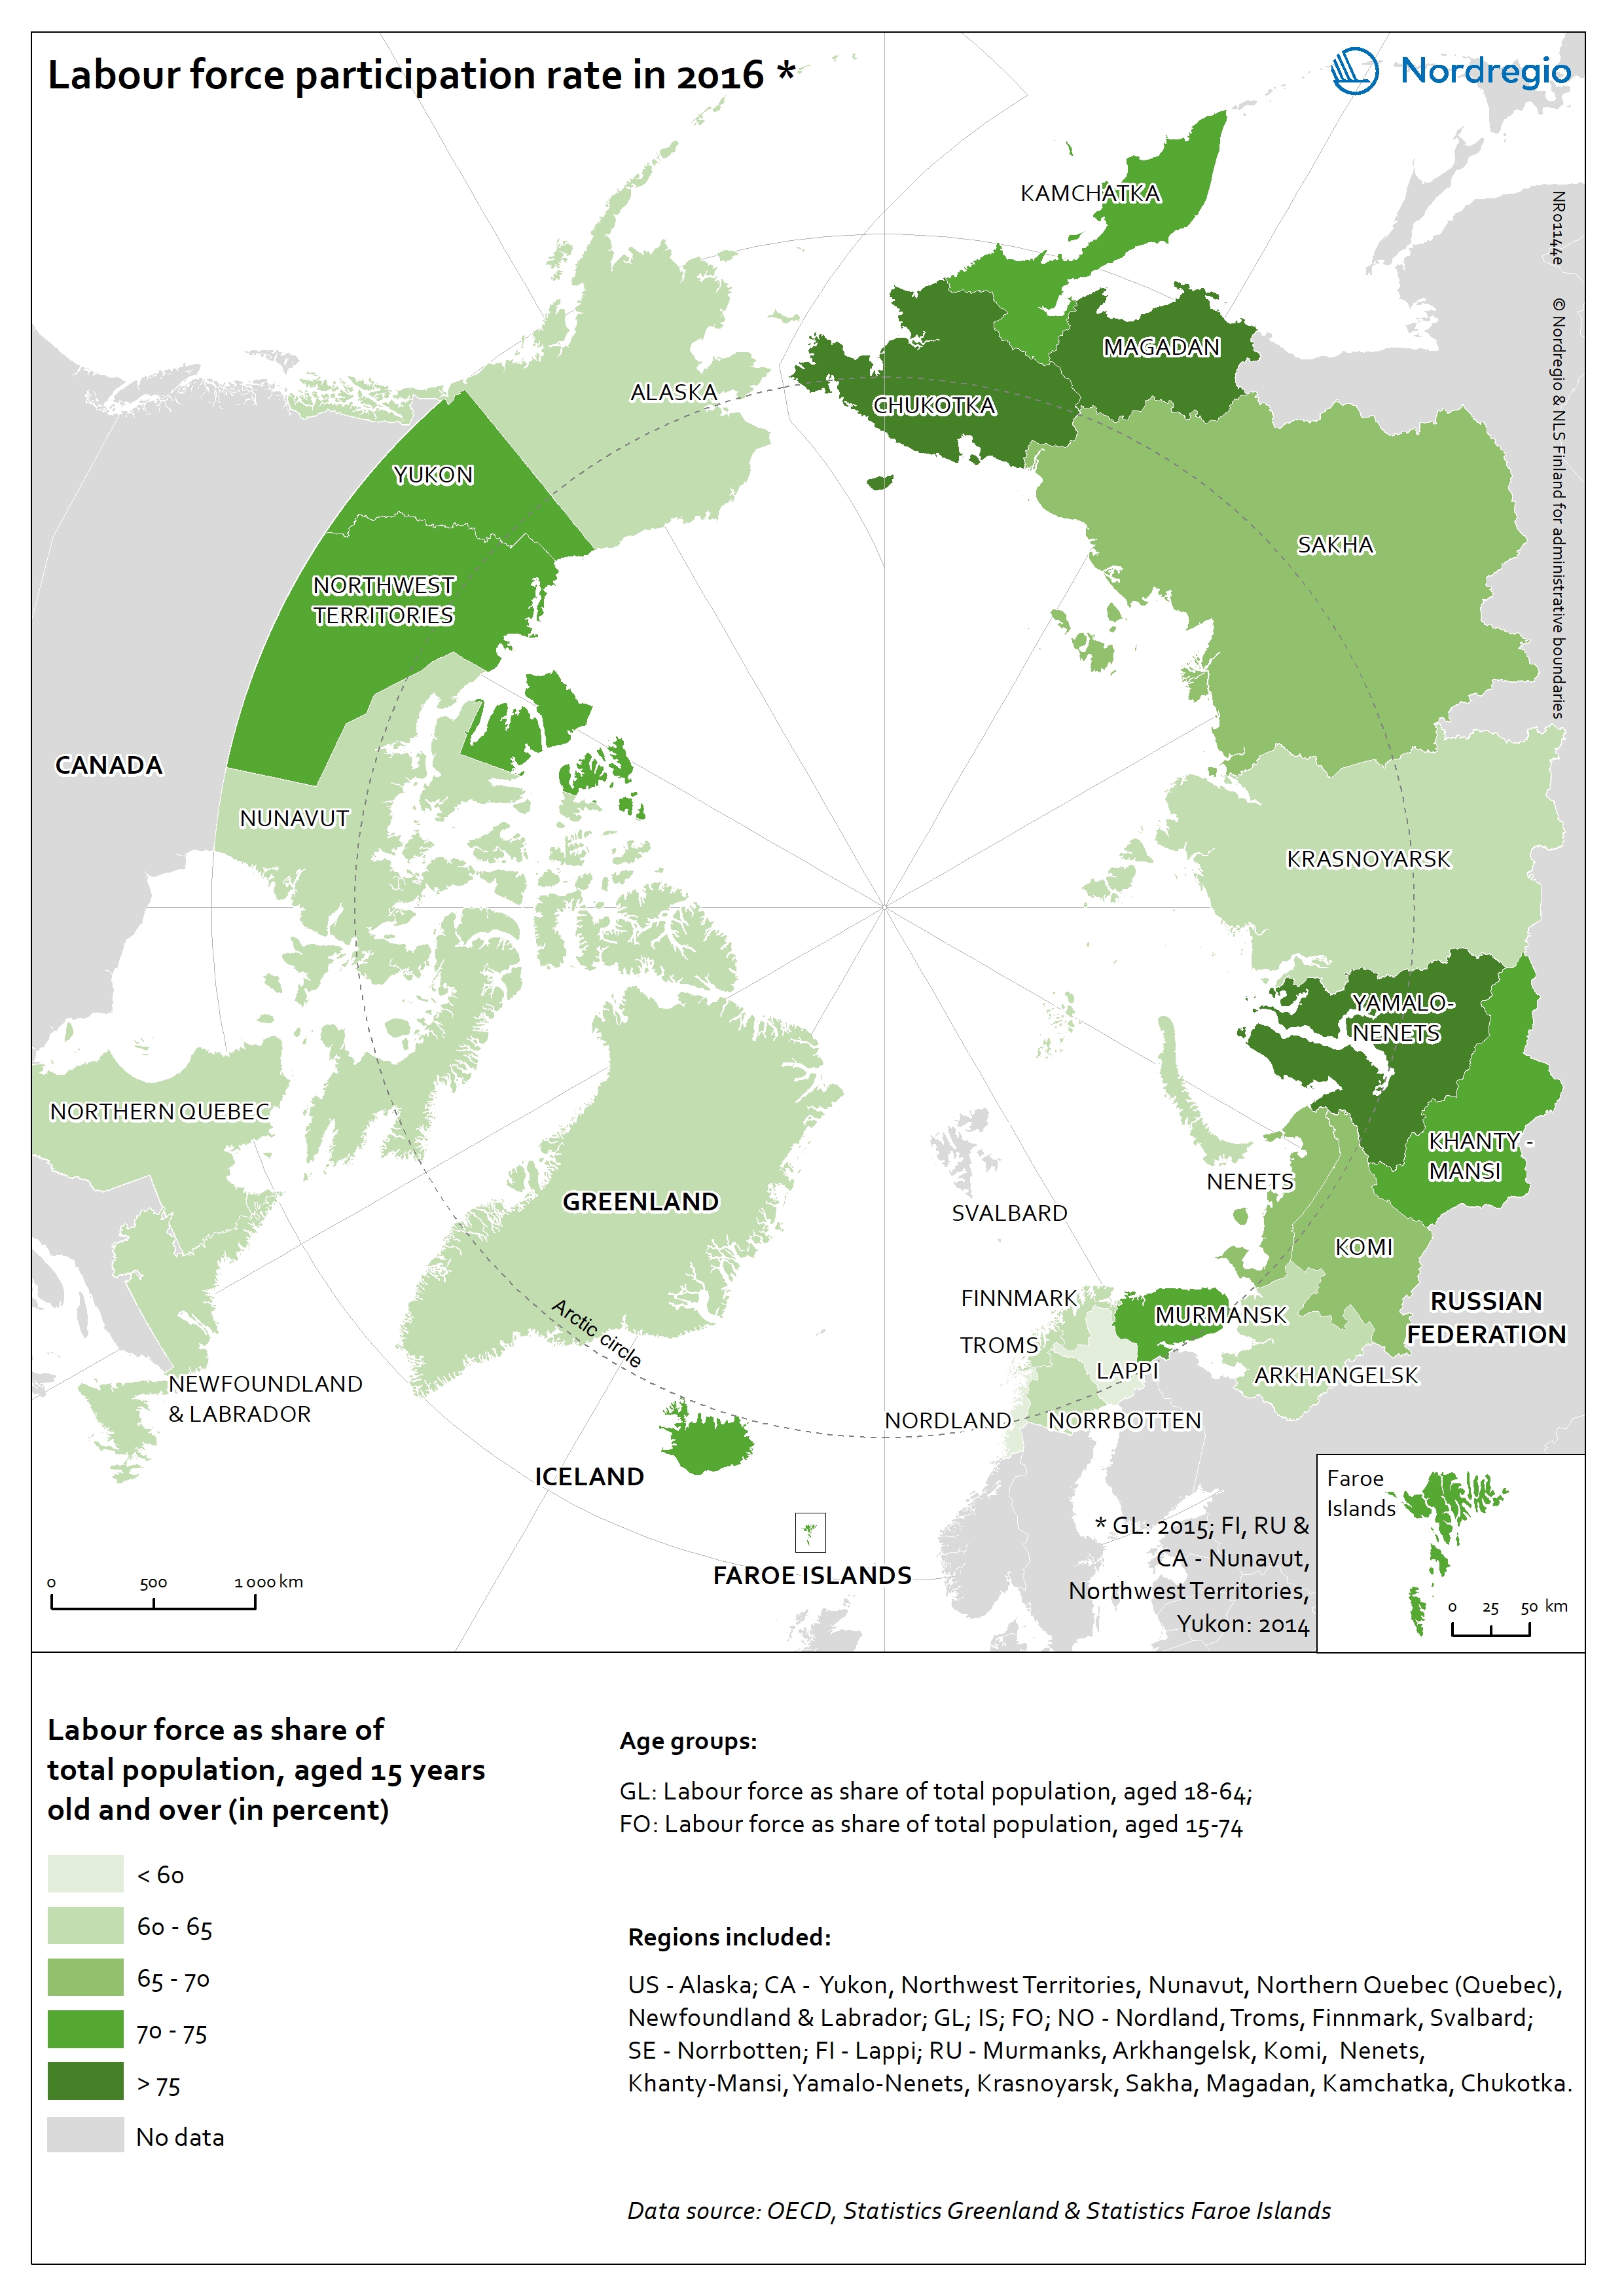
Labour force participation rate in the Arctic
The map shows the regional labour force (active population) as share of total population in the Arctic regions in 2016. The active population includes all persons (aged 15 years old and over) with at least one current paid job or searching for one. The dark green tones show regions with high participation rates and correspondingly light green tones show regions with low participation rates. The Russian Arctic regions of Chukotka (83,6%), Yamalo-Nenets (78,0%), and Magadan (76,1%) had the highest participation rates. The lowest participation rates were in Lappi (Finland, 53,3%) and in Nordland (Norway, 59,9%).
- 2019 March
- Arctic
- Economy
- Labour force
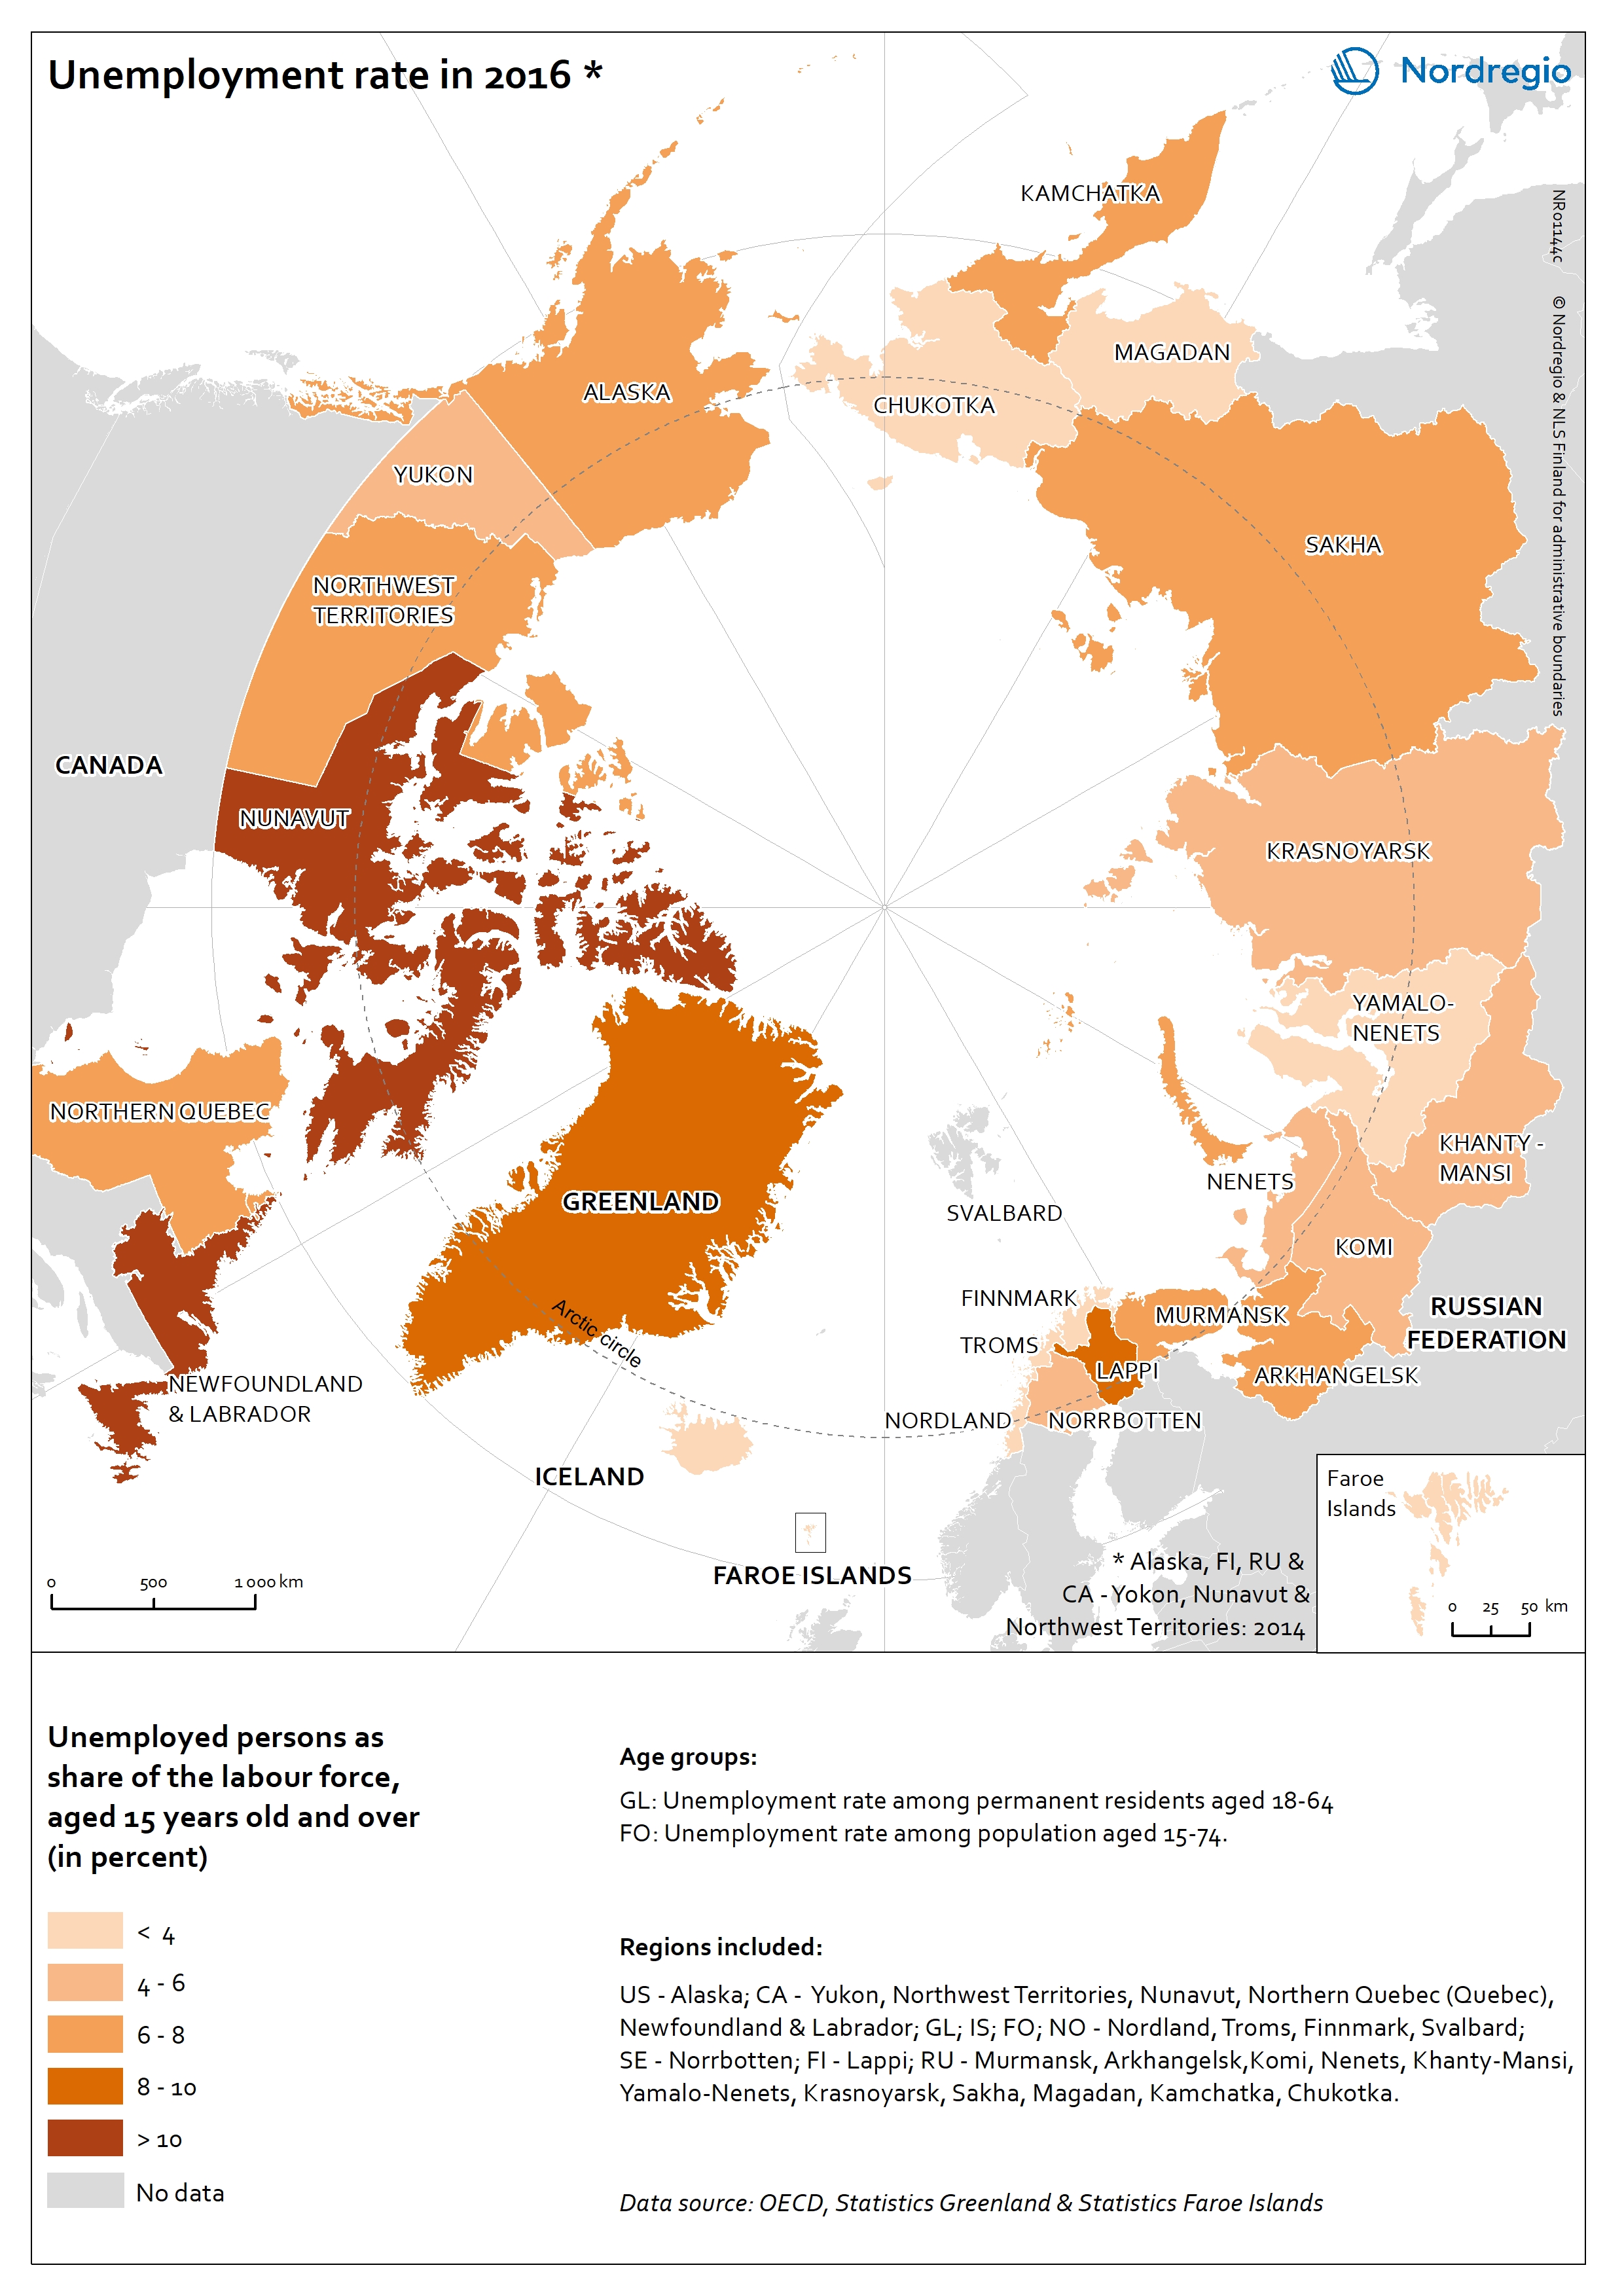
Unemployment rate in the Arctic
The map shows unemployed persons as share of the labour force (aged 15 years old and over) in the Arctic regions in 2016. The dark orange tones show regions with high unemployment rates and correspondingly light orange tones show regions with low unemployment rate. Nunavut and Newfoundland and Labrador (Canada, 14,0% and 13,4%, respectively) had the highest unemployment rates. The unemployment rate was the lowest in Finnmark, Nordland, and Troms (Norway, 2,6%, 3,3%, and 3,3%, respectively), in the Faroe Islands (3,3%), in Iceland (3,0%), as well as in three Russian Arctic regions: Magadan (3,1%), Yamalo-Nenets (3,1%), and Chukotka (3,2%). The unemployment rate in the Arctic regions mostly follows the national averages.
- 2019 March
- Arctic
- Economy
- Labour force
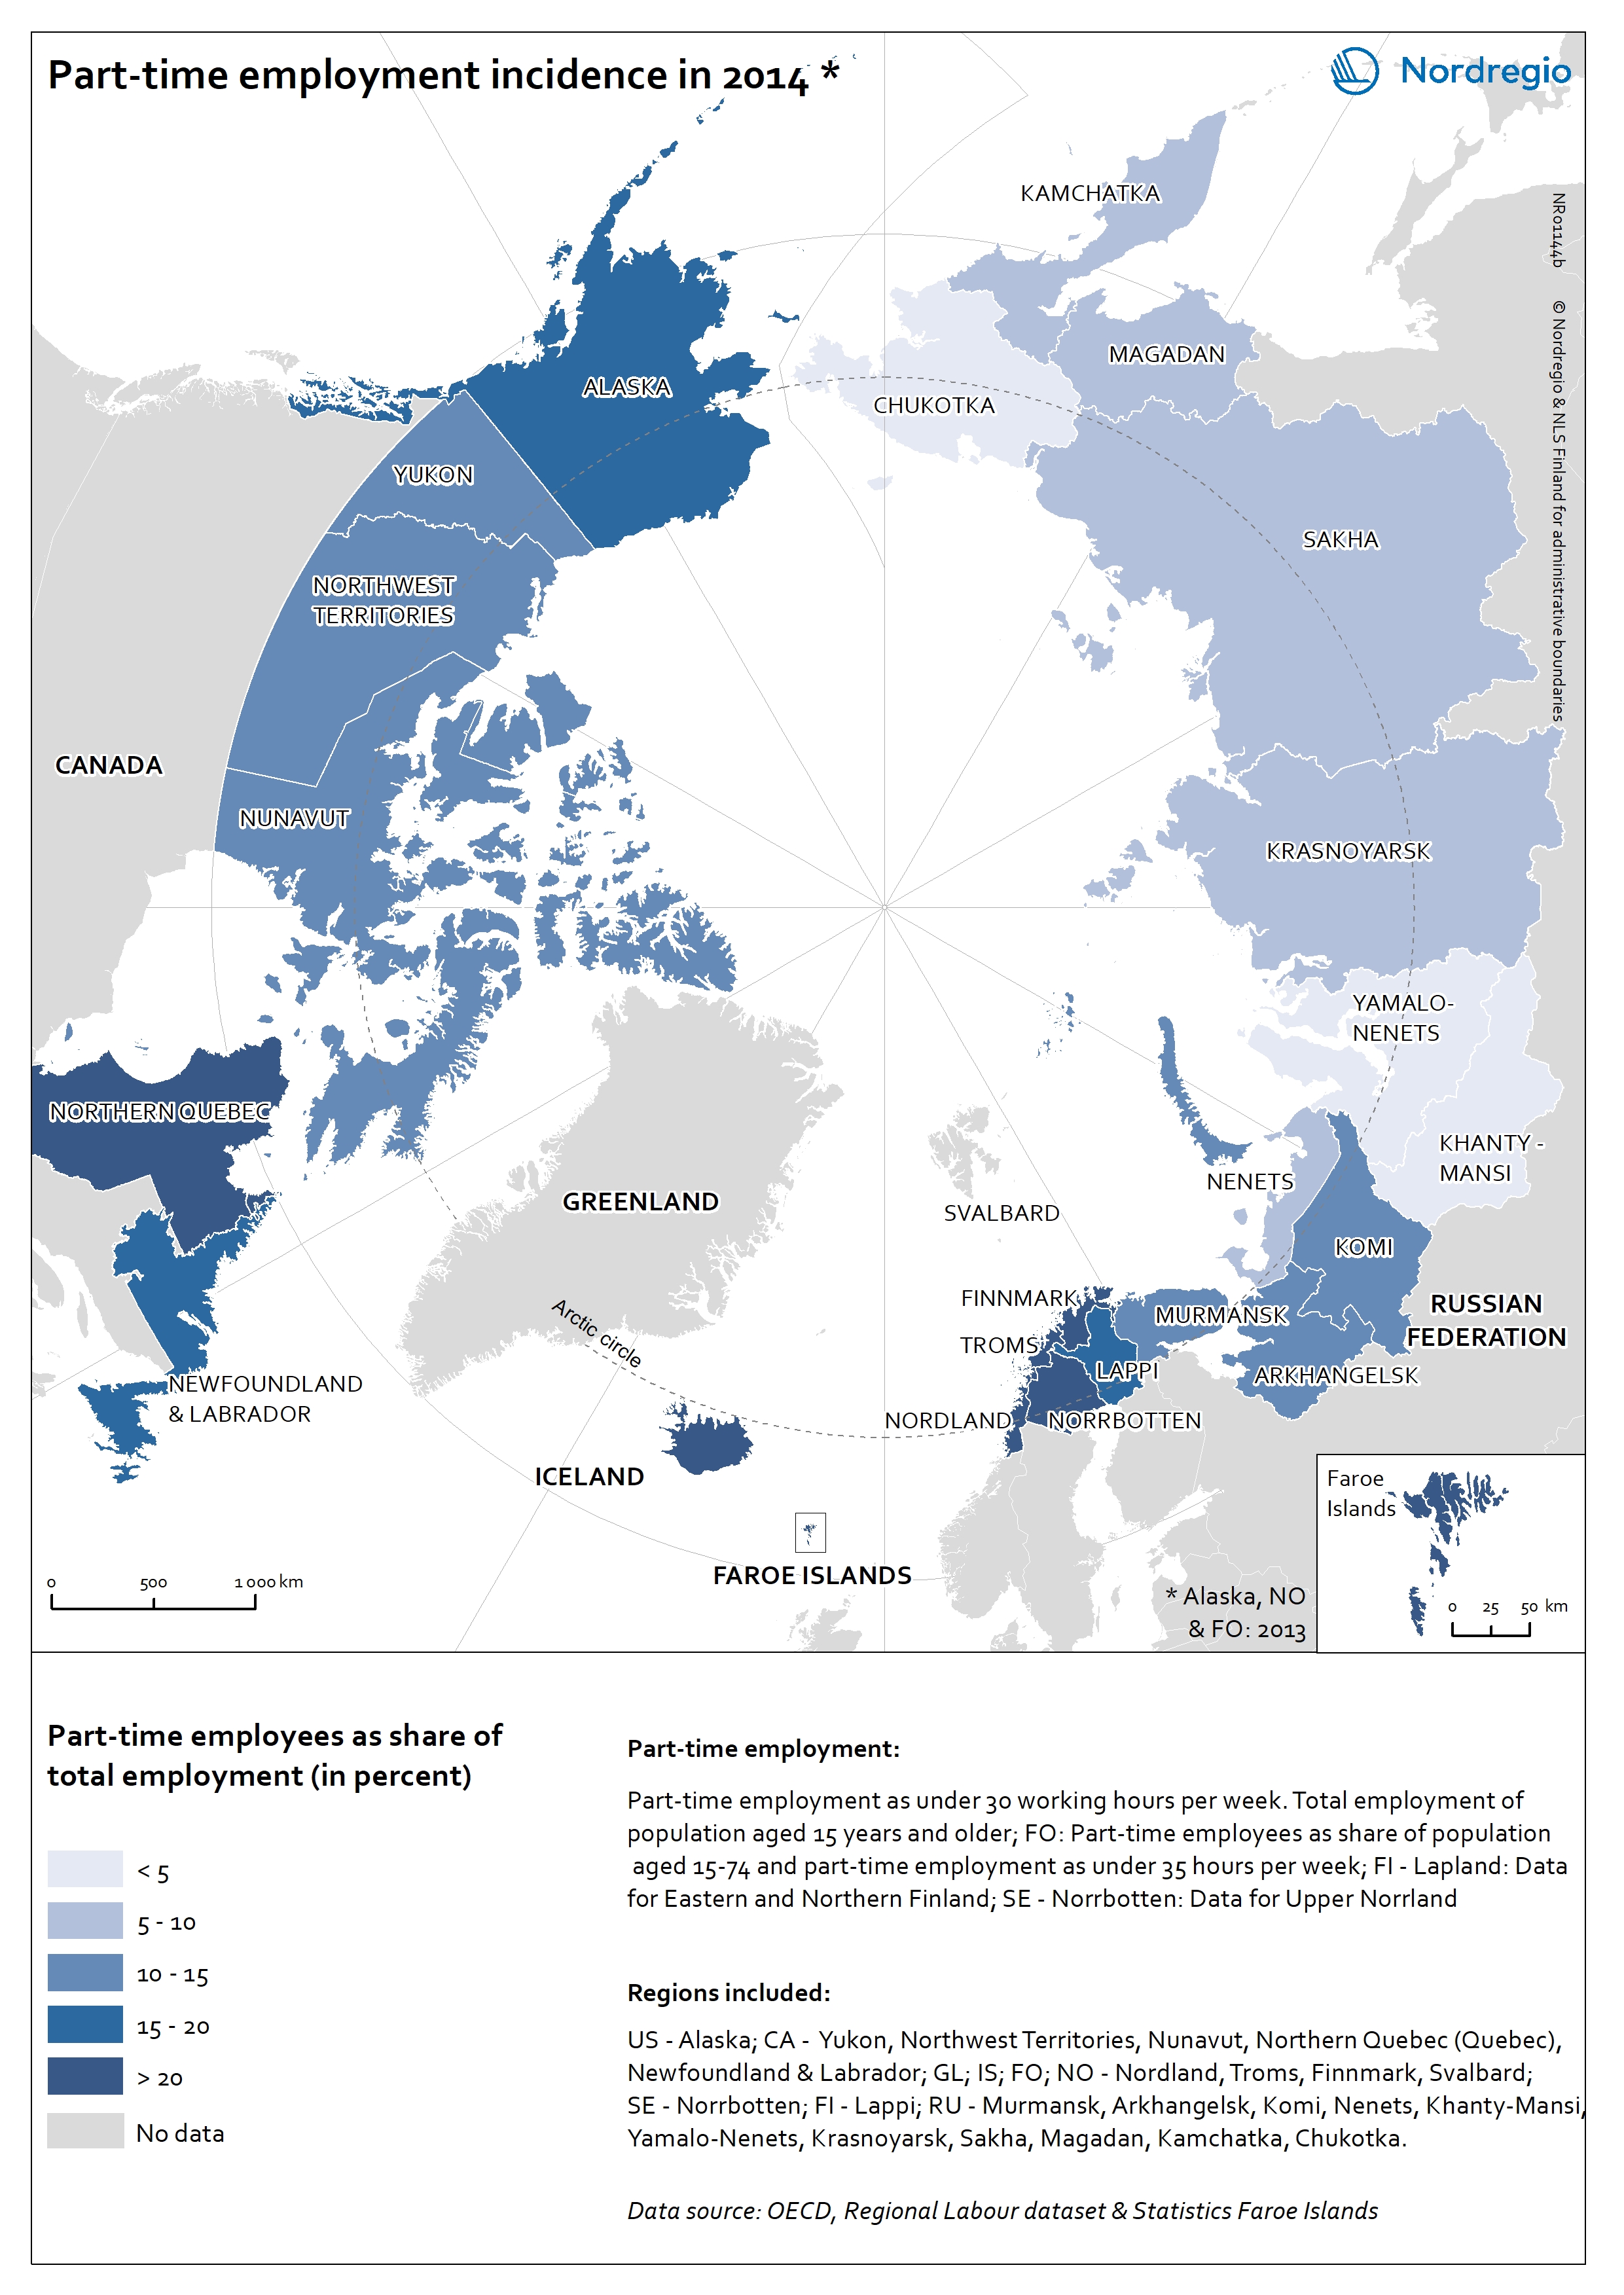
Part-time employment incidence in the Arctic
The map shows the share of the part-time employees over total employment in the Arctic regions in 2014. Part-time workers are considered as persons (aged 15 years old and over) who are working less than 30 hours per week. The dark blue tones show regions with high part-time employment incidence and correspondingly light blue tones show regions with low part-time employment incidence. The three Arctic regions of Norway had the highest part-time employment incidence: Nordland (59,5%), Troms (56,3%), and Finnmark (56,0%). The Russian Arctic regions of Yamalo-Nenets (0,9%), Khanty-Mansi (2,5%), and Chukotka (3,4%) had the lowest part-time employment incidence.
- 2019 March
- Arctic
- Economy
- Labour force
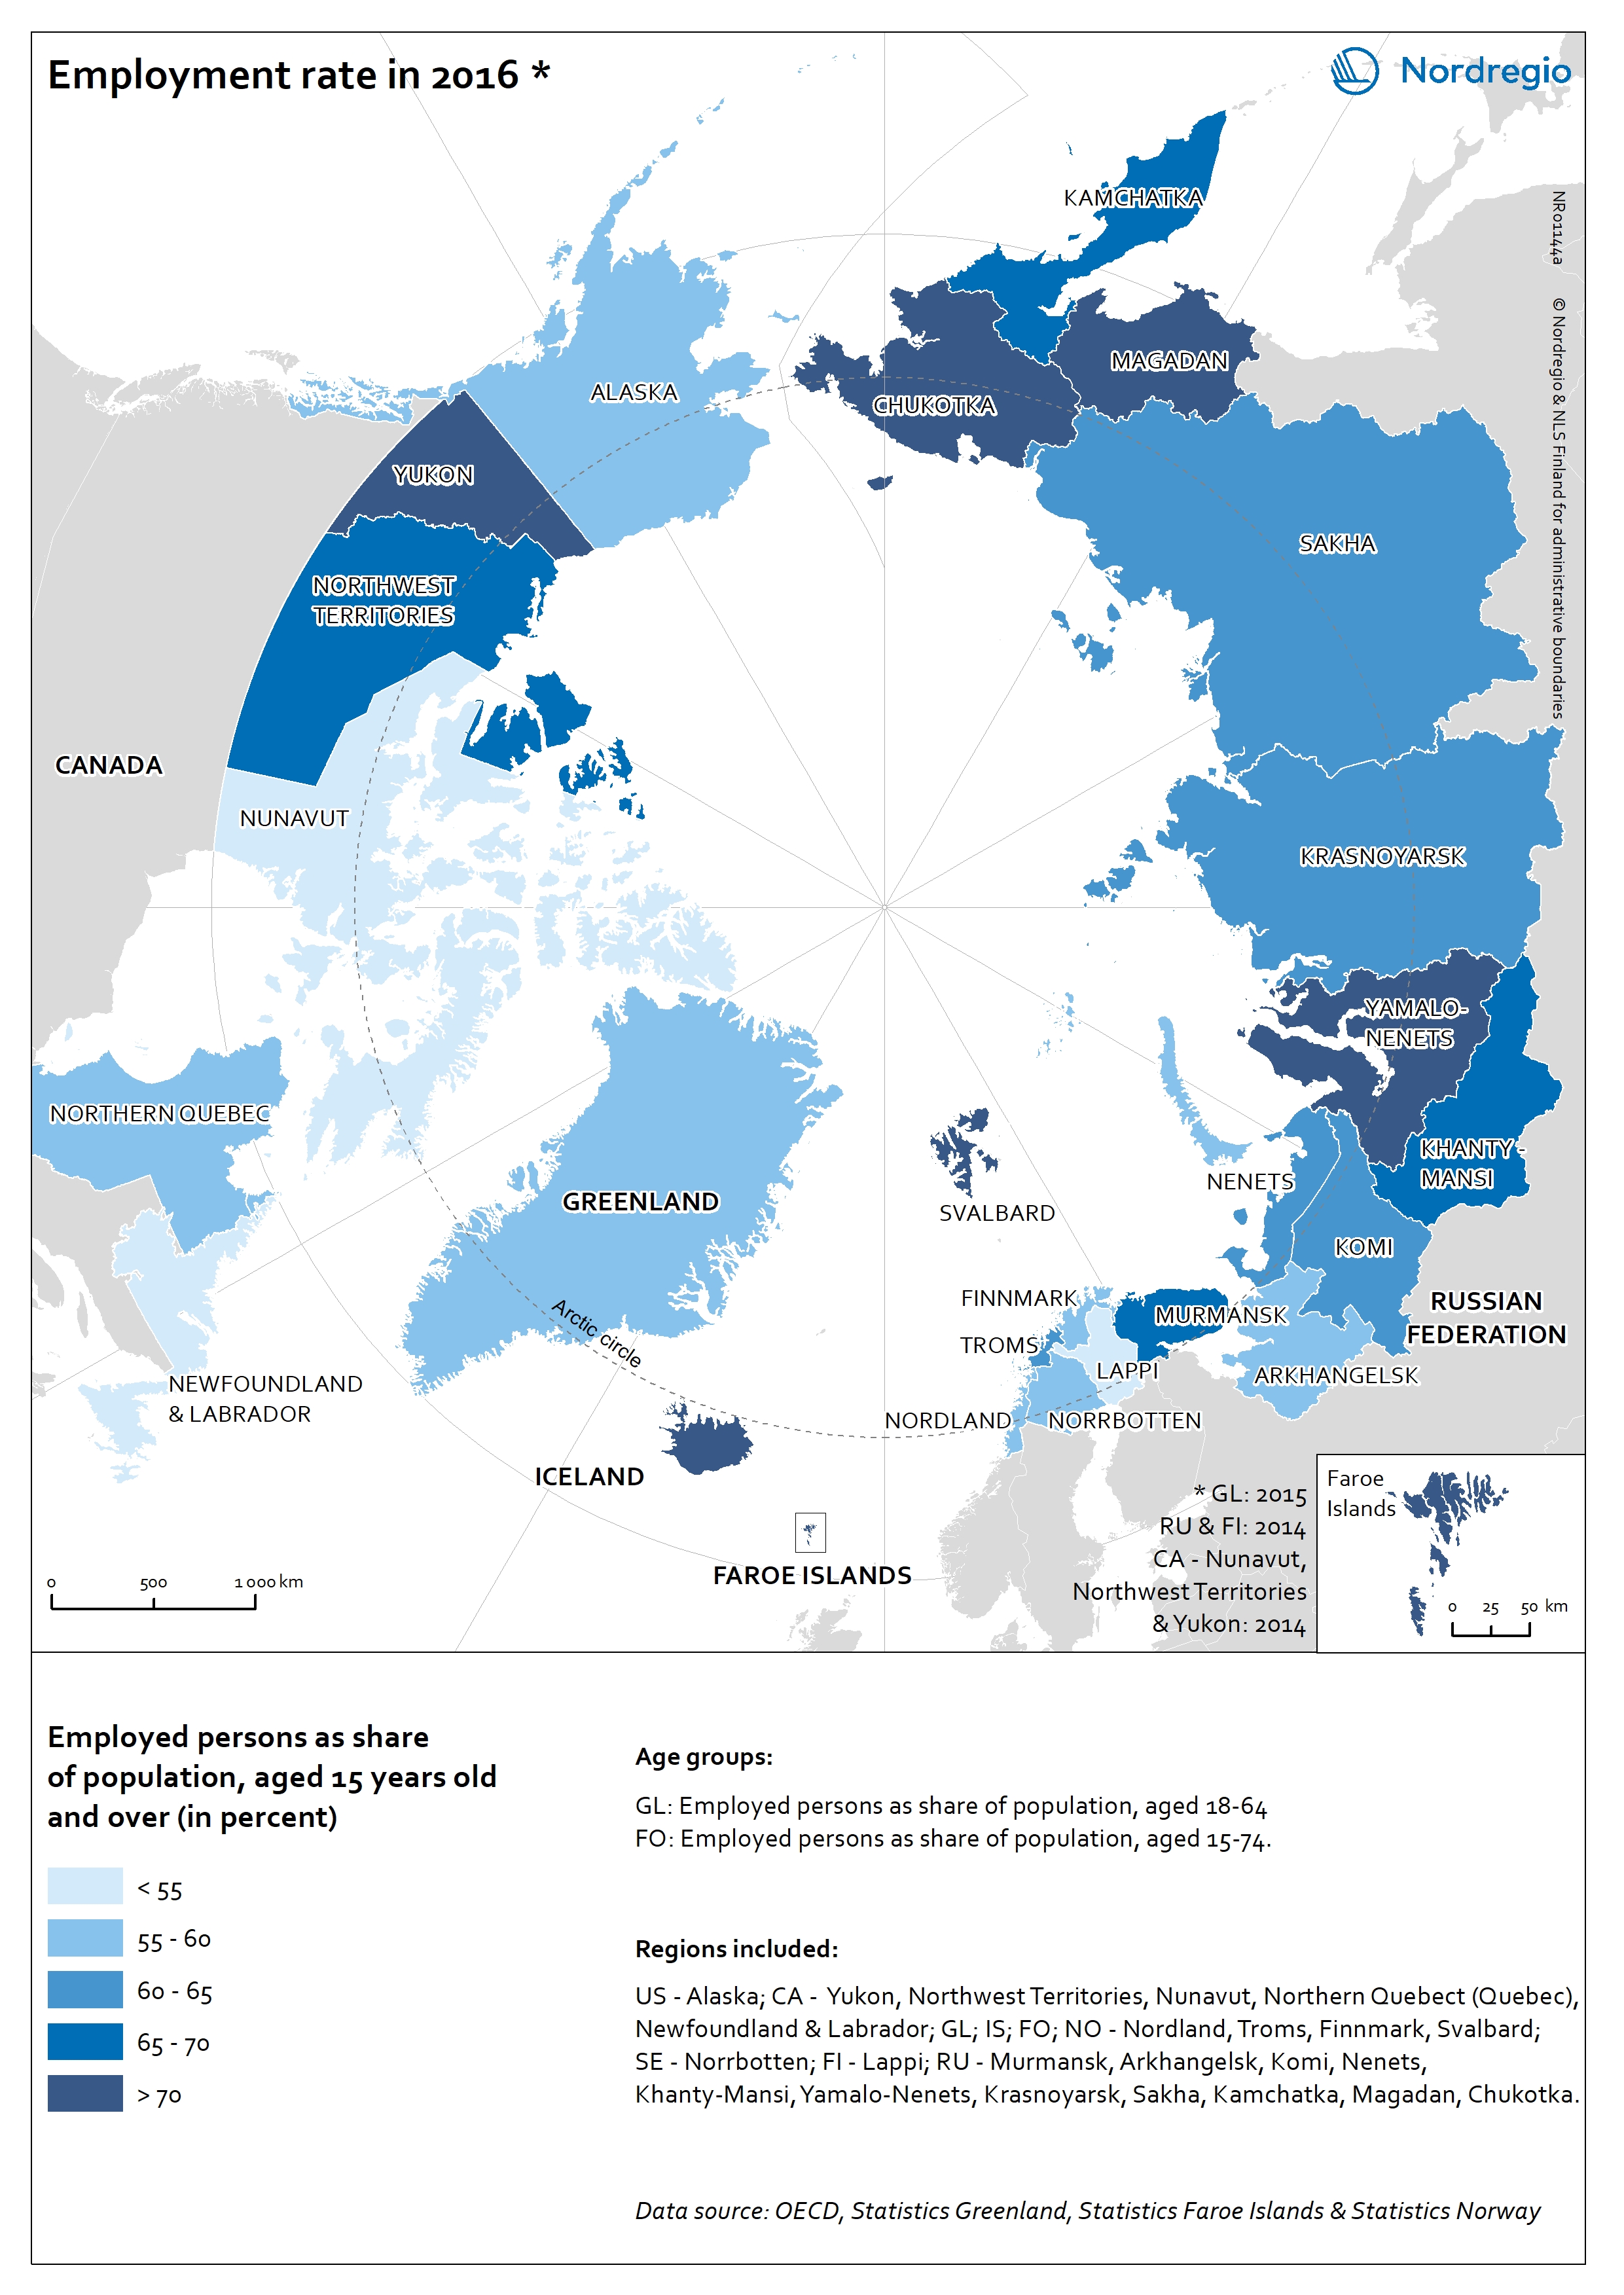
Employment rate in the Arctic
The map shows the employment rate for the Arctic regions in 2016 based on OECD data. The employment rate is the ratio between the employed population and the working age population (aged 15 years old and over). Employed persons are aged 15 or over who report that they have worked in gainful employment for at least one hour in the previous week or who had a job but were absent from work during the reference week. The dark blue tones show regions with high employment rates and correspondingly light blue tones show regions with low employment rate. The highest employment rates in the Arctic regions were in the Faroe Islands, Svalbard, the Yukon (Canada), Chukotka, Yamalo-Nenets, and Magadan Oblast (Russian Federation). The lowest employment rates were in Finnish Lapland (48,1%), Newfoundland & Labrador, and Nunavut (Canada, 52,4% and 53,0%, respectively). The employment rate in the Nordic Arctic regions was lower than the average of their respective countries whereas in Alaska (USA) and the Russian Arctic the employment rate was higher than average of their respective countries.
- 2019 March
- Arctic
- Economy
- Labour force
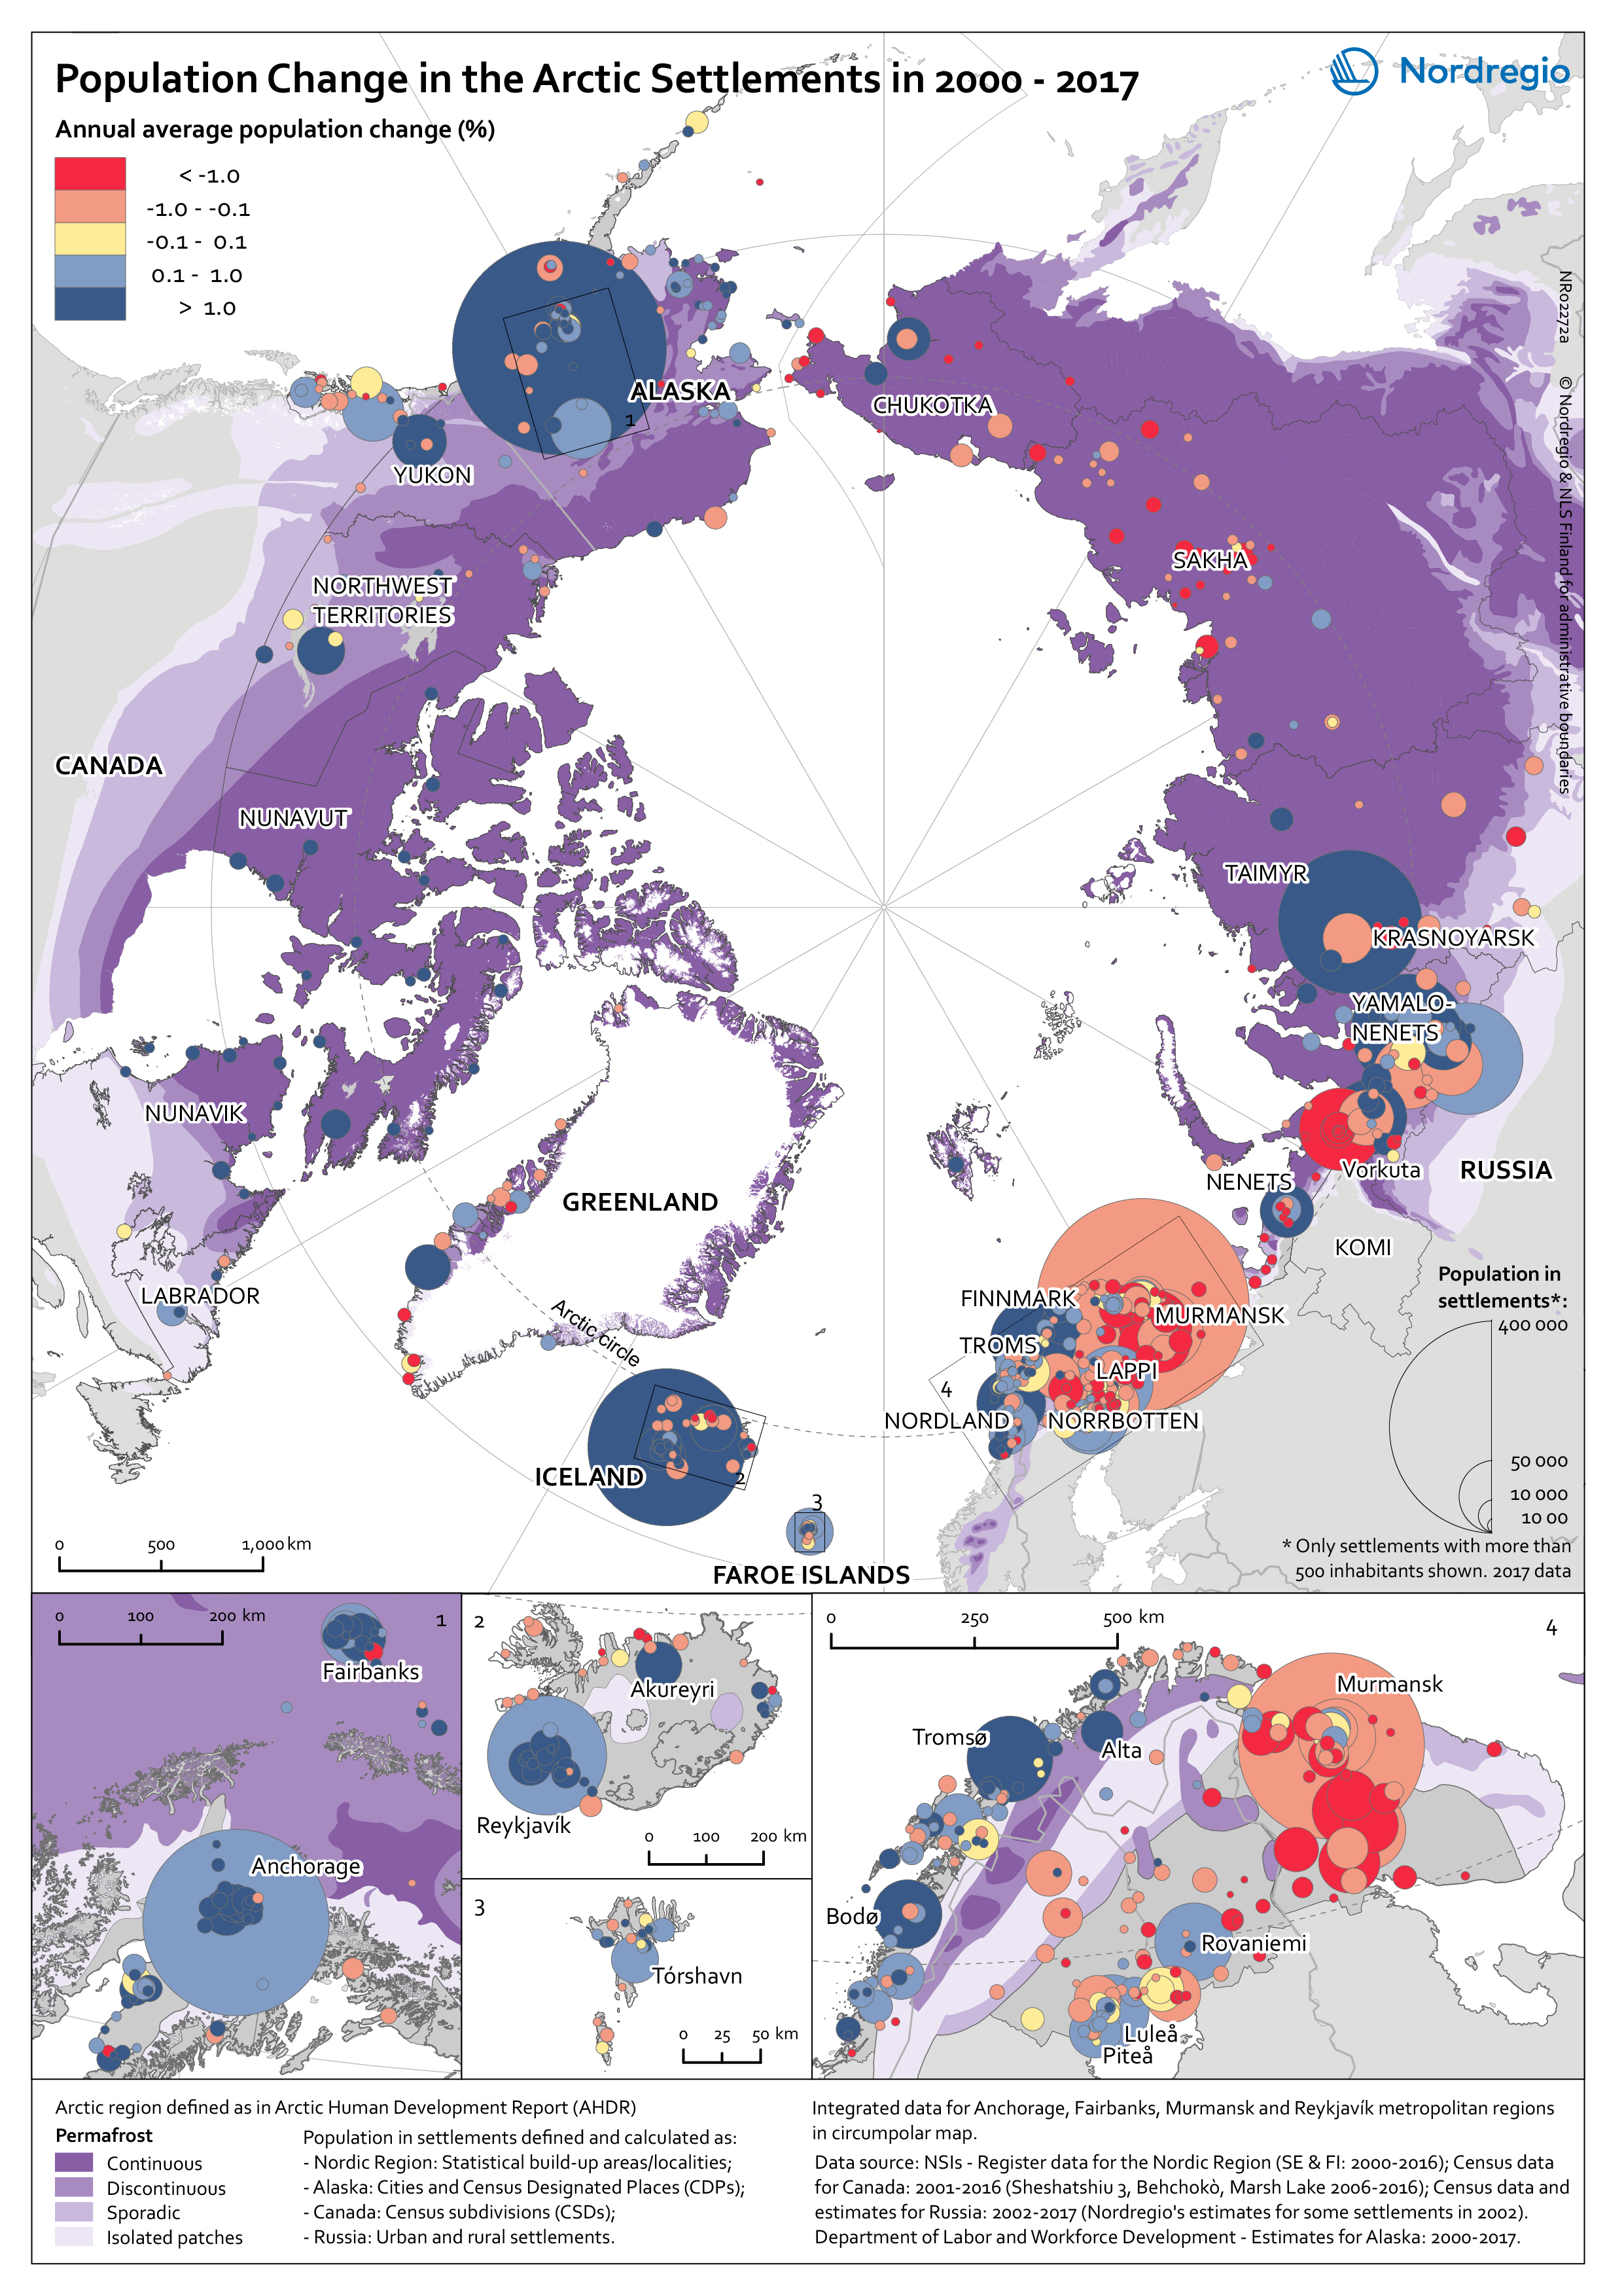
Population change in Arctic settlements
The map provides an overview of the population change in Arctic settlements with 500 inhabitants or more during the period 2000 to 2017. The purple underlaying layer shows the extent of permafrost across the Arctic. The circles indicate settlements with 500 inhabitants or more and are proportional to the total population in 2017. Blue tones indicate population growth between 2000 and 2017, while red tones indicate population decline. Four zoomed-in maps show areas with high settlement density – Arctic Fennoscandia, Iceland, the Faroe Islands, and Alaska. In Alaska, population increased in the largest settlements between 2000 and 2017. The population decline in small settlements located far from the two large cities – Anchorage and Fairbanks – has been caused by outmigration, which has cancelled out the positive natural population growth. In the Canadian Arctic, most people live in a few settlements. Similar to Alaska, the population increased in the largest settlements and decreased in small settlements. Most of the smaller settlements in Arctic Fennoscandia have witnessed a population decline between 2000 and 2017, except in Norway. The dominant pattern in Fennoscandia is a population growth in larger settlements and a population decline in surrounding smaller settlements. This is similar to the pattern observed in the other Nordic Arctic countries – Iceland, Greenland, and the Faroe Islands. New inhabitants settled in the capitals (Reykjavik, Nuuk, and Torshavn) and regional centres, from both domestic and international locations, while settlements in sparsely populated areas are becoming less attractive to incomers. In the Russian Arctic, the regions can be divided into the oil and gas areas of the Khanty-Mansi and Yamal-Nenets, and other areas. The population is growing in the oil and gas areas and declining slowly in the others. Over 75% of the settlements have been shrinking throughout the 21st century, mainly because…
- 2019 March
- Arctic
- Demography
- Migration
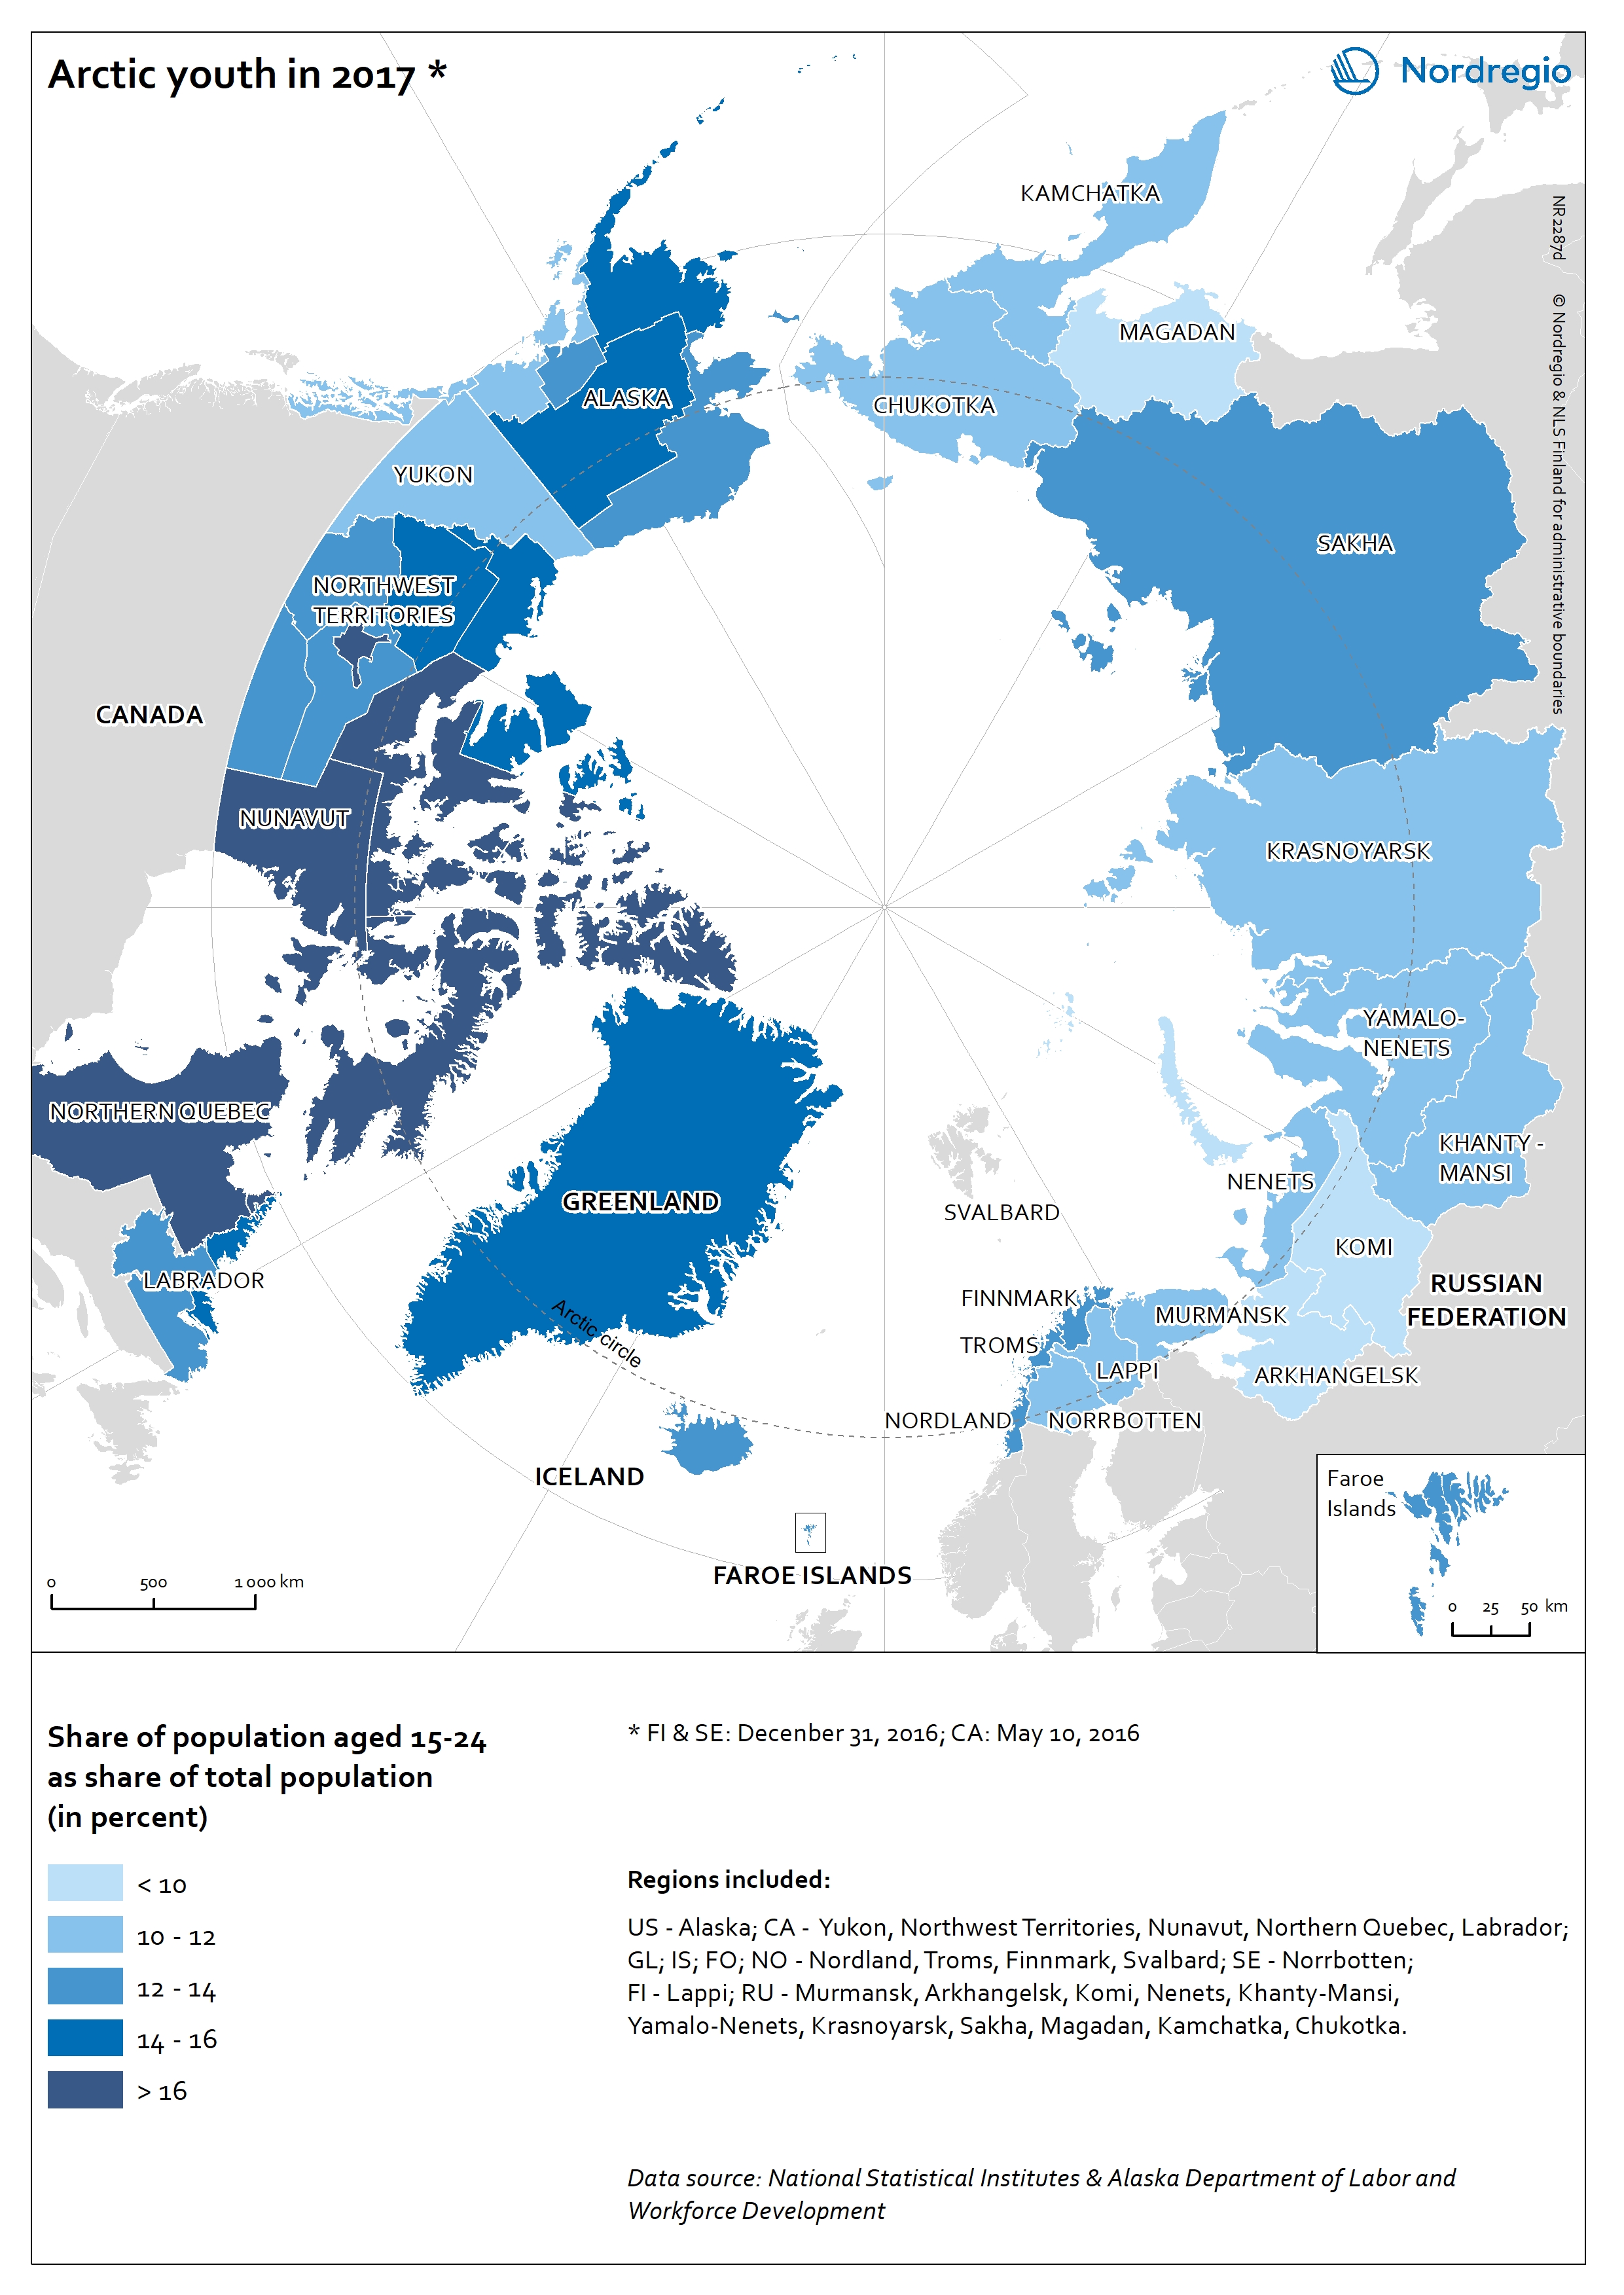
Share of youth population in the Arctic
The map shows the population aged 15-24 as share of the total population in 2017 at the regional level in the Arctic. Age 15 to 24 is a standard international definition of youth used by the OECD and United Nations. Dark blue tones indicate regions with high share of youth in the total population, and light blue tones indicate regions with low share of youth. Keewatin in Nunavut region (Canada) had the highest share of youth (18,8%). Region 3 in the Northwest Territories, Northern Quebec, as well as the other two regions in Nunavut (Canada) had a share of youth above 15%. Magadan (9,2%), Arkhangelsk (9,4%) and Komi (9,7%) (Russian Federation) had the lowest shares of youth in their total populations.
- 2019 March
- Arctic
- Demography
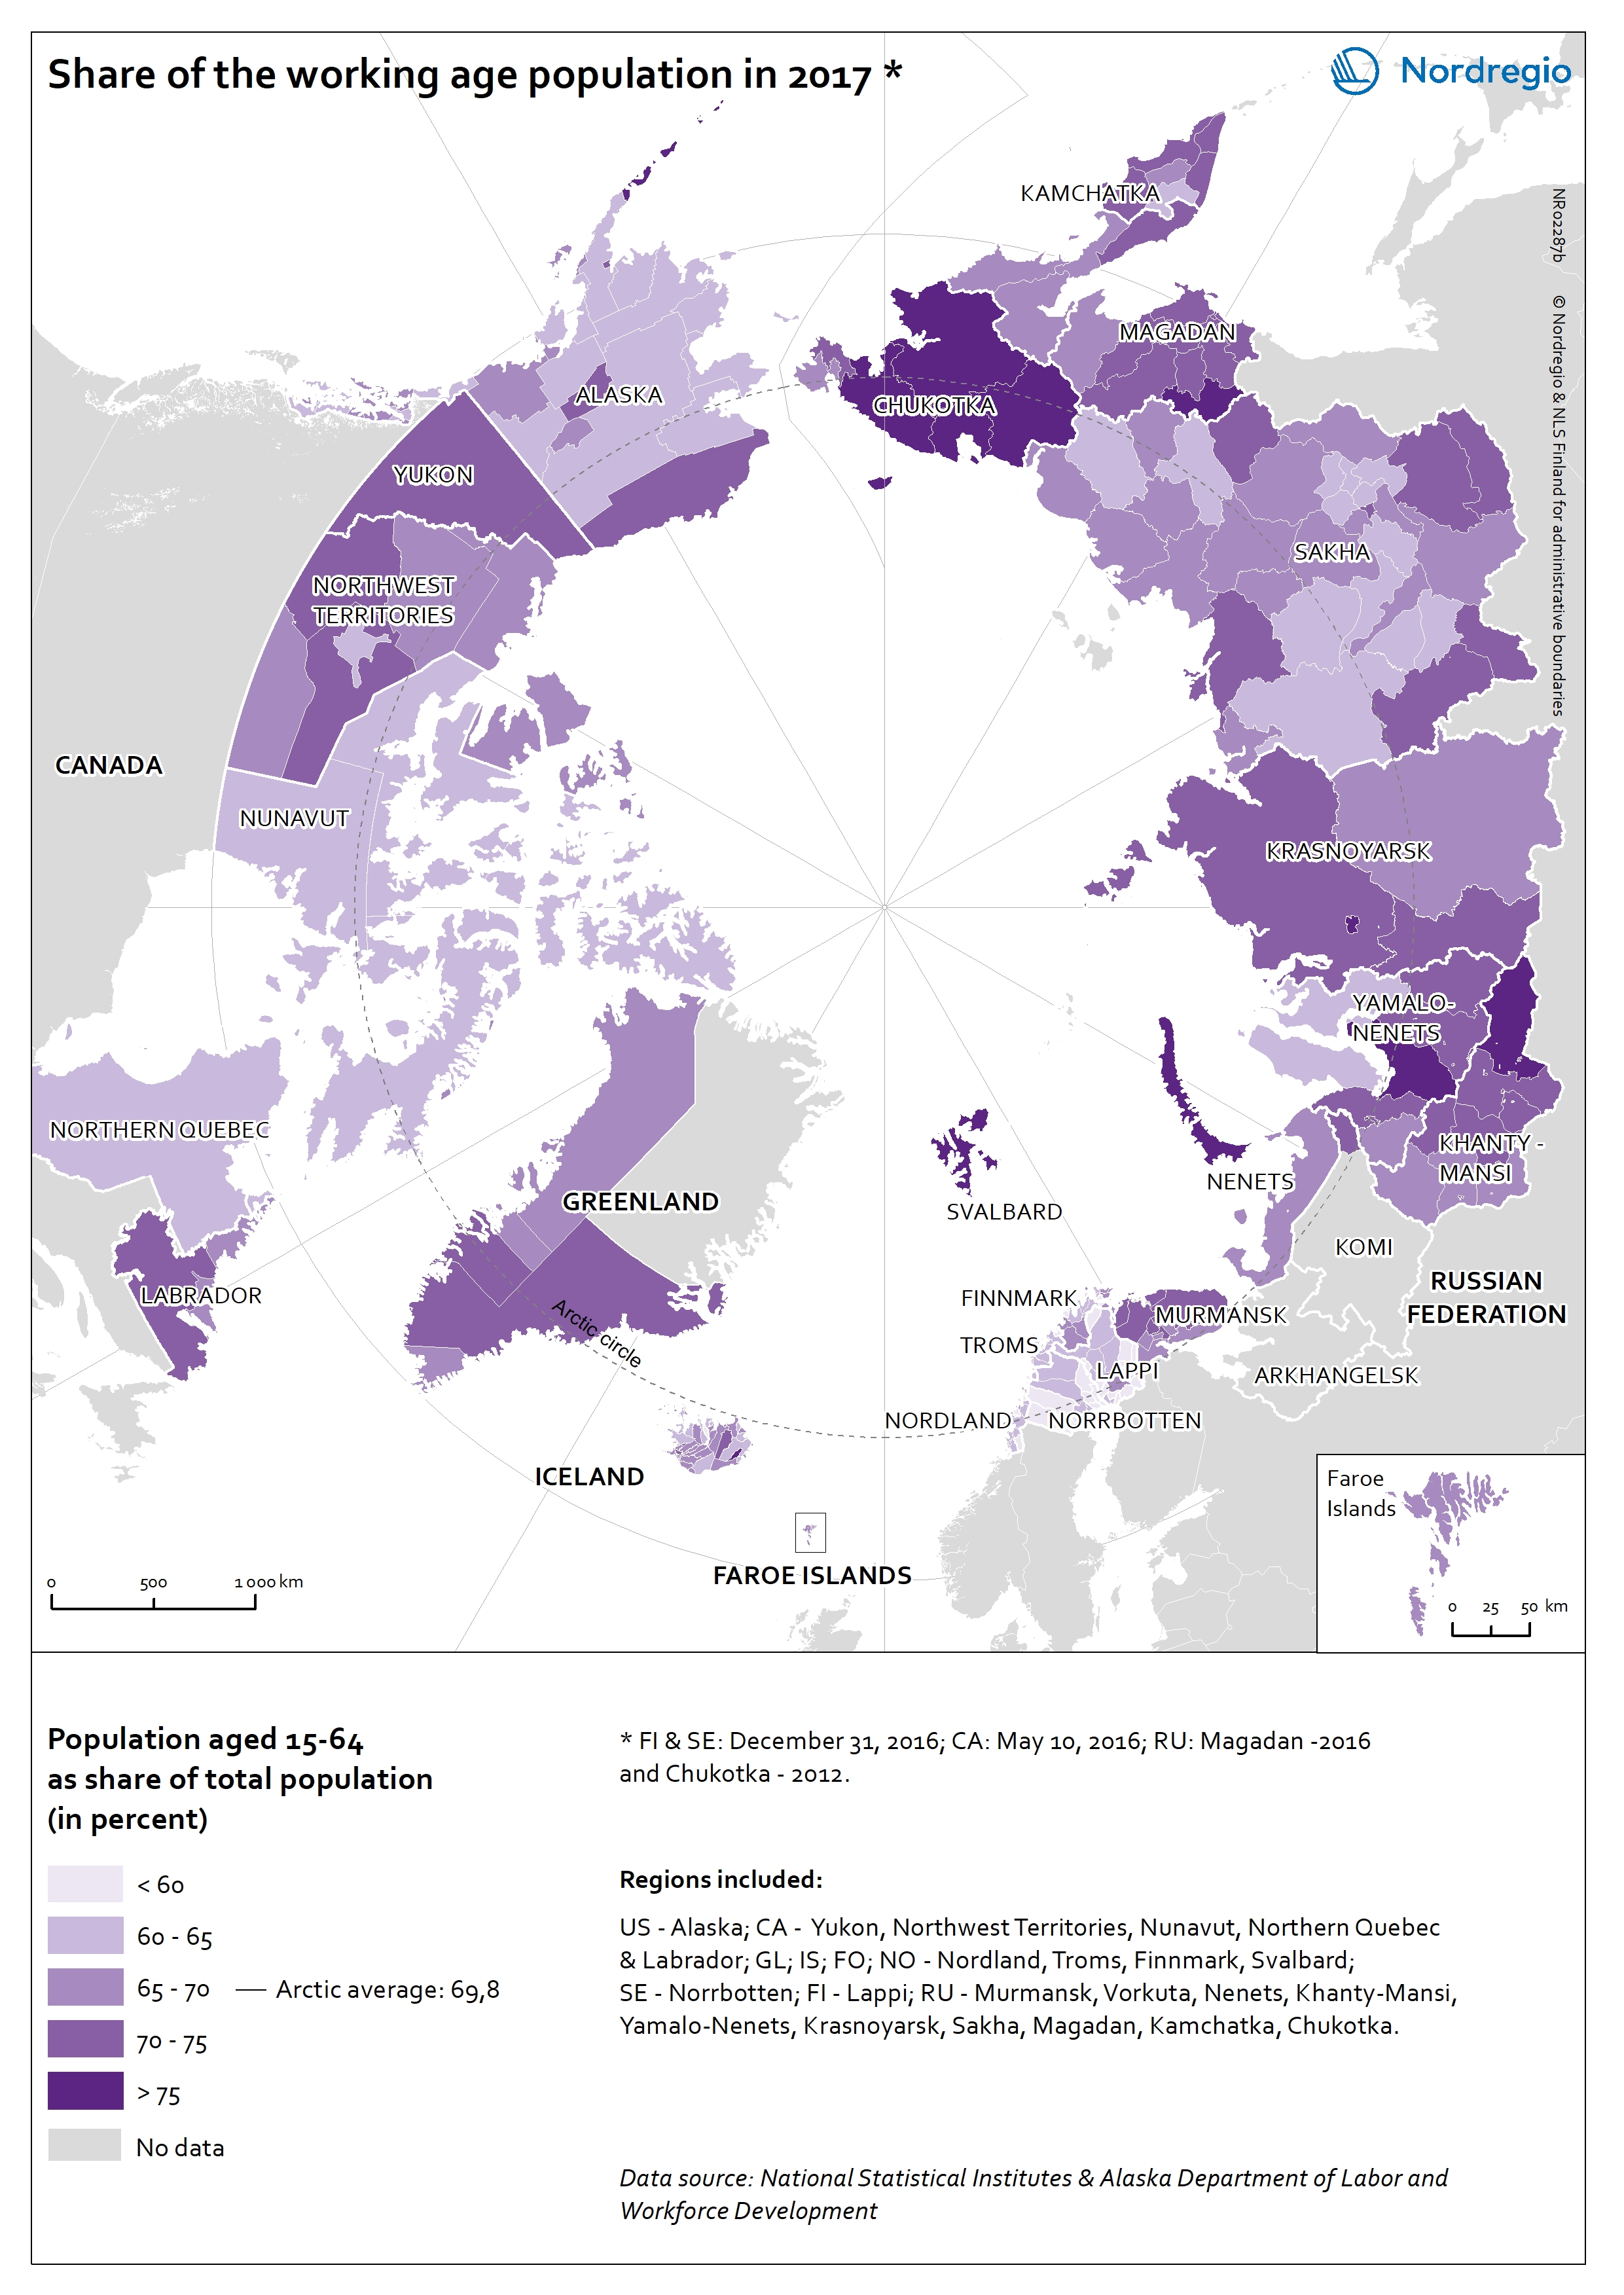
Share of working age population in the Arctic
The map shows the population aged 15-64 as a share of the total population in 2017 at the sub-regional level in the Arctic. Dark purple tones indicate subregions with high share of working age population, and light purple tones indicate subregions with low share of working age population. In the Arctic the share of the working age population was 69,8%. The highest share of working age population was in regions where a large share of employment is related to natural resources extraction such as oil, gas, and minerals. This is especially the case in the Russian Arctic regions. All subregions in the Nordic countries had a share of working age population smaller than 60%. Subregions in the Russian Federation as well as in Svalbard (Norway) and in Aleutian Islands (Alaska) had high shares of working age population.
- 2019 March
- Arctic
- Demography
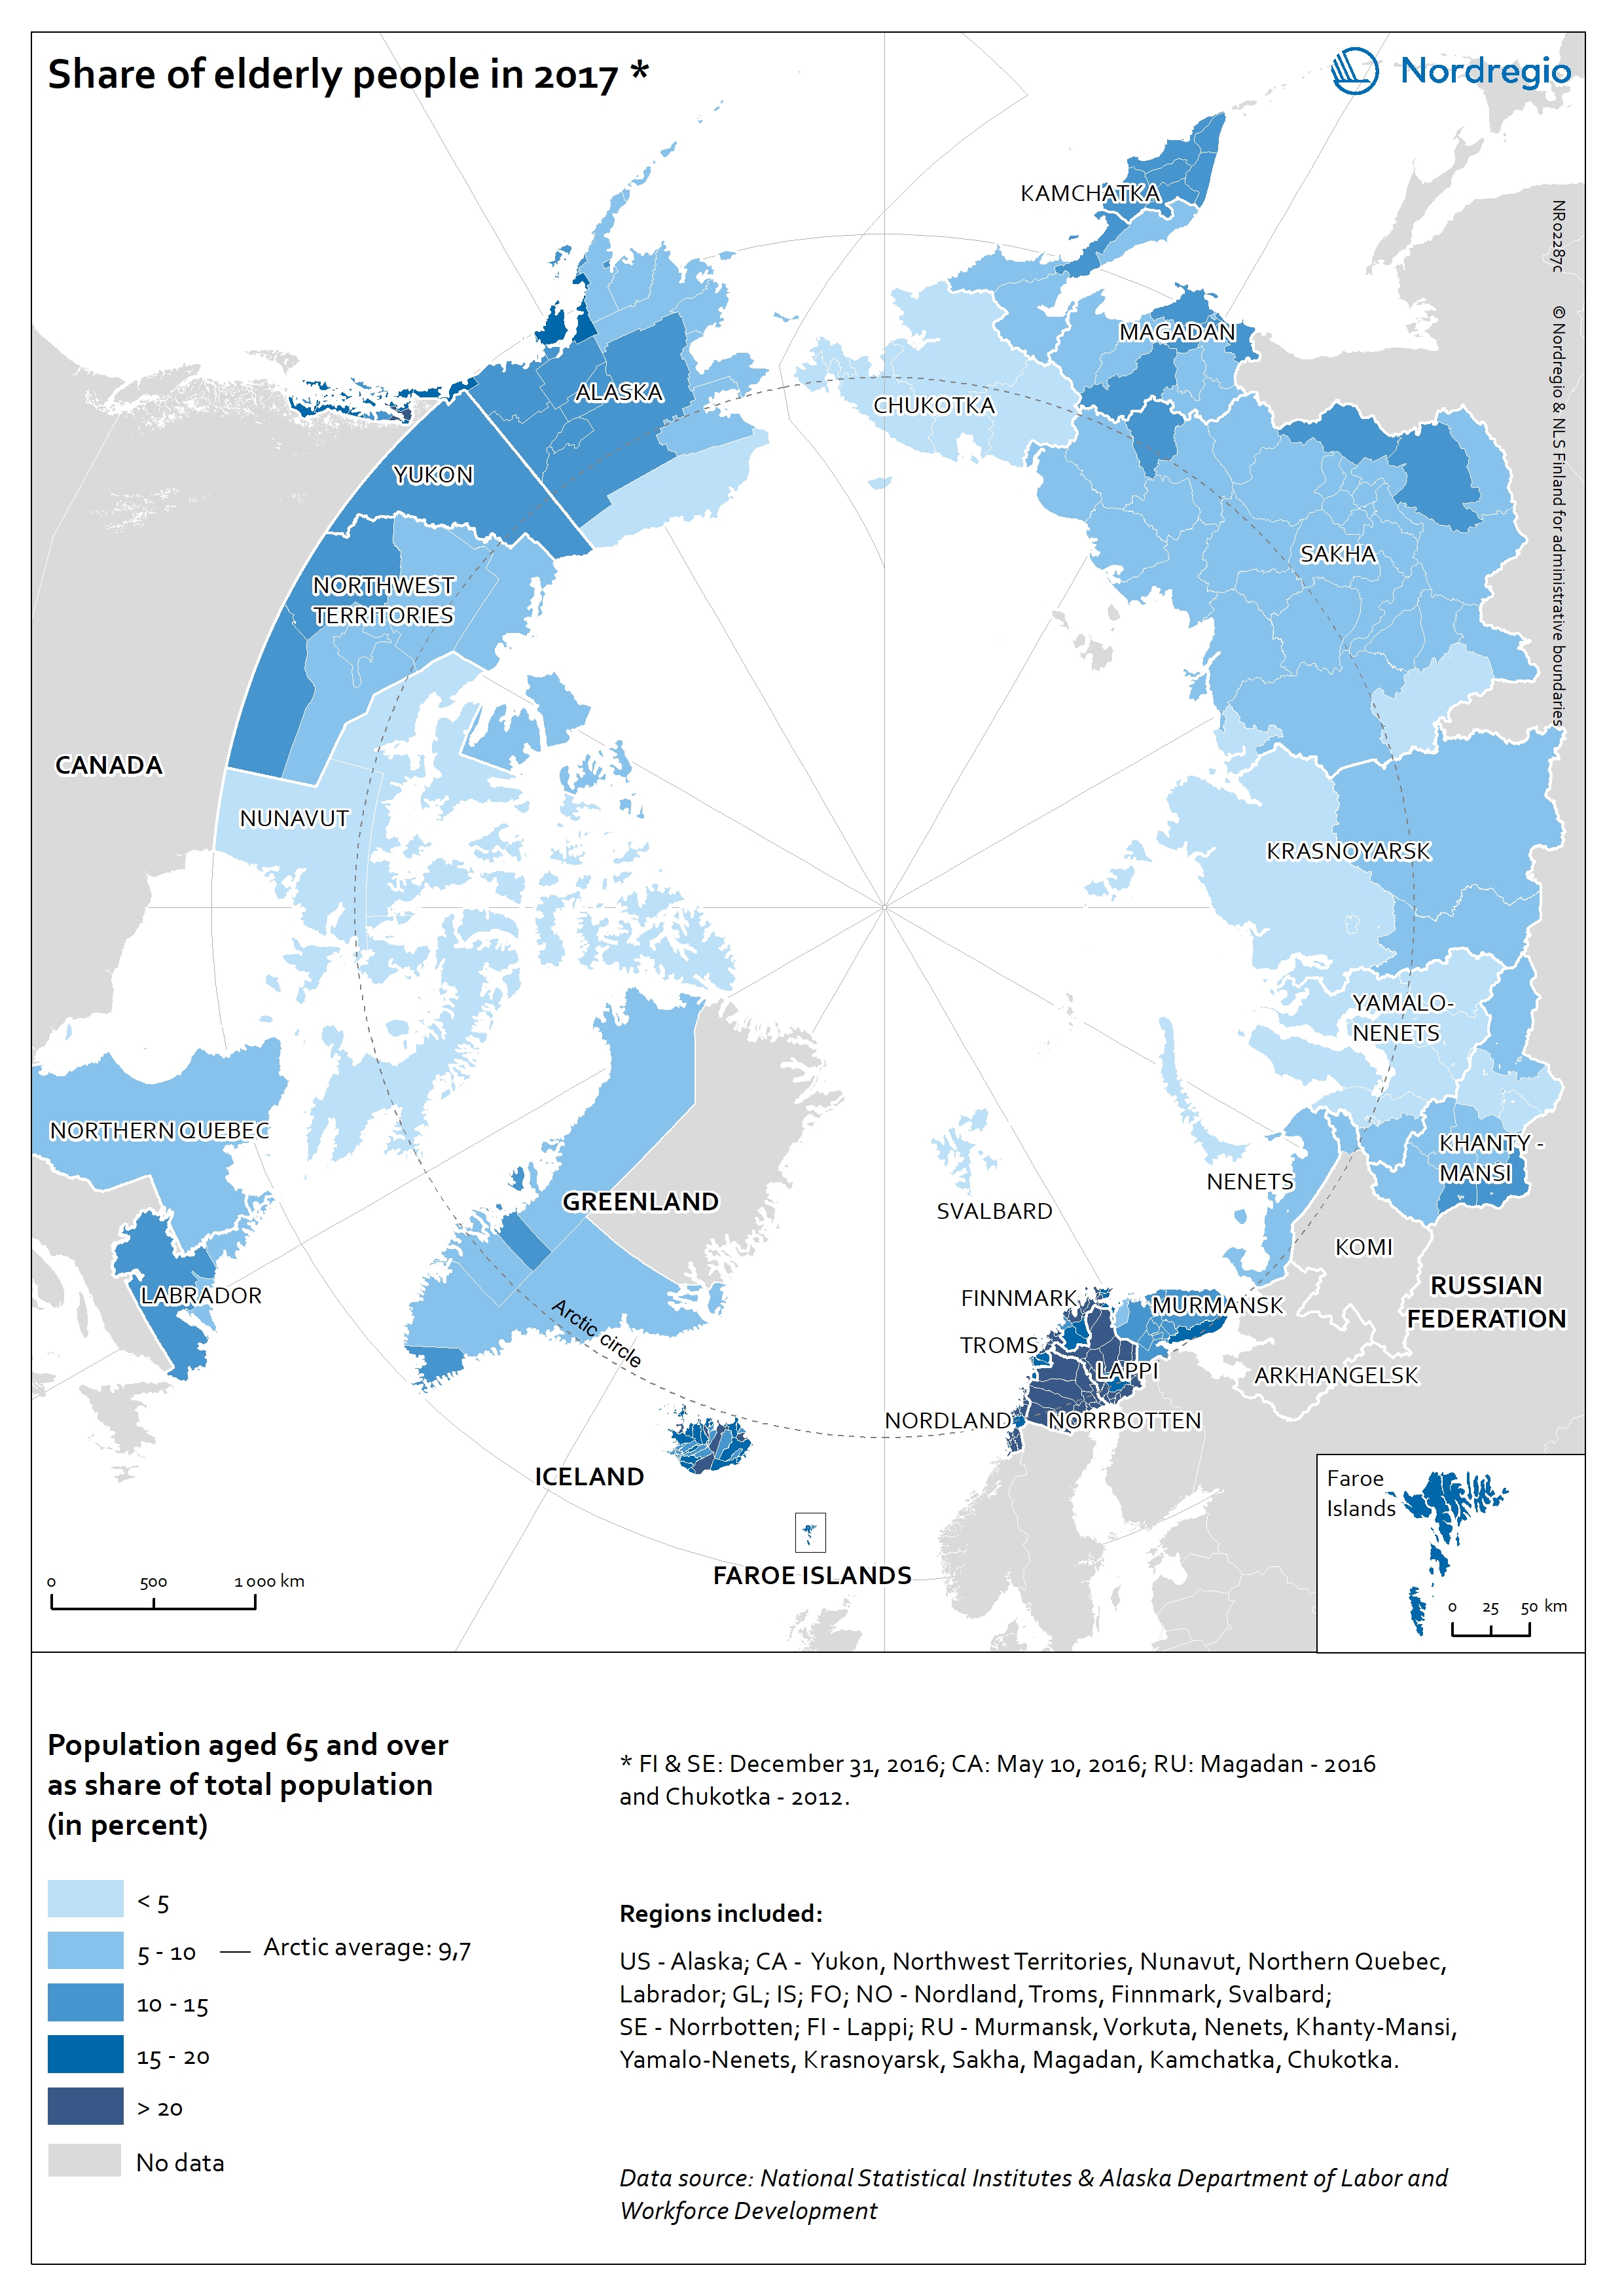
Share of elderly population in the Arctic
The map shows the population aged 65 and over as share of the total population in 2017 at the sub-regional level in the Arctic. Dark blue tones indicate subregions with high share of elderly people, light blue tones show subregions low share of elderly population. The Arctic is generally characterized by a low share of elderly (9,7%), especially in the subregions of Yamalo-Nenets, Krasnoyarsk, and Chukotka (Russian Federation), and Nunavut (Canada). Many of the Nordic subregions had a share of elderly over 20%, as well as in the Haines Borough (Alaska).
- 2019 March
- Arctic
- Demography
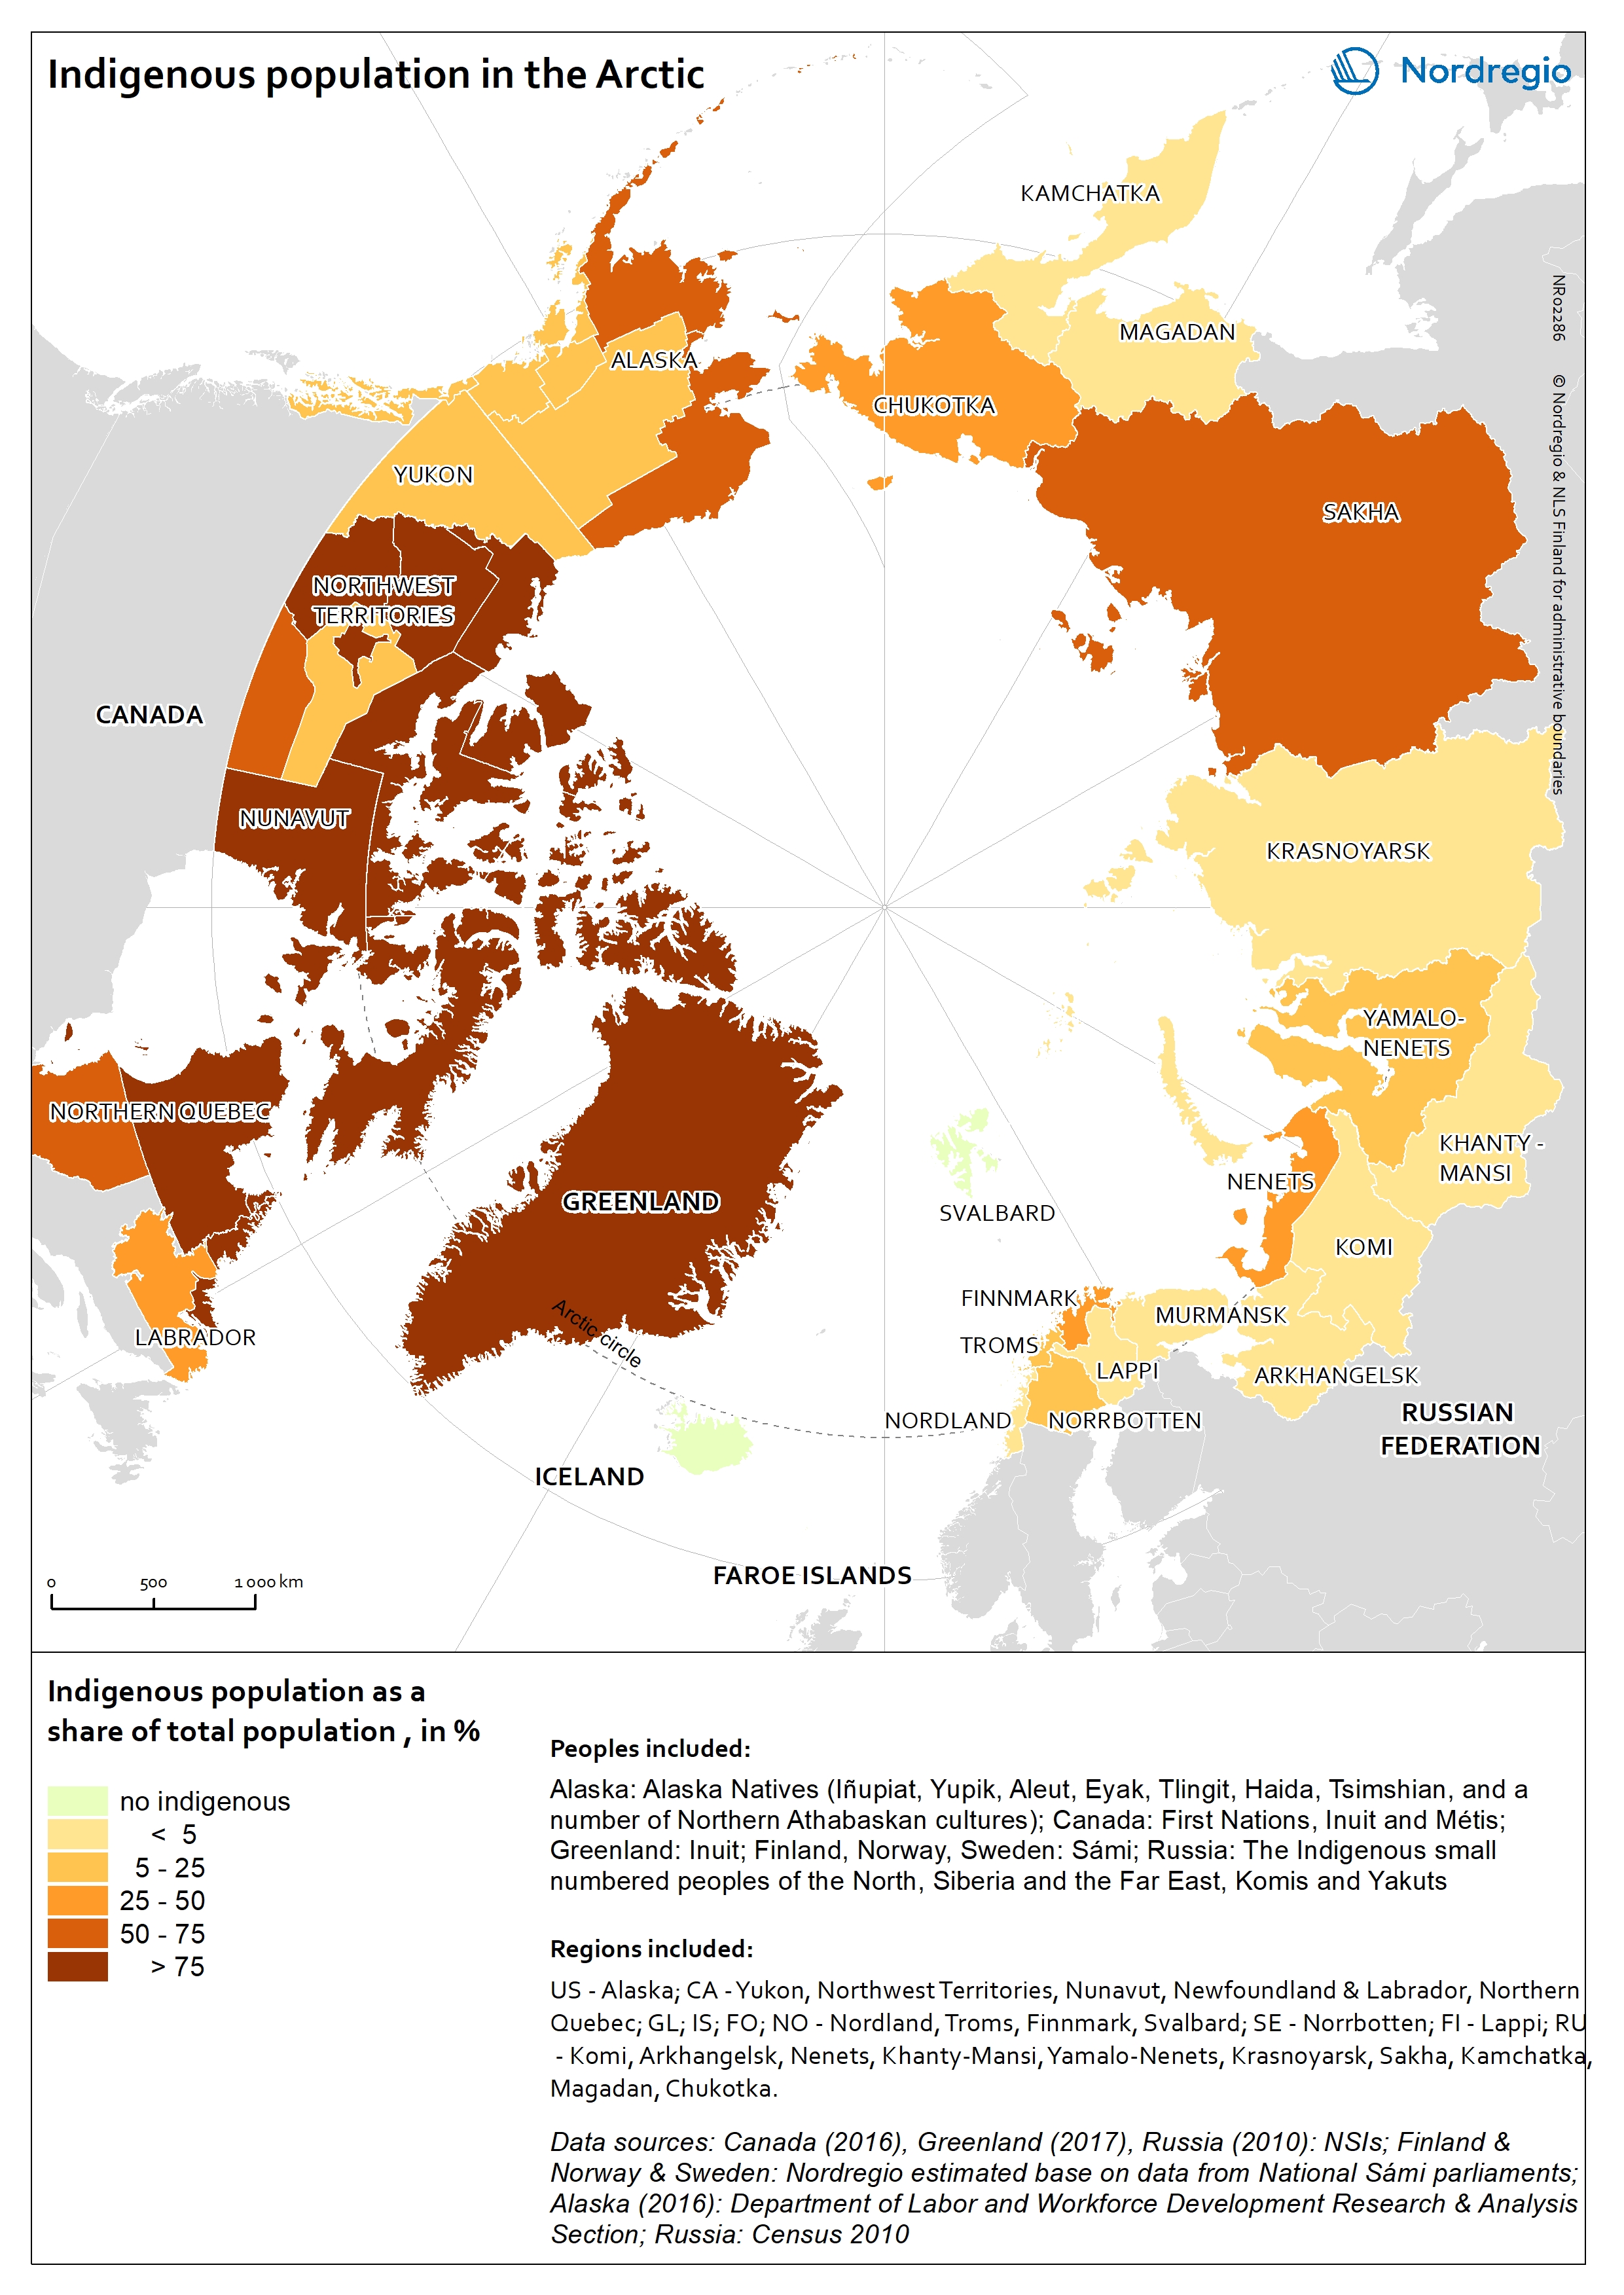
Indigenous population in the Arctic
The map shows the indigenous population as a share of the total population in the Arctic. Approximately one million people, or 9% of the total population in the Arctic is indigenous. Indigenous population reassembles more than 40 different ethnic groups. In terms of statistics there are no circumpolar definition of an indigenous person and therefore the number of indigenous people is based on different national definitions. Official statistics do not necessarily recognize indigenous populations separately. The indigenous population is the highest in the Canadian Arctic and in Greenland, weighing more than 75% of the total population. The Yukon, the southern part of Northern Quebec, and Labrador and Newfoundland (Canada) have the lowest shares of indigenous population. In the remaining part of the Arctic, indigenous peoples represent less than half of the total population, except in Sakha (Russian Federation), Southwest Region and Northern Region (Alaska, USA) where 50-75% of the population is indigenous. There are no indigenous people in Iceland, the Faroe Islands and Svalbard.
- 2019 March
- Arctic
- Demography
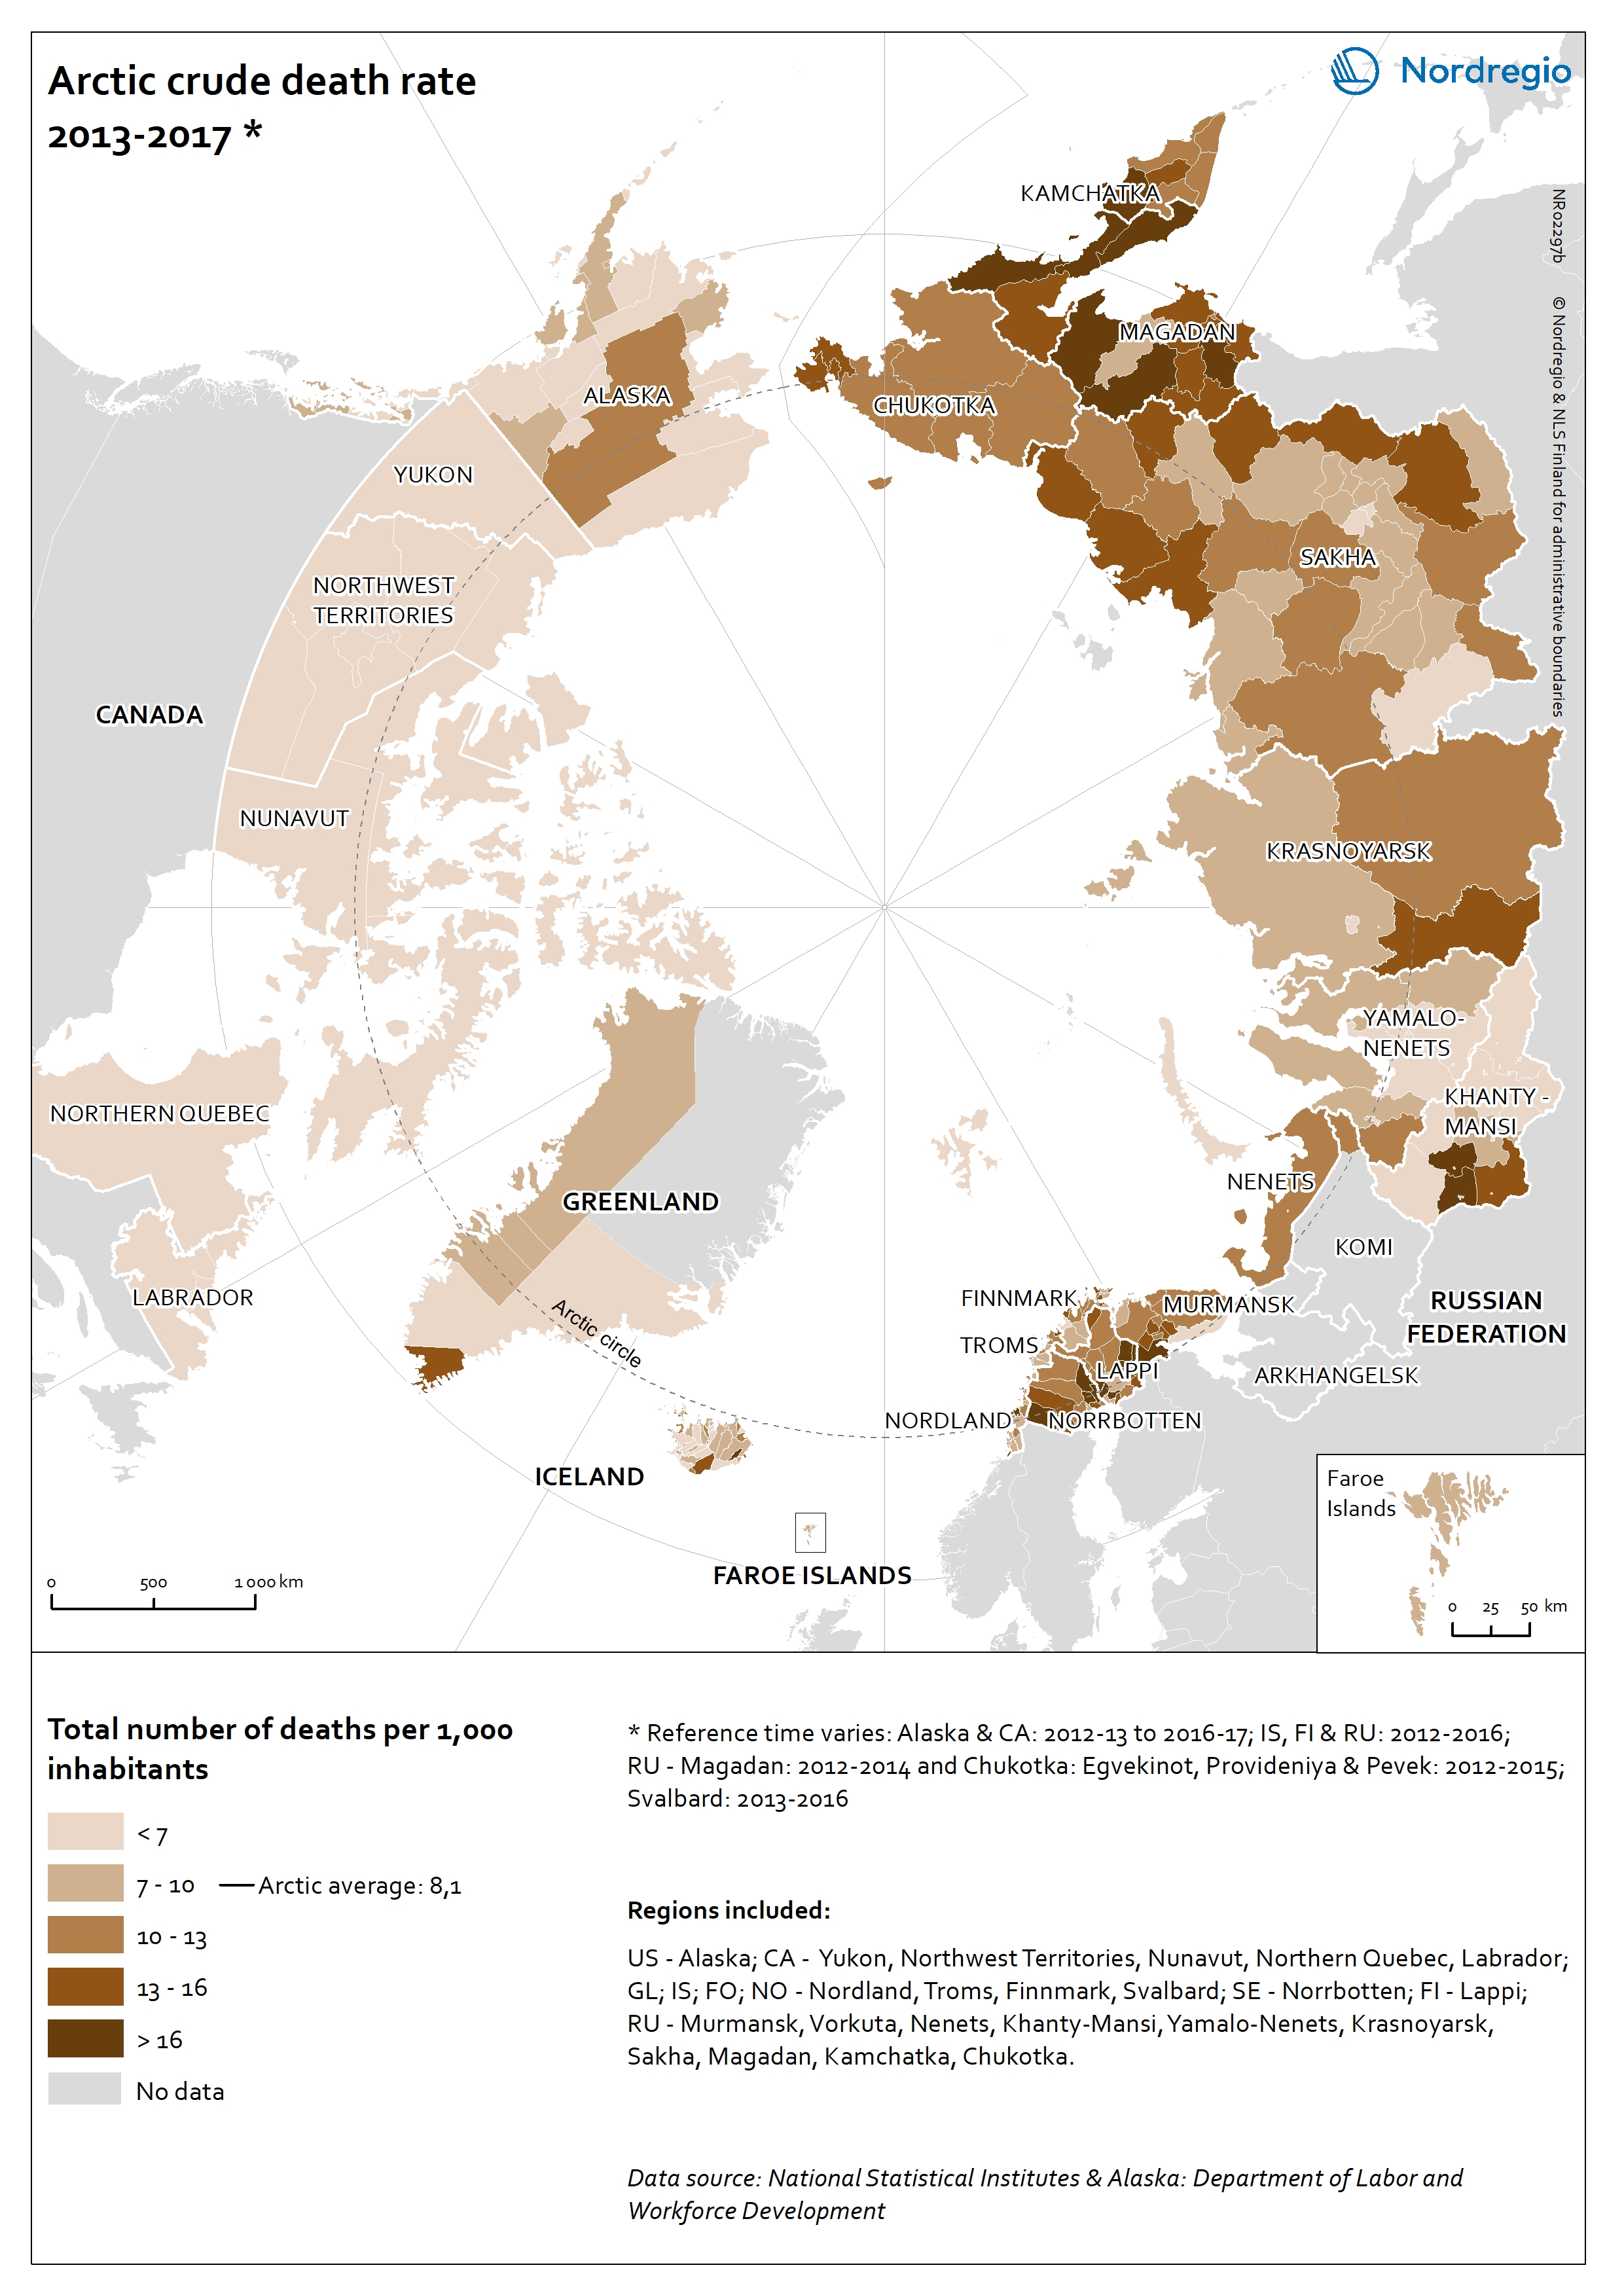
Crude death rate in the Arctic
The map shows the crude death rate in the Arctic at the sub-regional level in 2013-2017. The crude death rate is the total number of death per 1 000 inhabitants. The dark brown tones indicate subregions with a large number of deaths per 1 000 inhabitants and correspondingly the light brown tones indicate subregions with a low number of deaths. The Arctic average number of deaths in 2013-2017 was 8,1 per 1 000 inhabitants.
- 2019 March
- Arctic
- Demography
