130 Maps
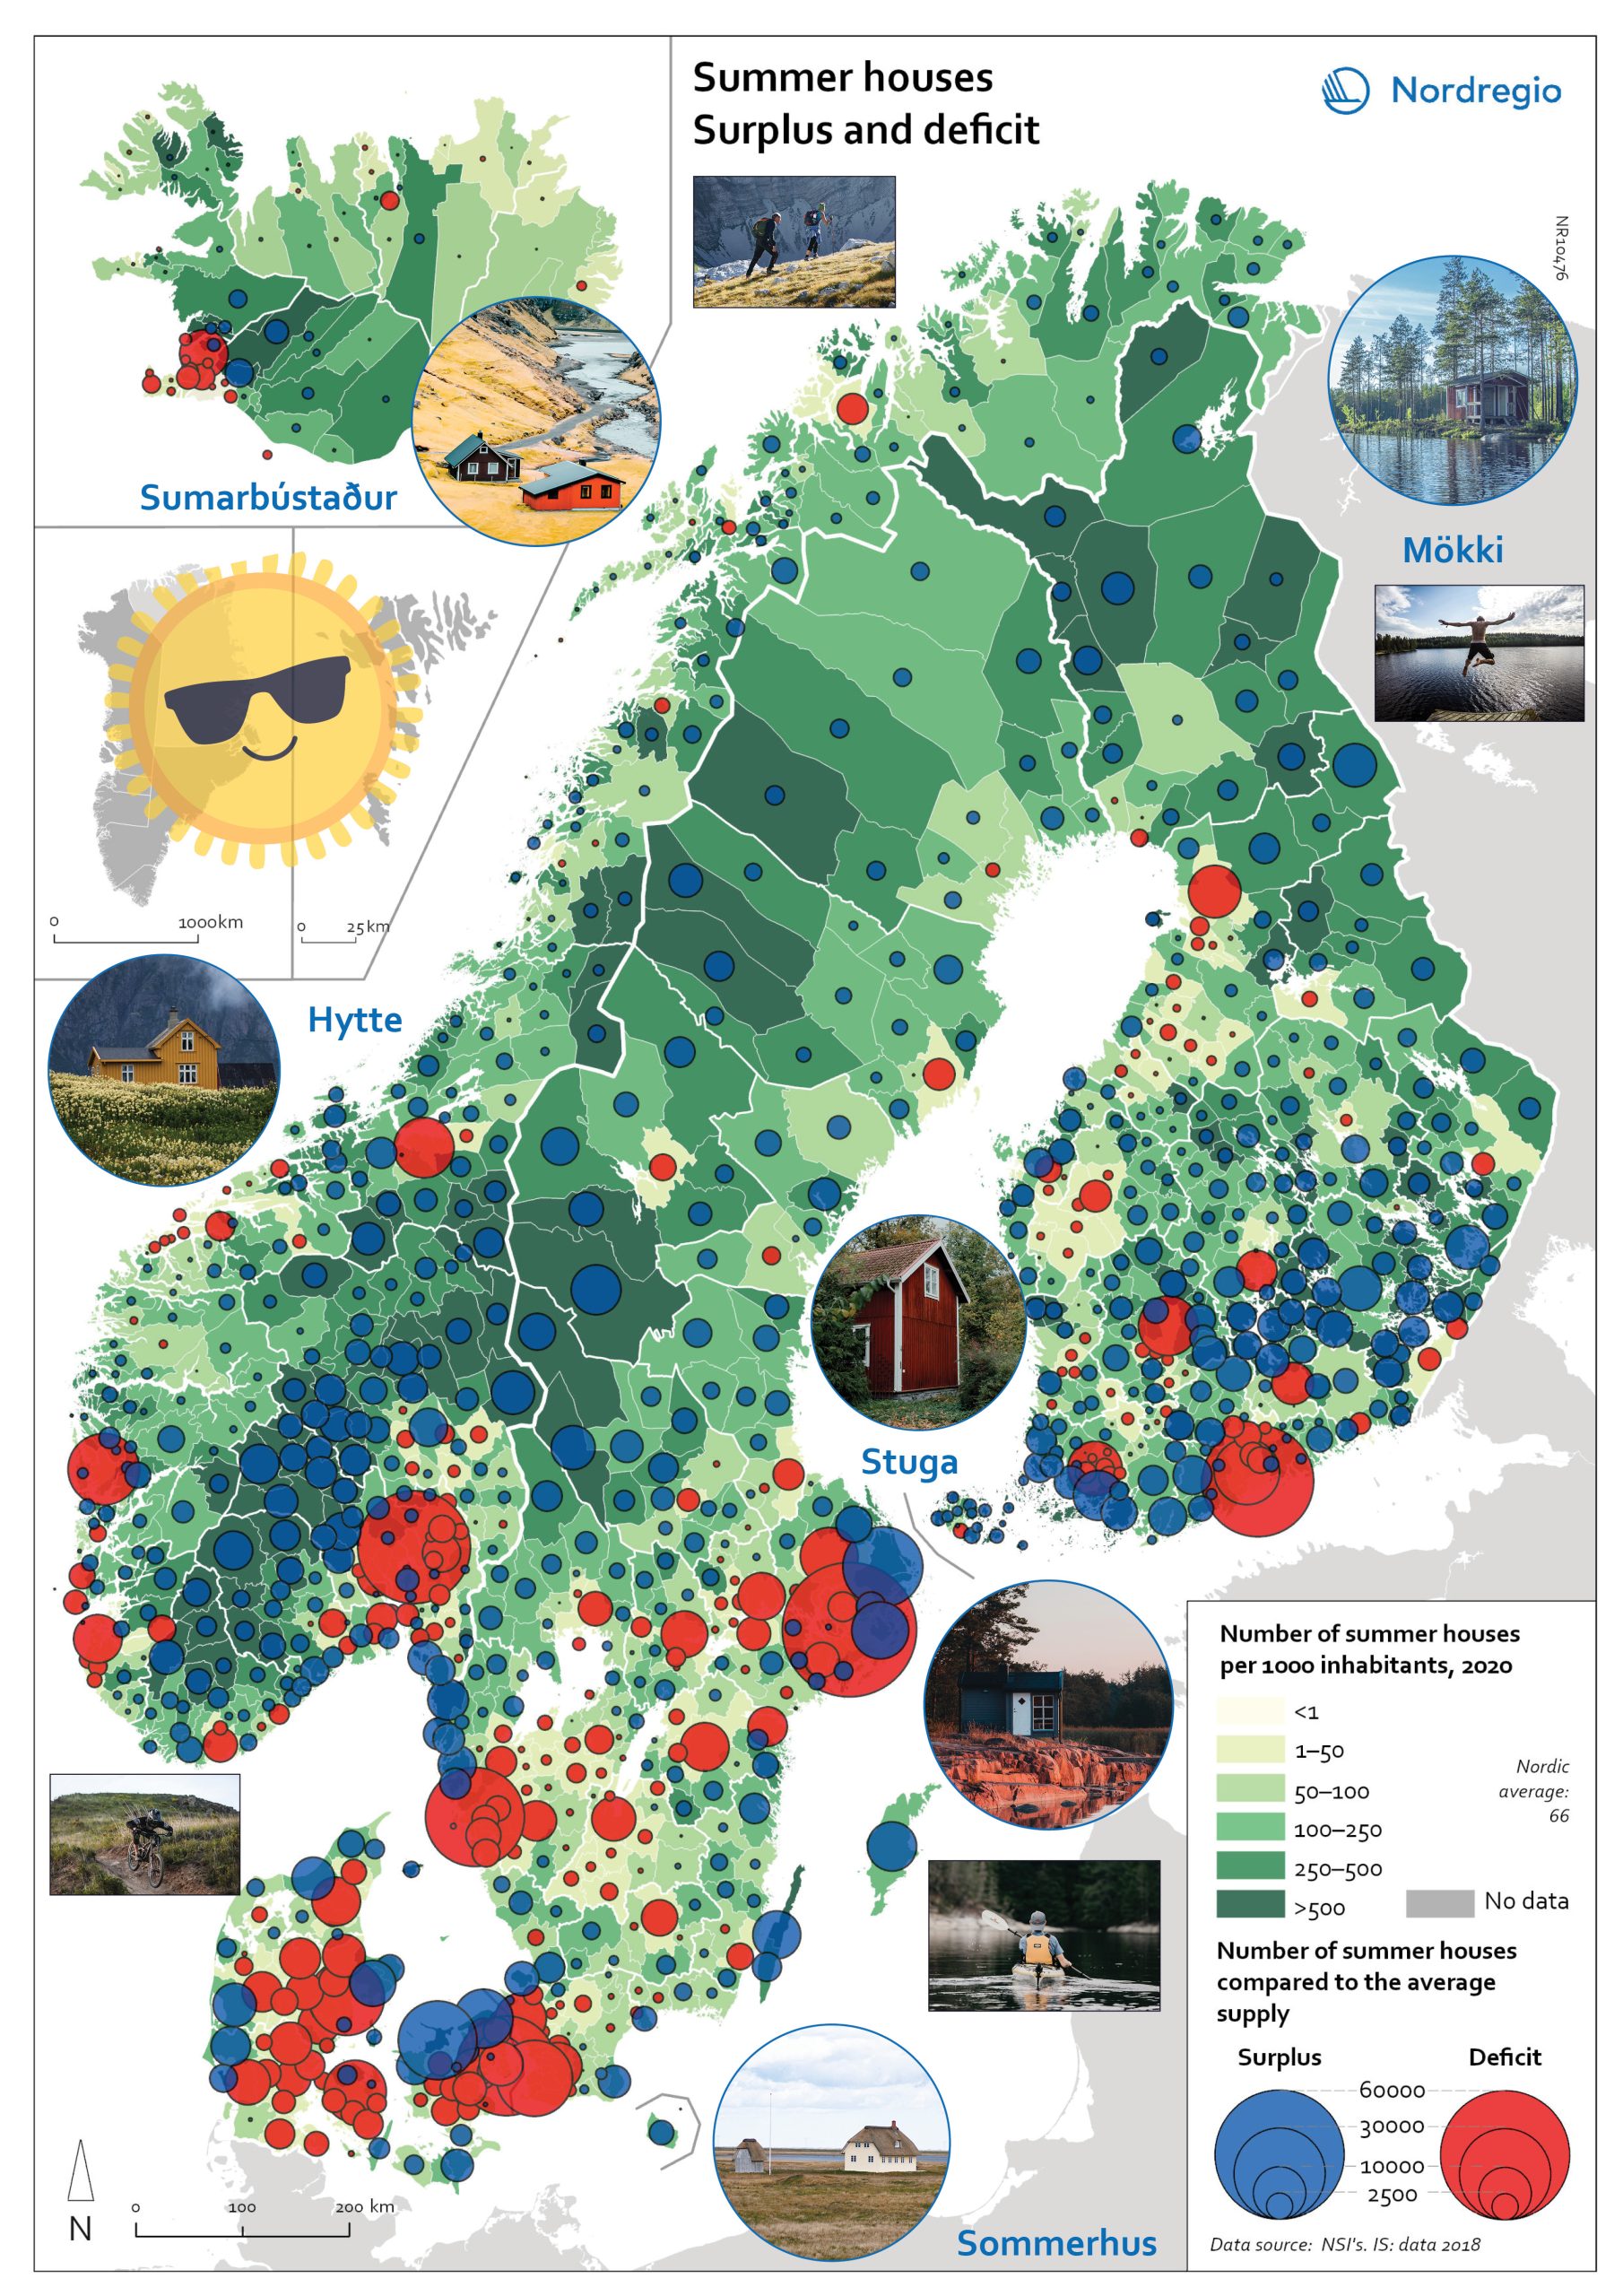
Gone missing: Nordic people!
Nordregio Summer Map 2022: Empty streets, closed restaurants – where is everyone? Nordic cities are about to quiet down as millions of people are logging out from work. But where do they go – Mallorca? Some yes, but the Nordic people are known for their nature-loving and private spirit, and most like to unwind in isolation. So, they head to their private paradises – to one of the 1.8 million summer houses around the Nordics, or as they would call them: sommerhus, stuga, hytte, sumarbústaður or mökki. The Nordregio Summer Map 2022 reveals the secret spots. The Finnish and Norwegians are most likely already packing their cars and leaving the cities: the highest supply of summer houses per inhabitant is found in Finland (92 summer houses per 1000 inhabitants) closely followed by Norway (82). The Swedish (59) Danish (40) and Icelandic (40) people seem to have more varied summer activities. There are large regional differences in the number of summer houses and the number of potential users – so not enough cabins where people would want them! And this is the dilemma Nordregio Summer Map 2022 shows in detail. Most people live in the larger urban areas while many summer houses are located in more remote and sparsely populated areas. The largest deficit of summer houses is found in Stockholm: with almost 1 million inhabitants, there is a need for 65,000 summer houses but the municipality has only 2,000 to offer! So, people living in Stockholm need to go elsewhere to find a summer house. The same goes for the other capital municipalities which have large deficits in summer houses: Oslo is missing 44,000, Helsinki 43,000, and Copenhagen 34,000. Fortunately, there are places that would happily accommodate these second-home searchers. Good news for Stockholm after all as the top-scoring municipality…
 2022 June
 - Nordic Region
- Tourism
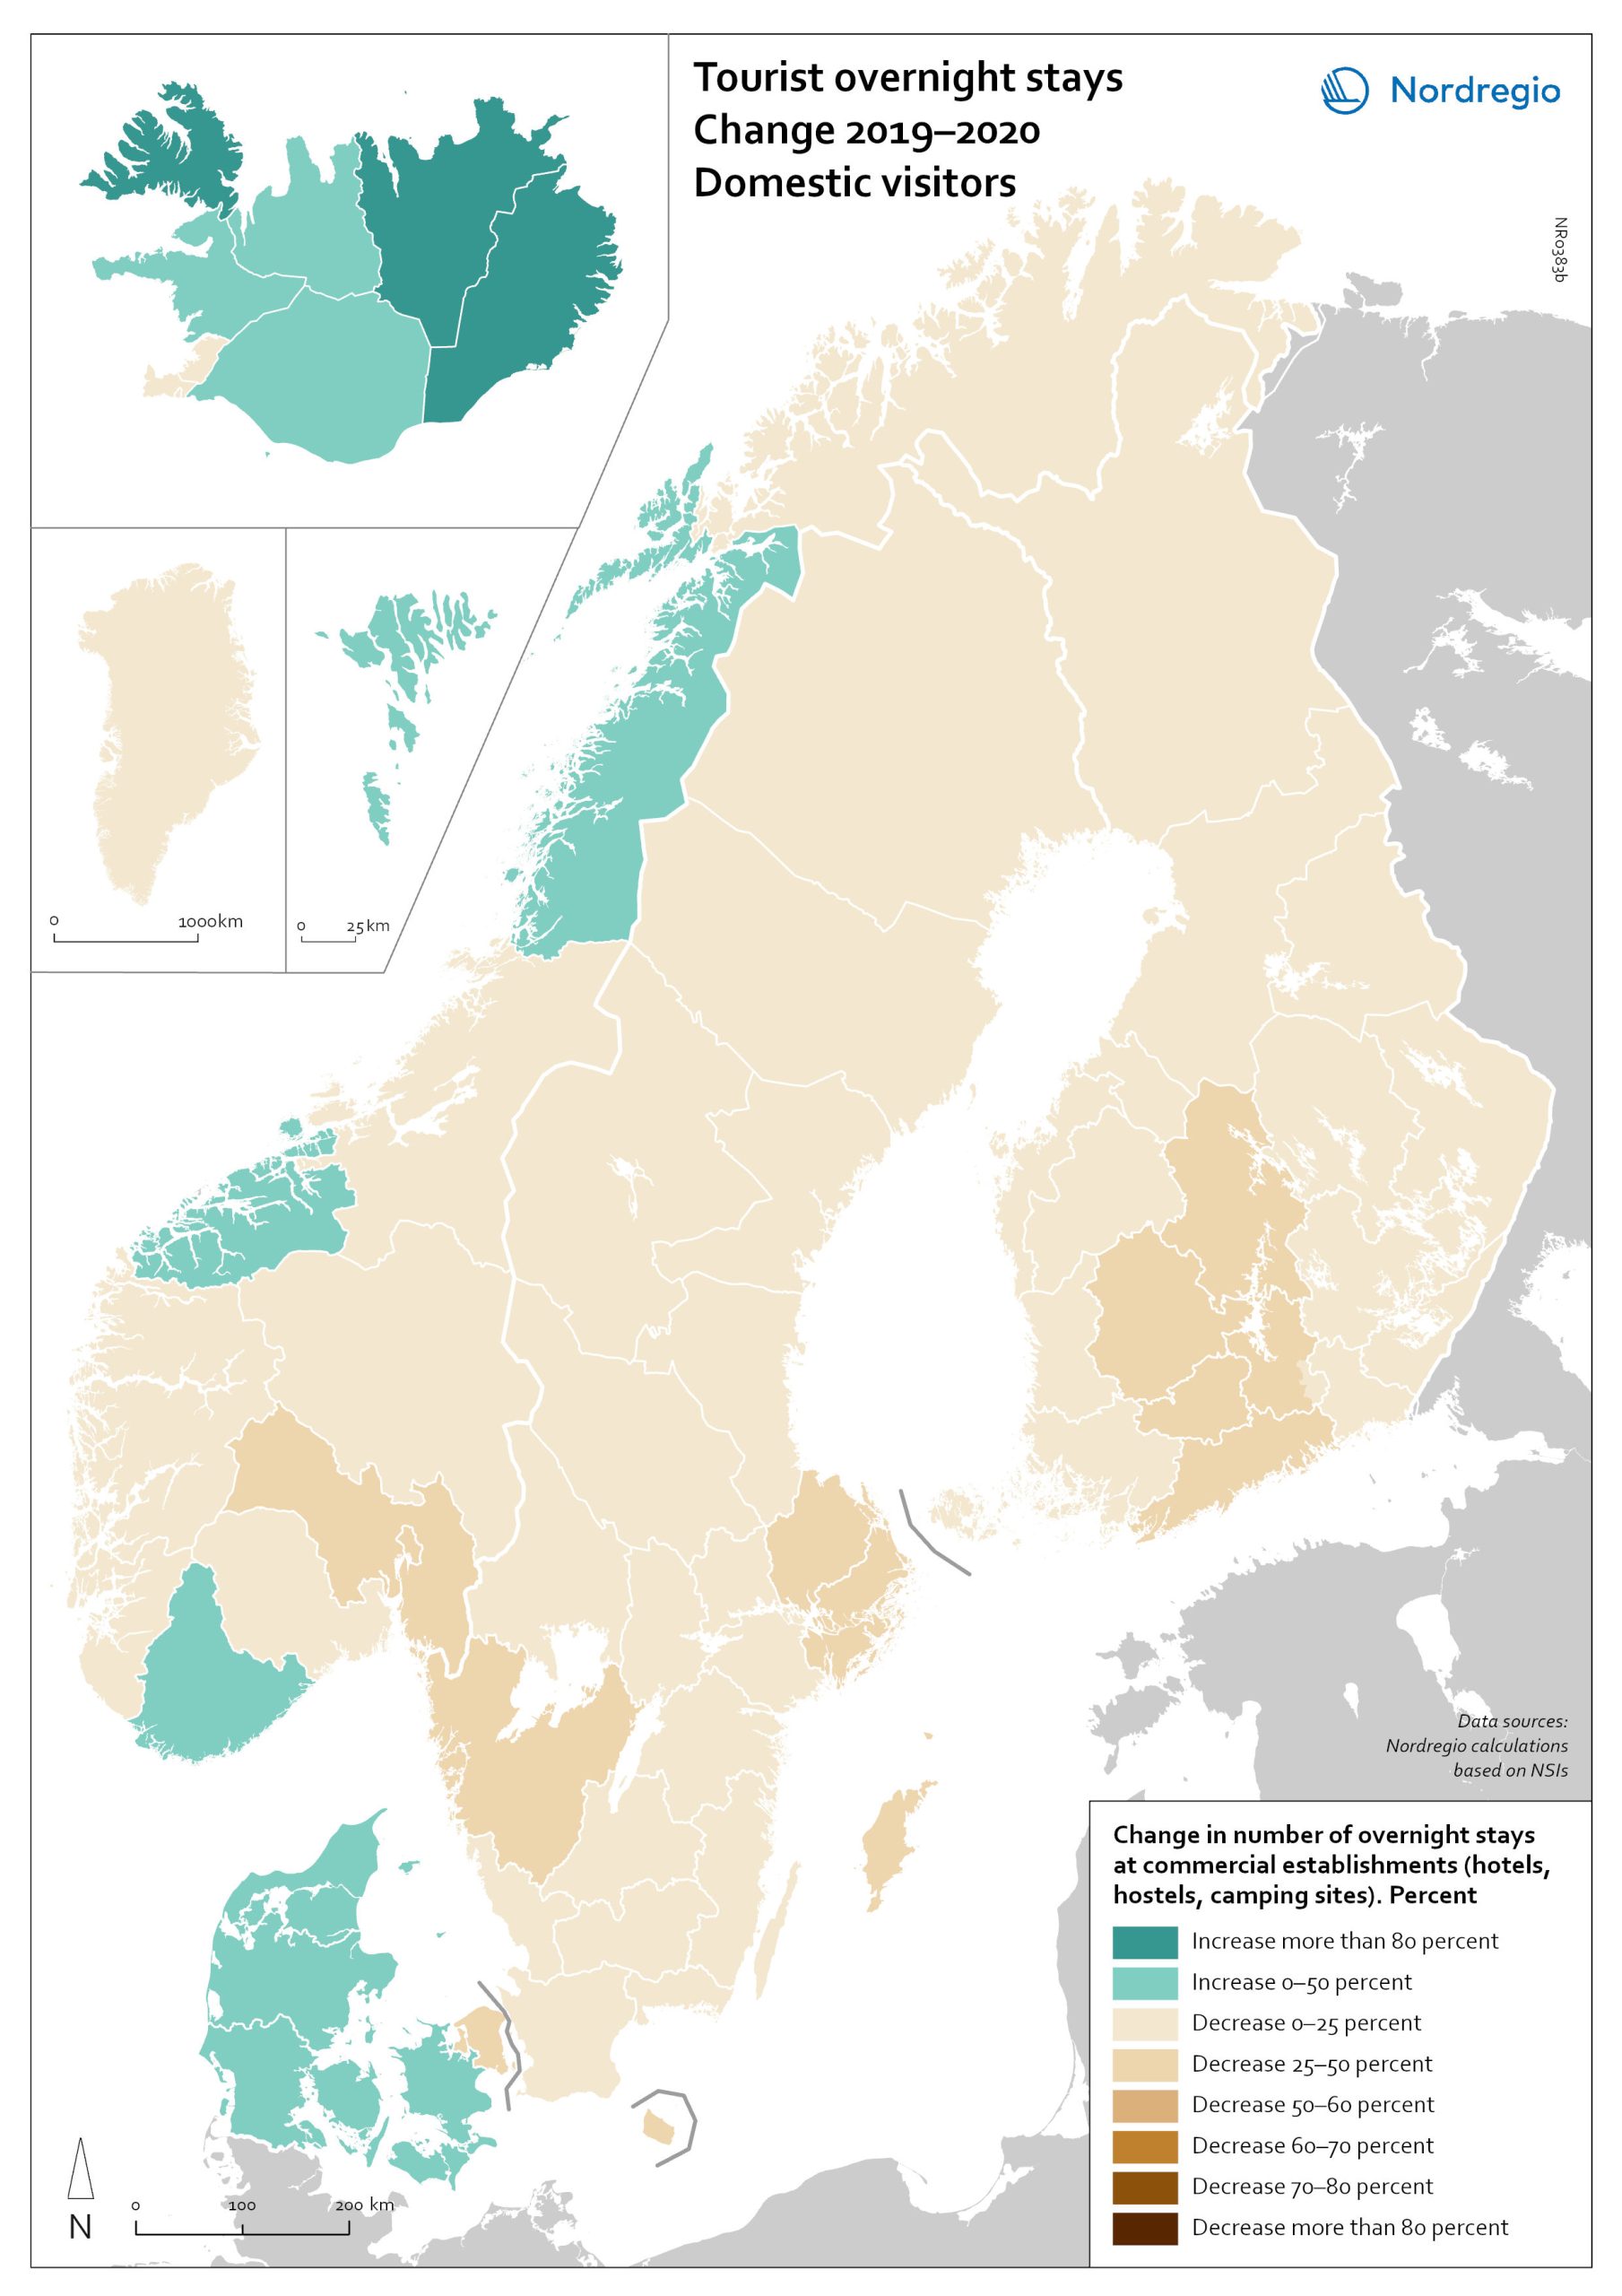
Change in overnight stays for domestic visitors 2019–2020
The map shows the relative change in the number of overnight stays at the regional level between 2019 and 2020 for domestic visitors. This map is related to the same map showing change in overnight stays for foreign visitors 2019–2020. The sharpest fall in visitors from abroad was in destinations where foreign tourists usually make up a high proportion of the total visitors. This is particularly relevant to islands like Åland (89% decrease on foreign visitors, from early 2019 to mid-2020) and to Iceland (66-77% drop depending on region). Lofoten and Nordland County in Norway, as well as Western Norway with Møre and Romsdal, which also have a high proportion of international tourists during the summer season due to their scenic landscape, also recorded sharp falls of 77-79% on foreign visitors during the same period. In Finland, the lake district (South Savo) and Southern Karelia, as well as the coastal Central Ostrobothnia (major cities Vasa and Karleby), recorded a 75-77% drop in the number of visitors from abroad. The fall here was mainly due to the lack of tourists from Russia. Even Finnish Lapland suffered a major fall in international visits during the winter peak period. For many local businesses that rely heavily on winter holidaymakers, the 2021/22 winter was a make-or-break season. In Sweden, the regions of Kalmar, Västra Götaland, Värmland and Örebro lost 77–79% of visitors from abroad, probably due to much fewer visitors from neighbouring Norway and from Denmark. In Denmark, the number of overnight stays by visitors from abroad to the Capital Region was down by 73%, whereas the number of domestic visitors declined by 27%. No region lost as many overnight visitors, both from abroad and domestic, as the capital cities and larger urban areas in the Nordic countries. Copenhagen, Oslo, Stockholm, Helsinki and Reykjavik…
- 2022 March
- Nordic Region
- Tourism
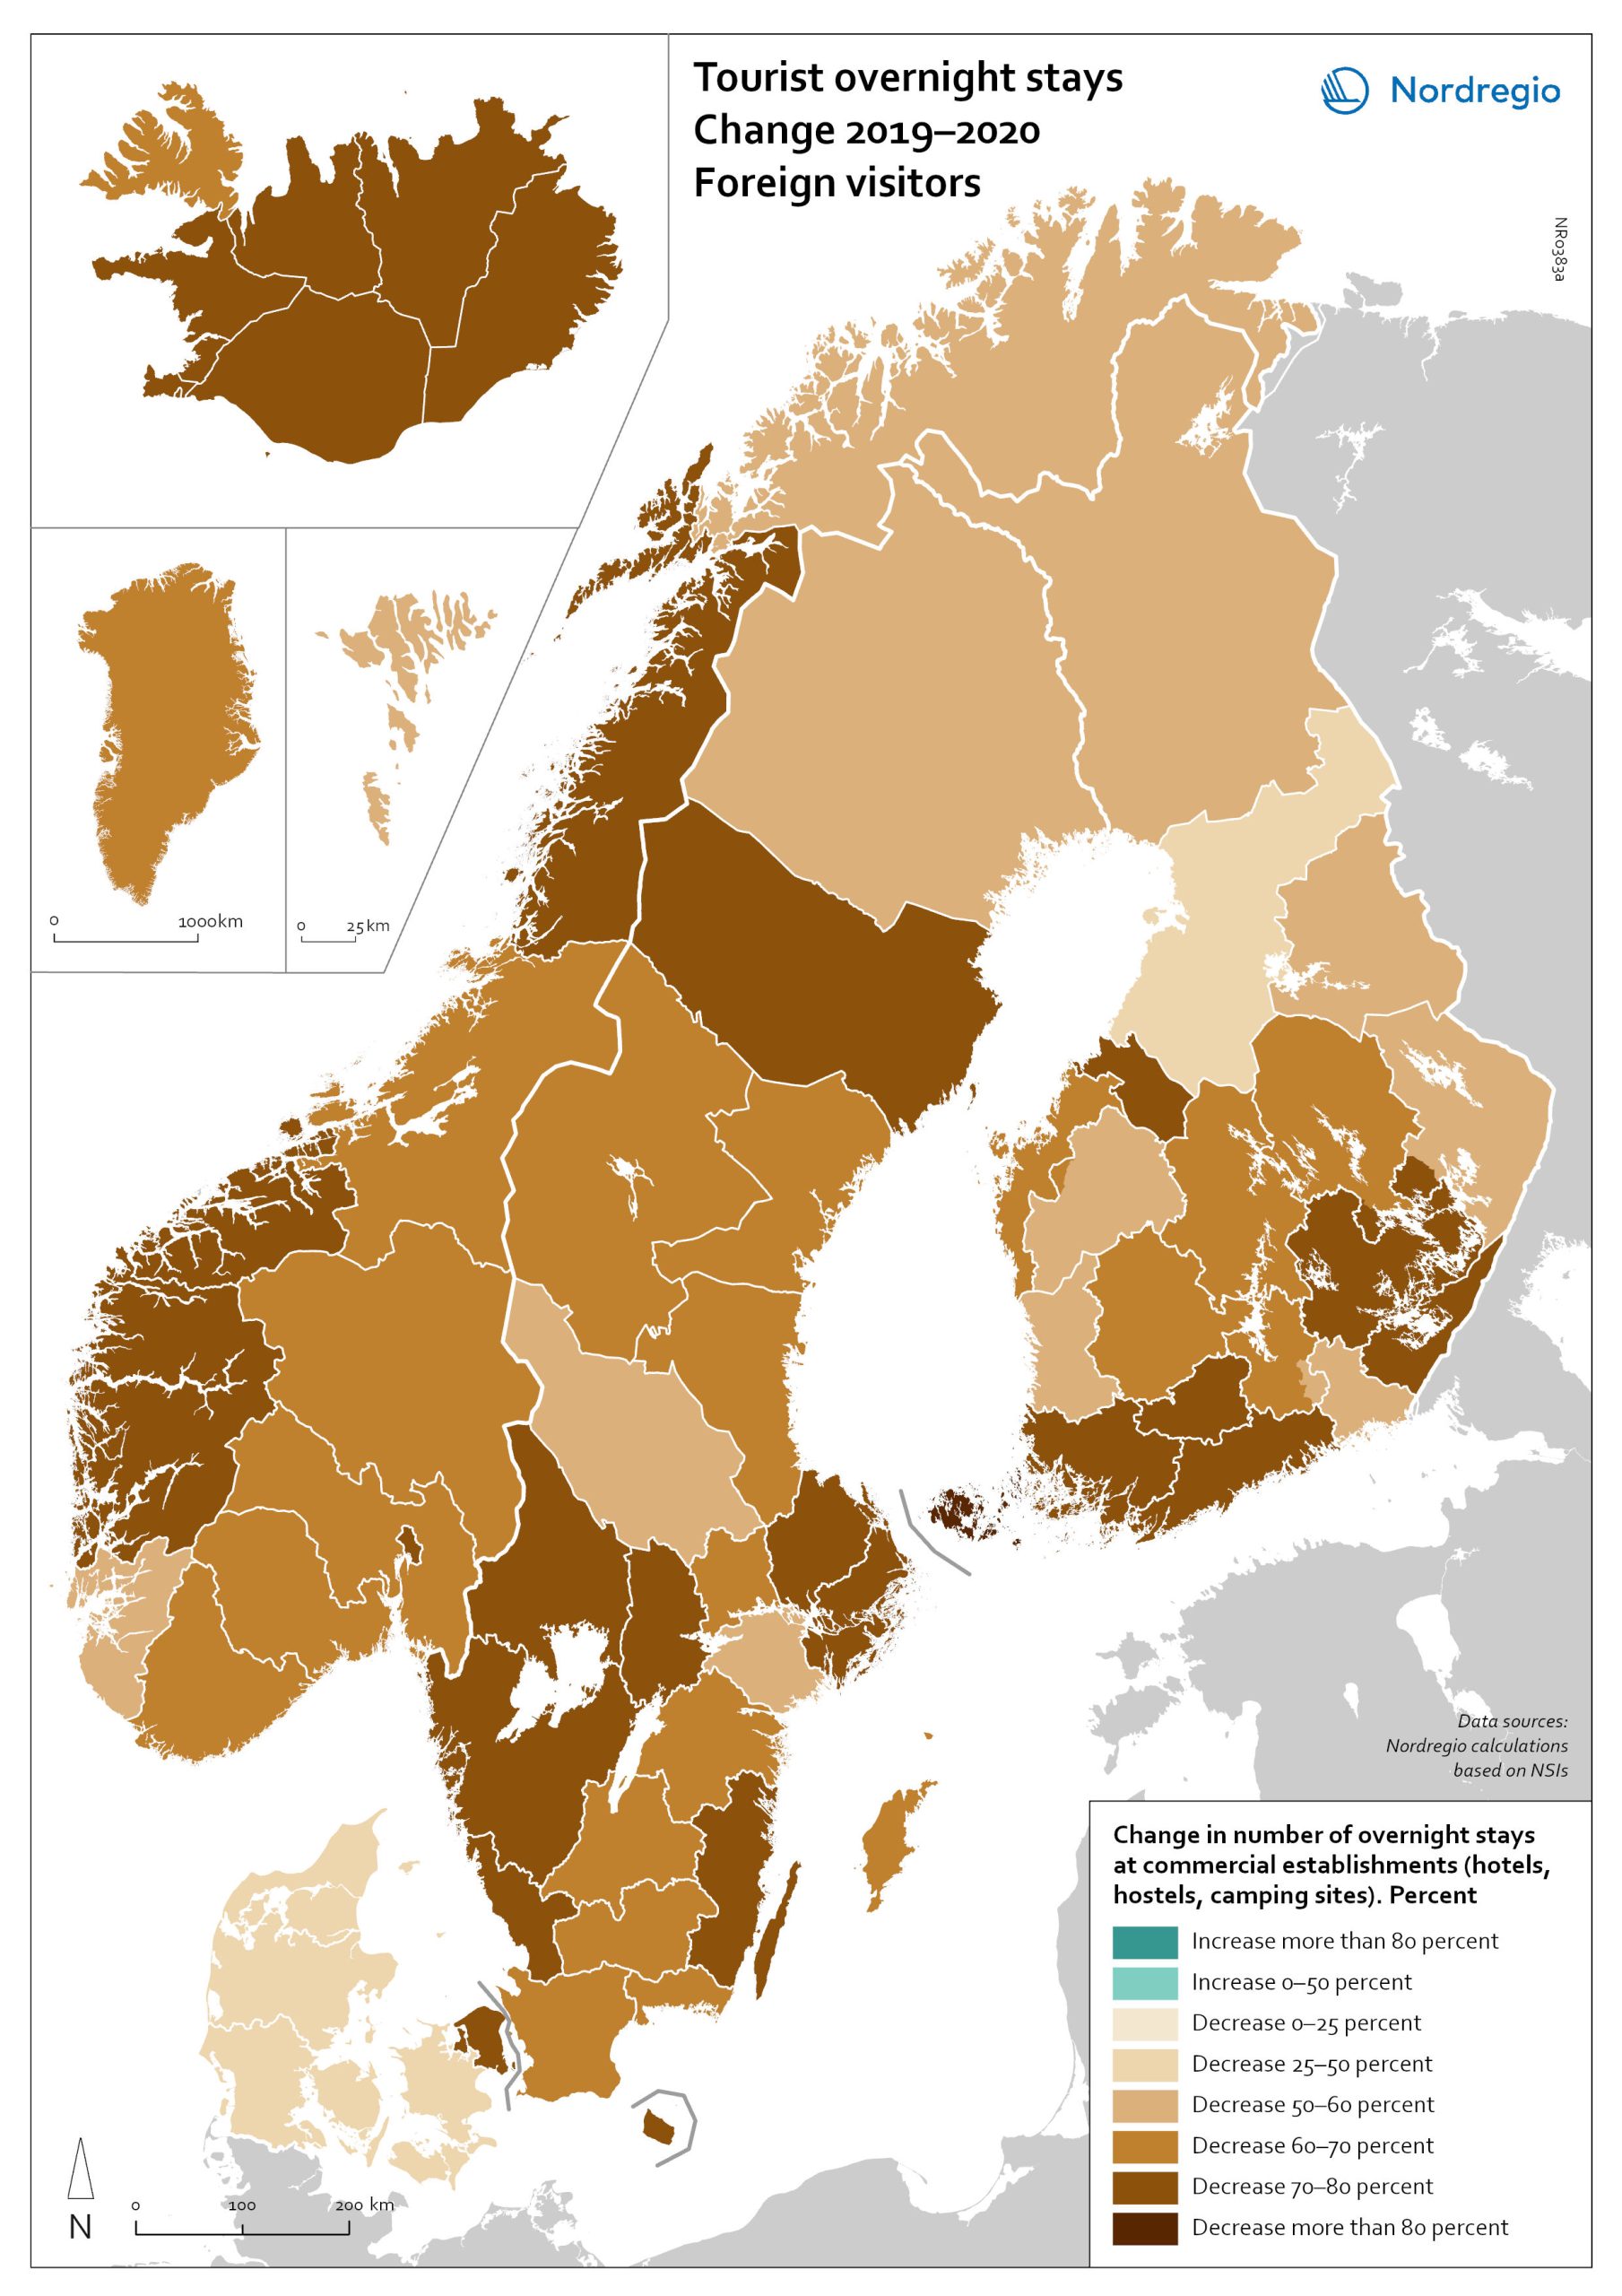
Change in overnight stays for foreign visitors 2019–2020
The map shows the relative change in the number of overnight stays at the regional level between 2019 and 2020 for foreign visitors. This map is related to the same map showing change in overnight stays for domestic visitors 2019–2020. The sharpest fall in visitors from abroad was in destinations where foreign tourists usually make up a high proportion of the total visitors. This is particularly relevant to islands like Åland (89% decrease on foreign visitors, from early 2019 to mid-2020) and to Iceland (66-77% drop depending on region). Lofoten and Nordland County in Norway, as well as Western Norway with Møre and Romsdal, which also have a high proportion of international tourists during the summer season due to their scenic landscape, also recorded sharp falls of 77-79% on foreign visitors during the same period. In Finland, the lake district (South Savo) and Southern Karelia, as well as the coastal Central Ostrobothnia (major cities Vasa and Karleby), recorded a 75-77% drop in the number of visitors from abroad. The fall here was mainly due to the lack of tourists from Russia. Even Finnish Lapland suffered a major fall in international visits during the winter peak period. For many local businesses that rely heavily on winter holidaymakers, the 2021/22 winter was a make-or-break season. In Sweden, the regions of Kalmar, Västra Götaland, Värmland and Örebro lost 77–79% of visitors from abroad, probably due to much fewer visitors from neighbouring Norway and from Denmark. In Denmark, the number of overnight stays by visitors from abroad to the Capital Region was down by 73%, whereas the number of domestic visitors declined by 27%. No region lost as many overnight visitors, both from abroad and domestic, as the capital cities and larger urban areas in the Nordic countries. Copenhagen, Oslo, Stockholm, Helsinki and Reykjavik…
- 2022 March
- Nordic Region
- Tourism
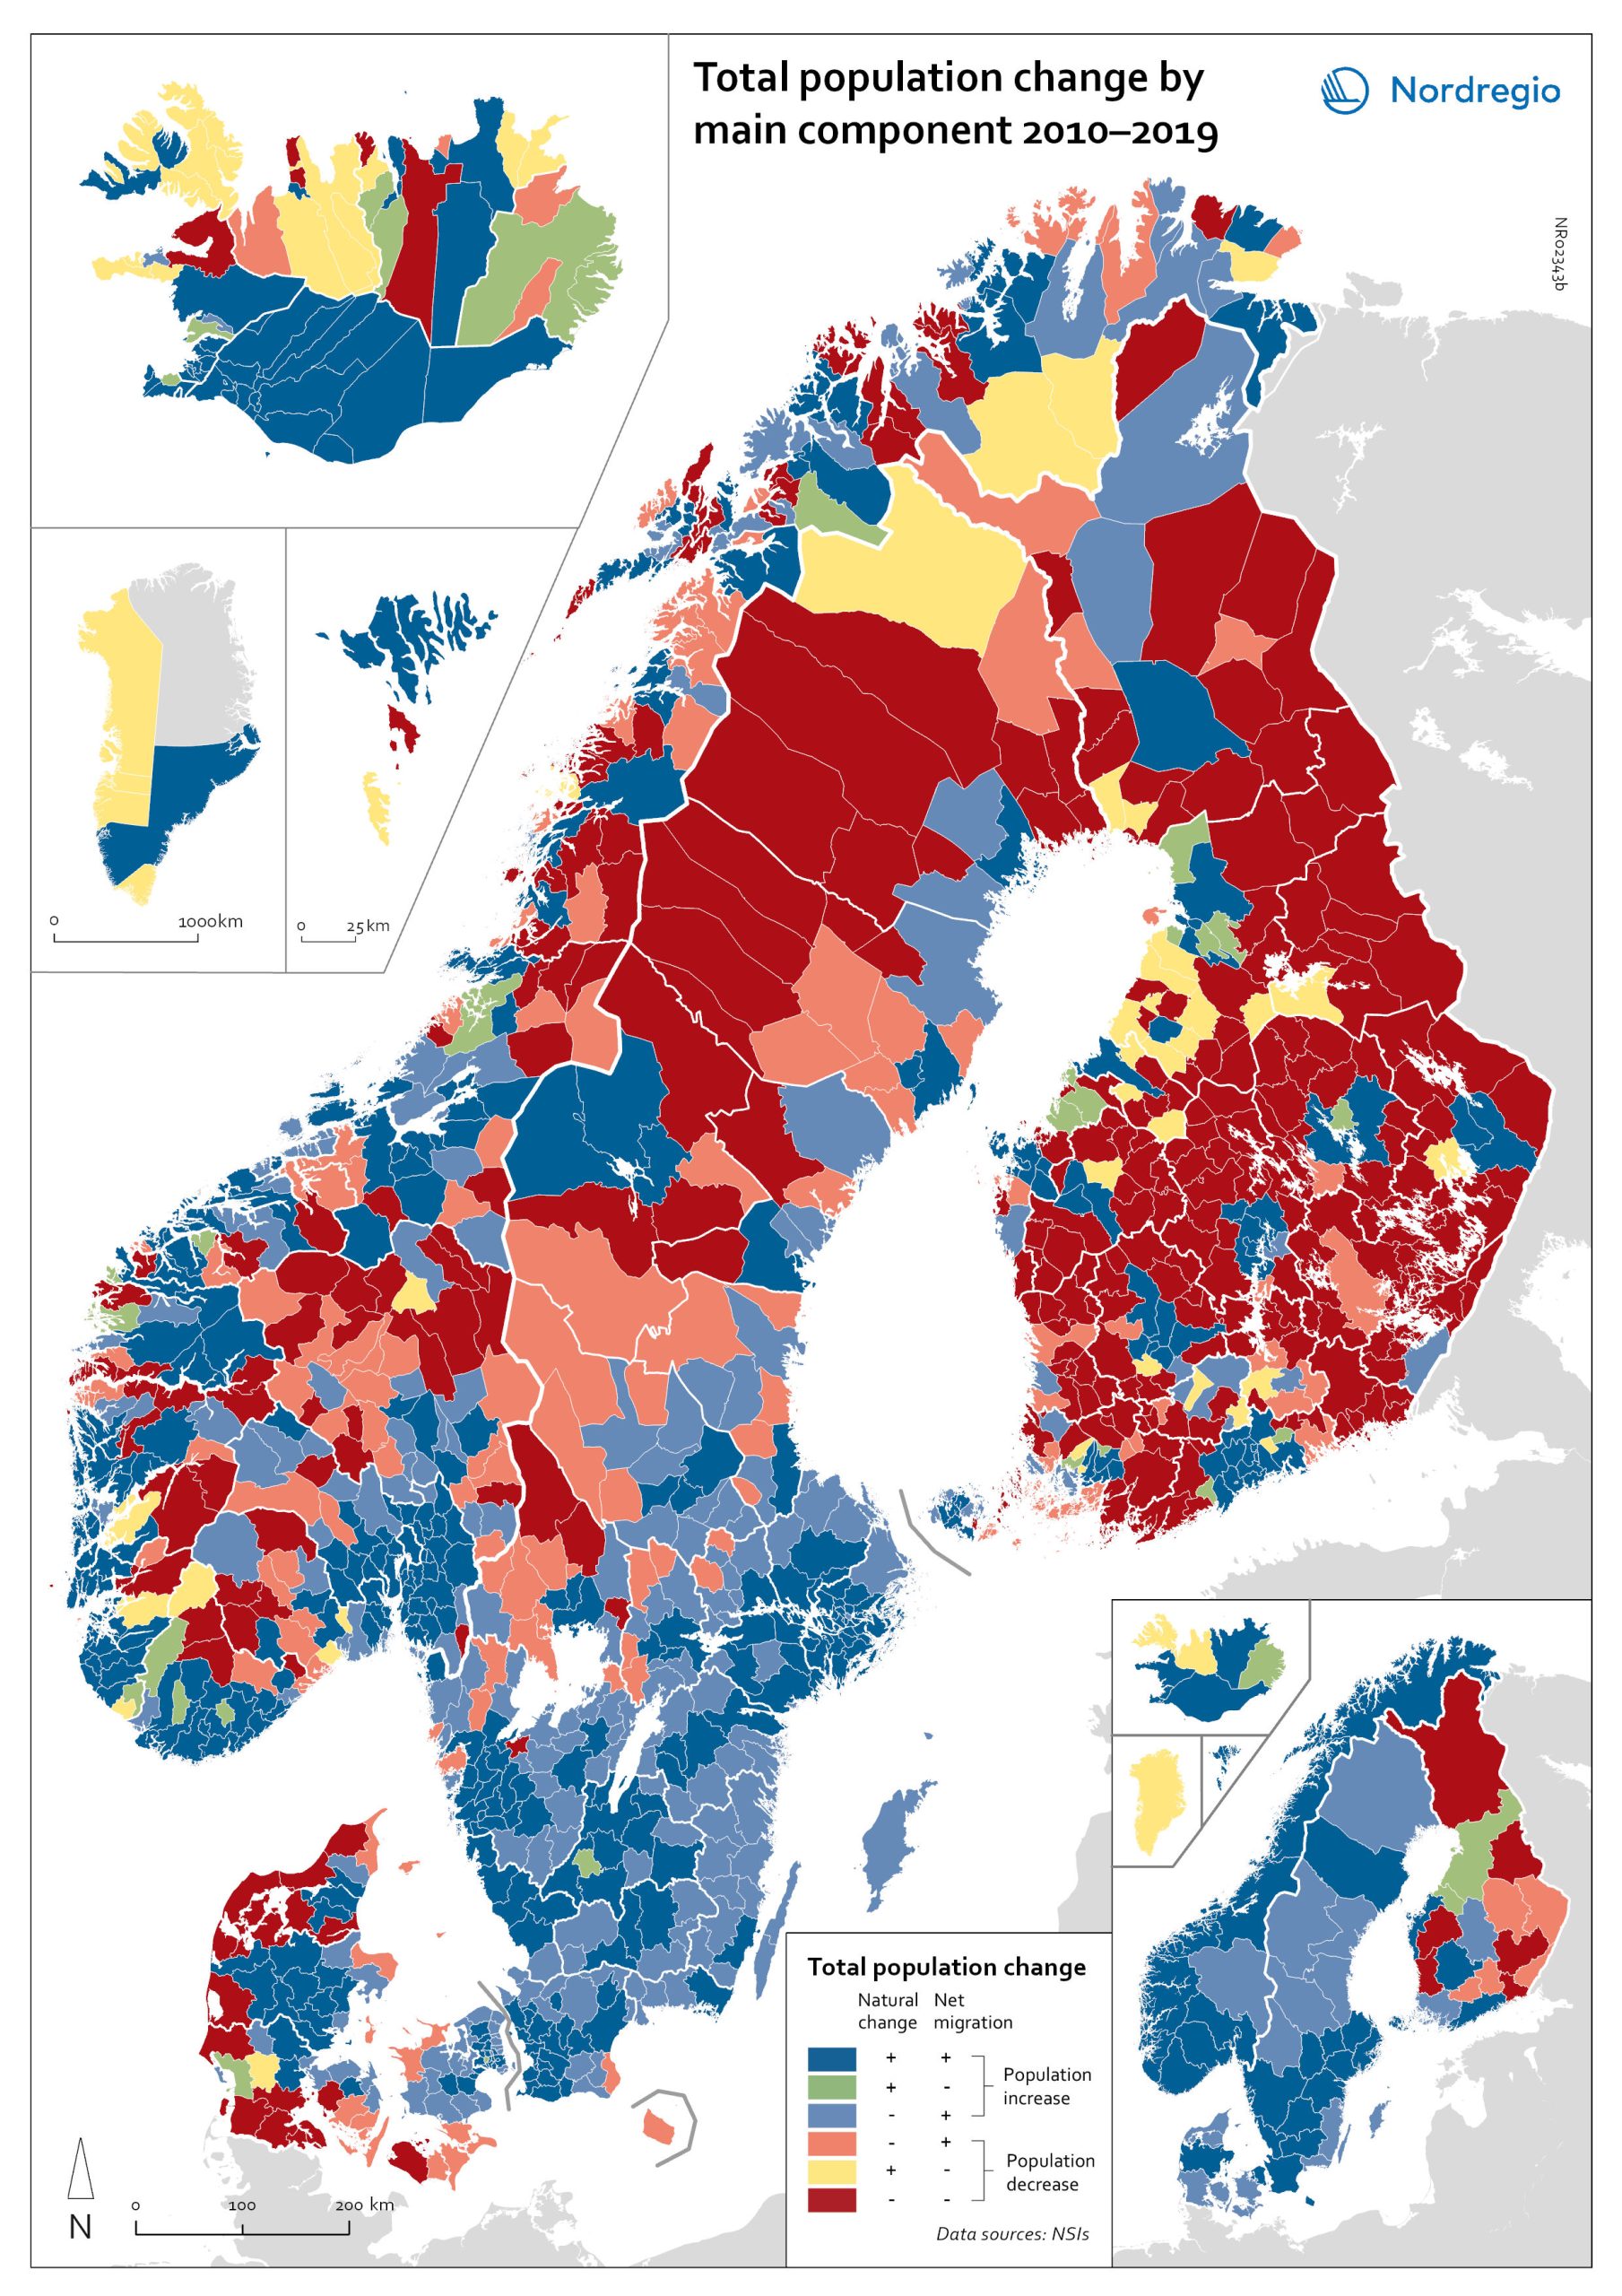
Population change by component 2010-2019
The map shows the population change by component 2010-2019. The map is related to the same map showing regional and municipal patterns in population change by component in 2020. Regions are divided into six classes of population change. Those in shades of blue or green are where the population has increased, and those in shades of red or yellow are where the population has declined. At the regional level (see small inset map), all in Denmark, all in the Faroes, most in southern Norway, southern Sweden, all but one in Iceland, all of Greenland, and a few around the capital in Helsinki had population increases in 2010-2019. Most regions in the north of Norway, Sweden, and Finland had population declines in 2010-2019. Many other regions in southern and eastern Finland also had population declines in 2010-2019, mainly because the country had more deaths than births, a trend that pre-dated the pandemic. In 2020, there were many more regions in red where populations were declining due to both natural decrease and net out-migration. At the municipal level, a more varied pattern emerges, with municipalities having quite different trends than the regions of which they form part. Many regions in western Denmark are declining because of negative natural change and outmigration. Many smaller municipalities in Norway and Sweden saw population decline from both negative natural increase and out-migration despite their regions increasing their populations. Many smaller municipalities in Finland outside the three big cities of Helsinki, Turku, and Tampere also saw population decline from both components. A similar pattern took place at the municipal level in 2020 of there being many more regions in red than in the previous decade.
- 2022 March
- Demography
- Migration
- Nordic Region
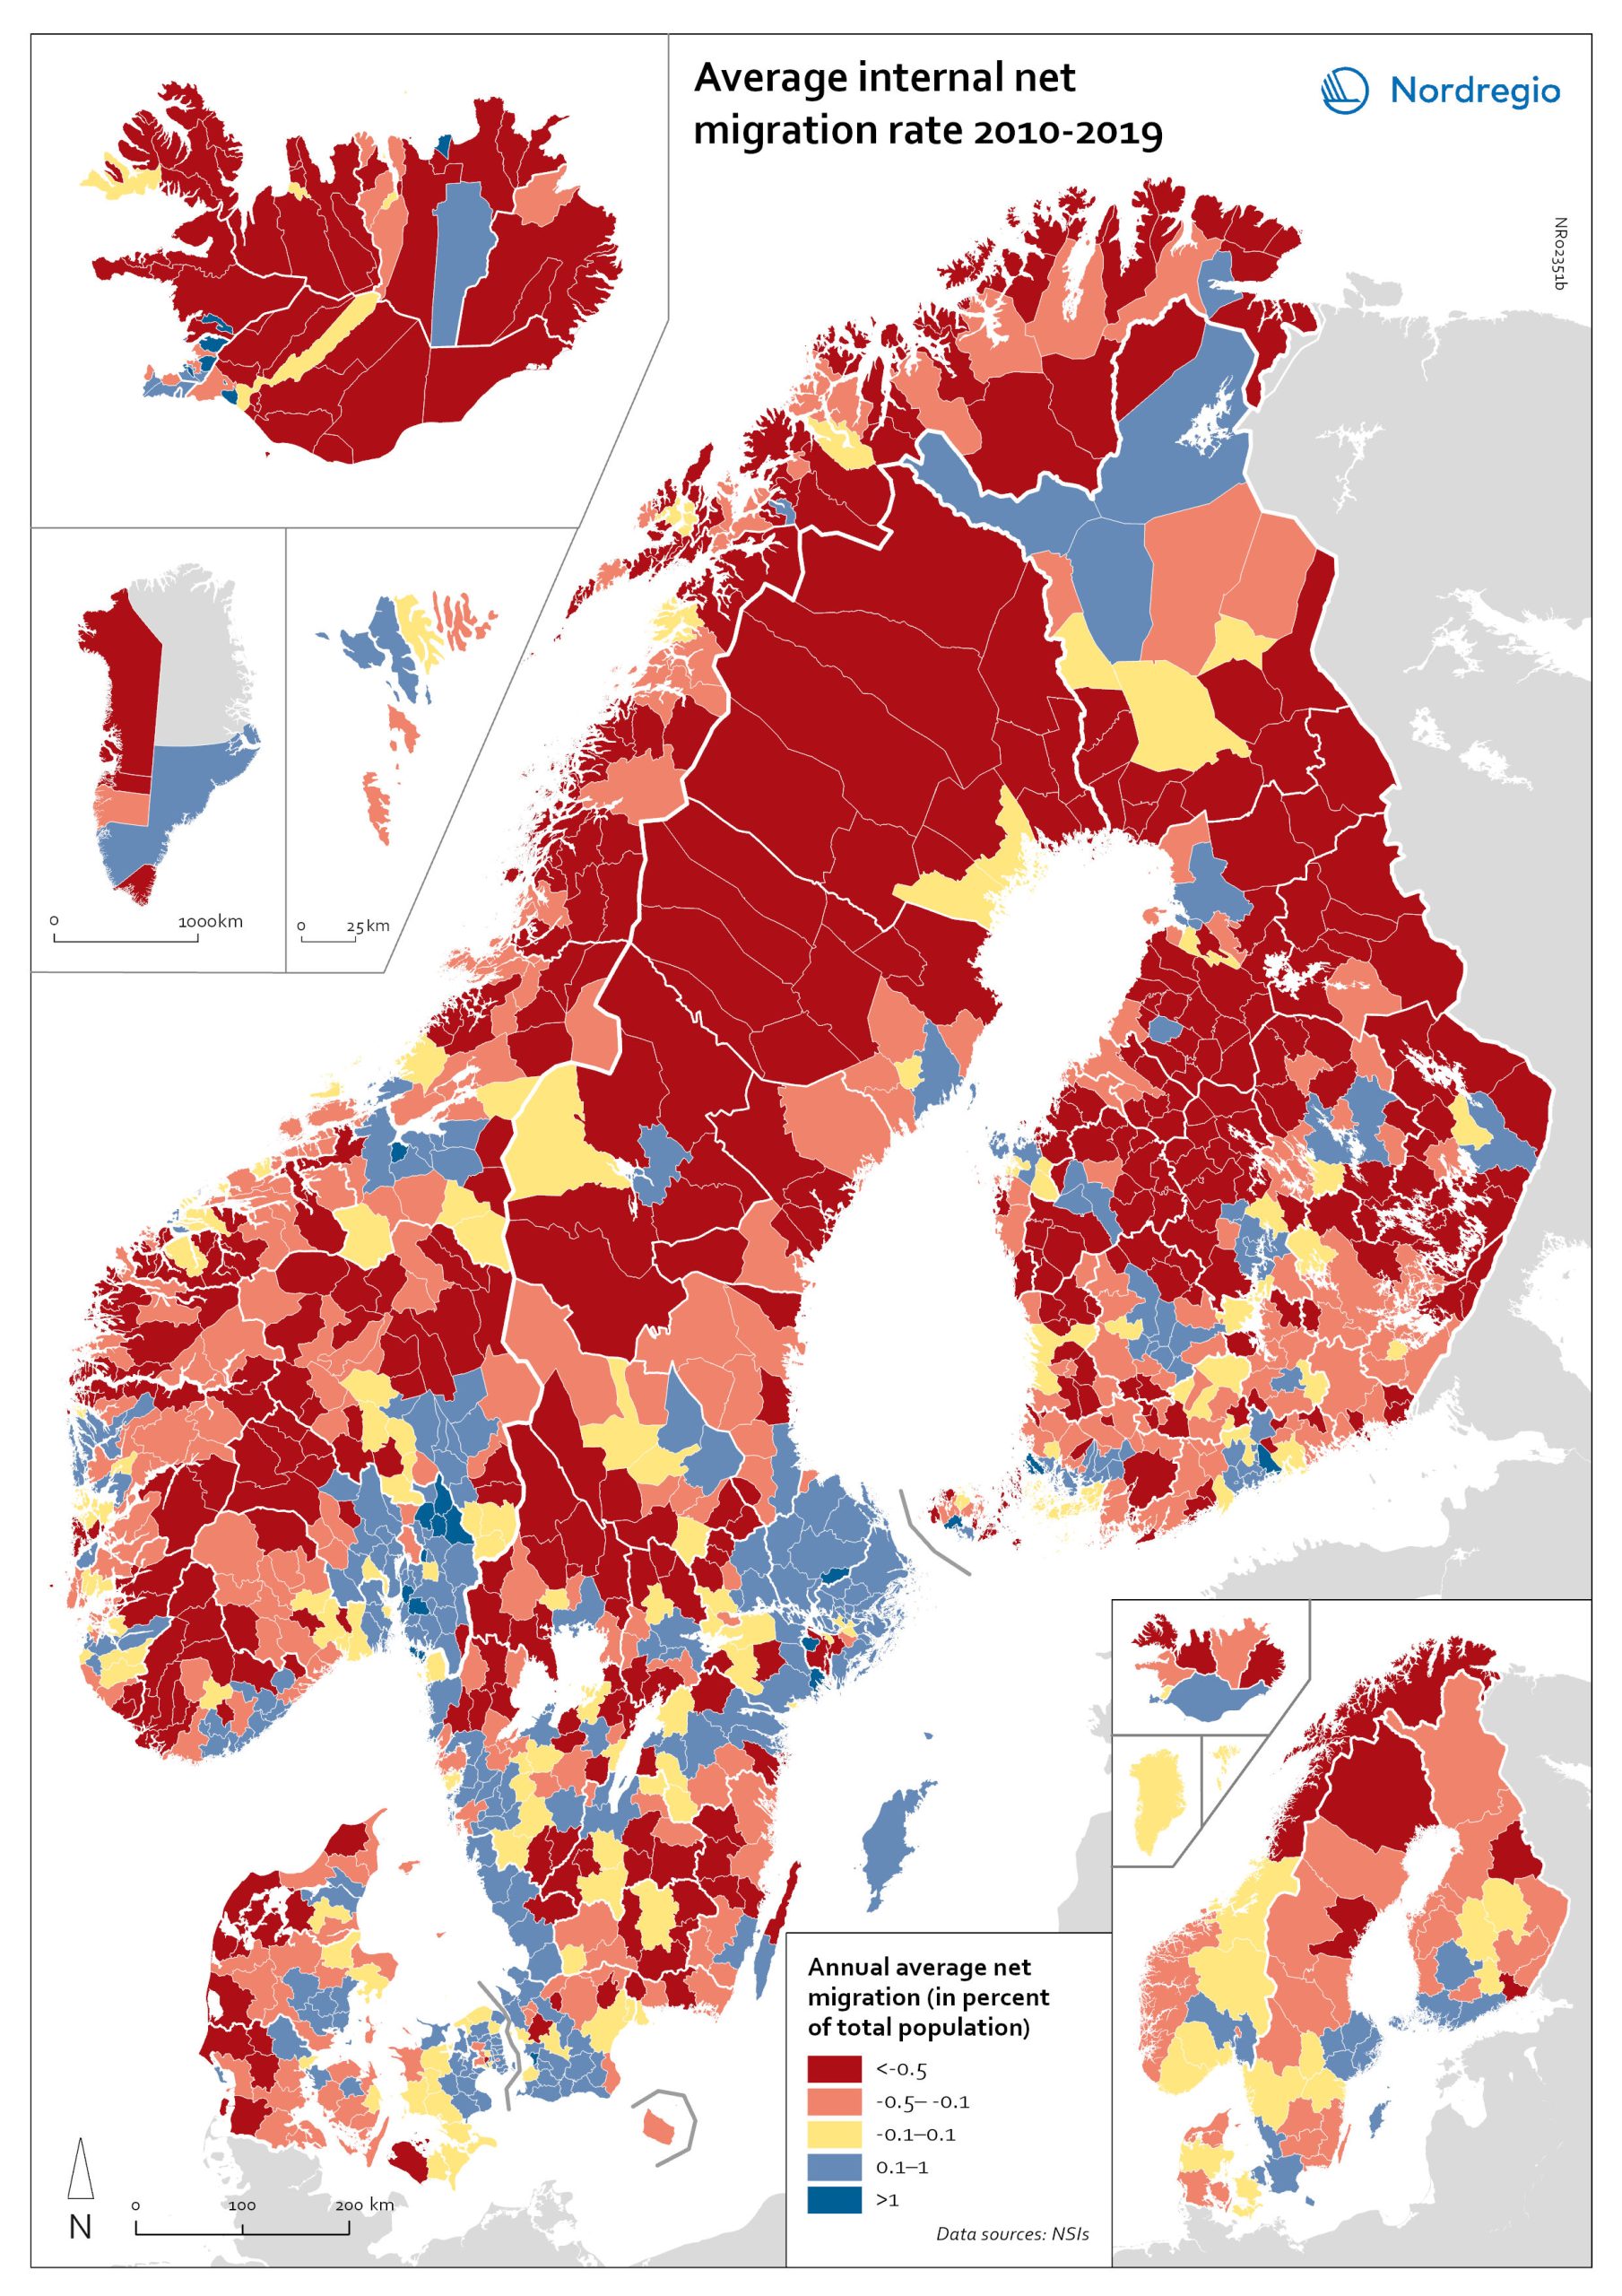
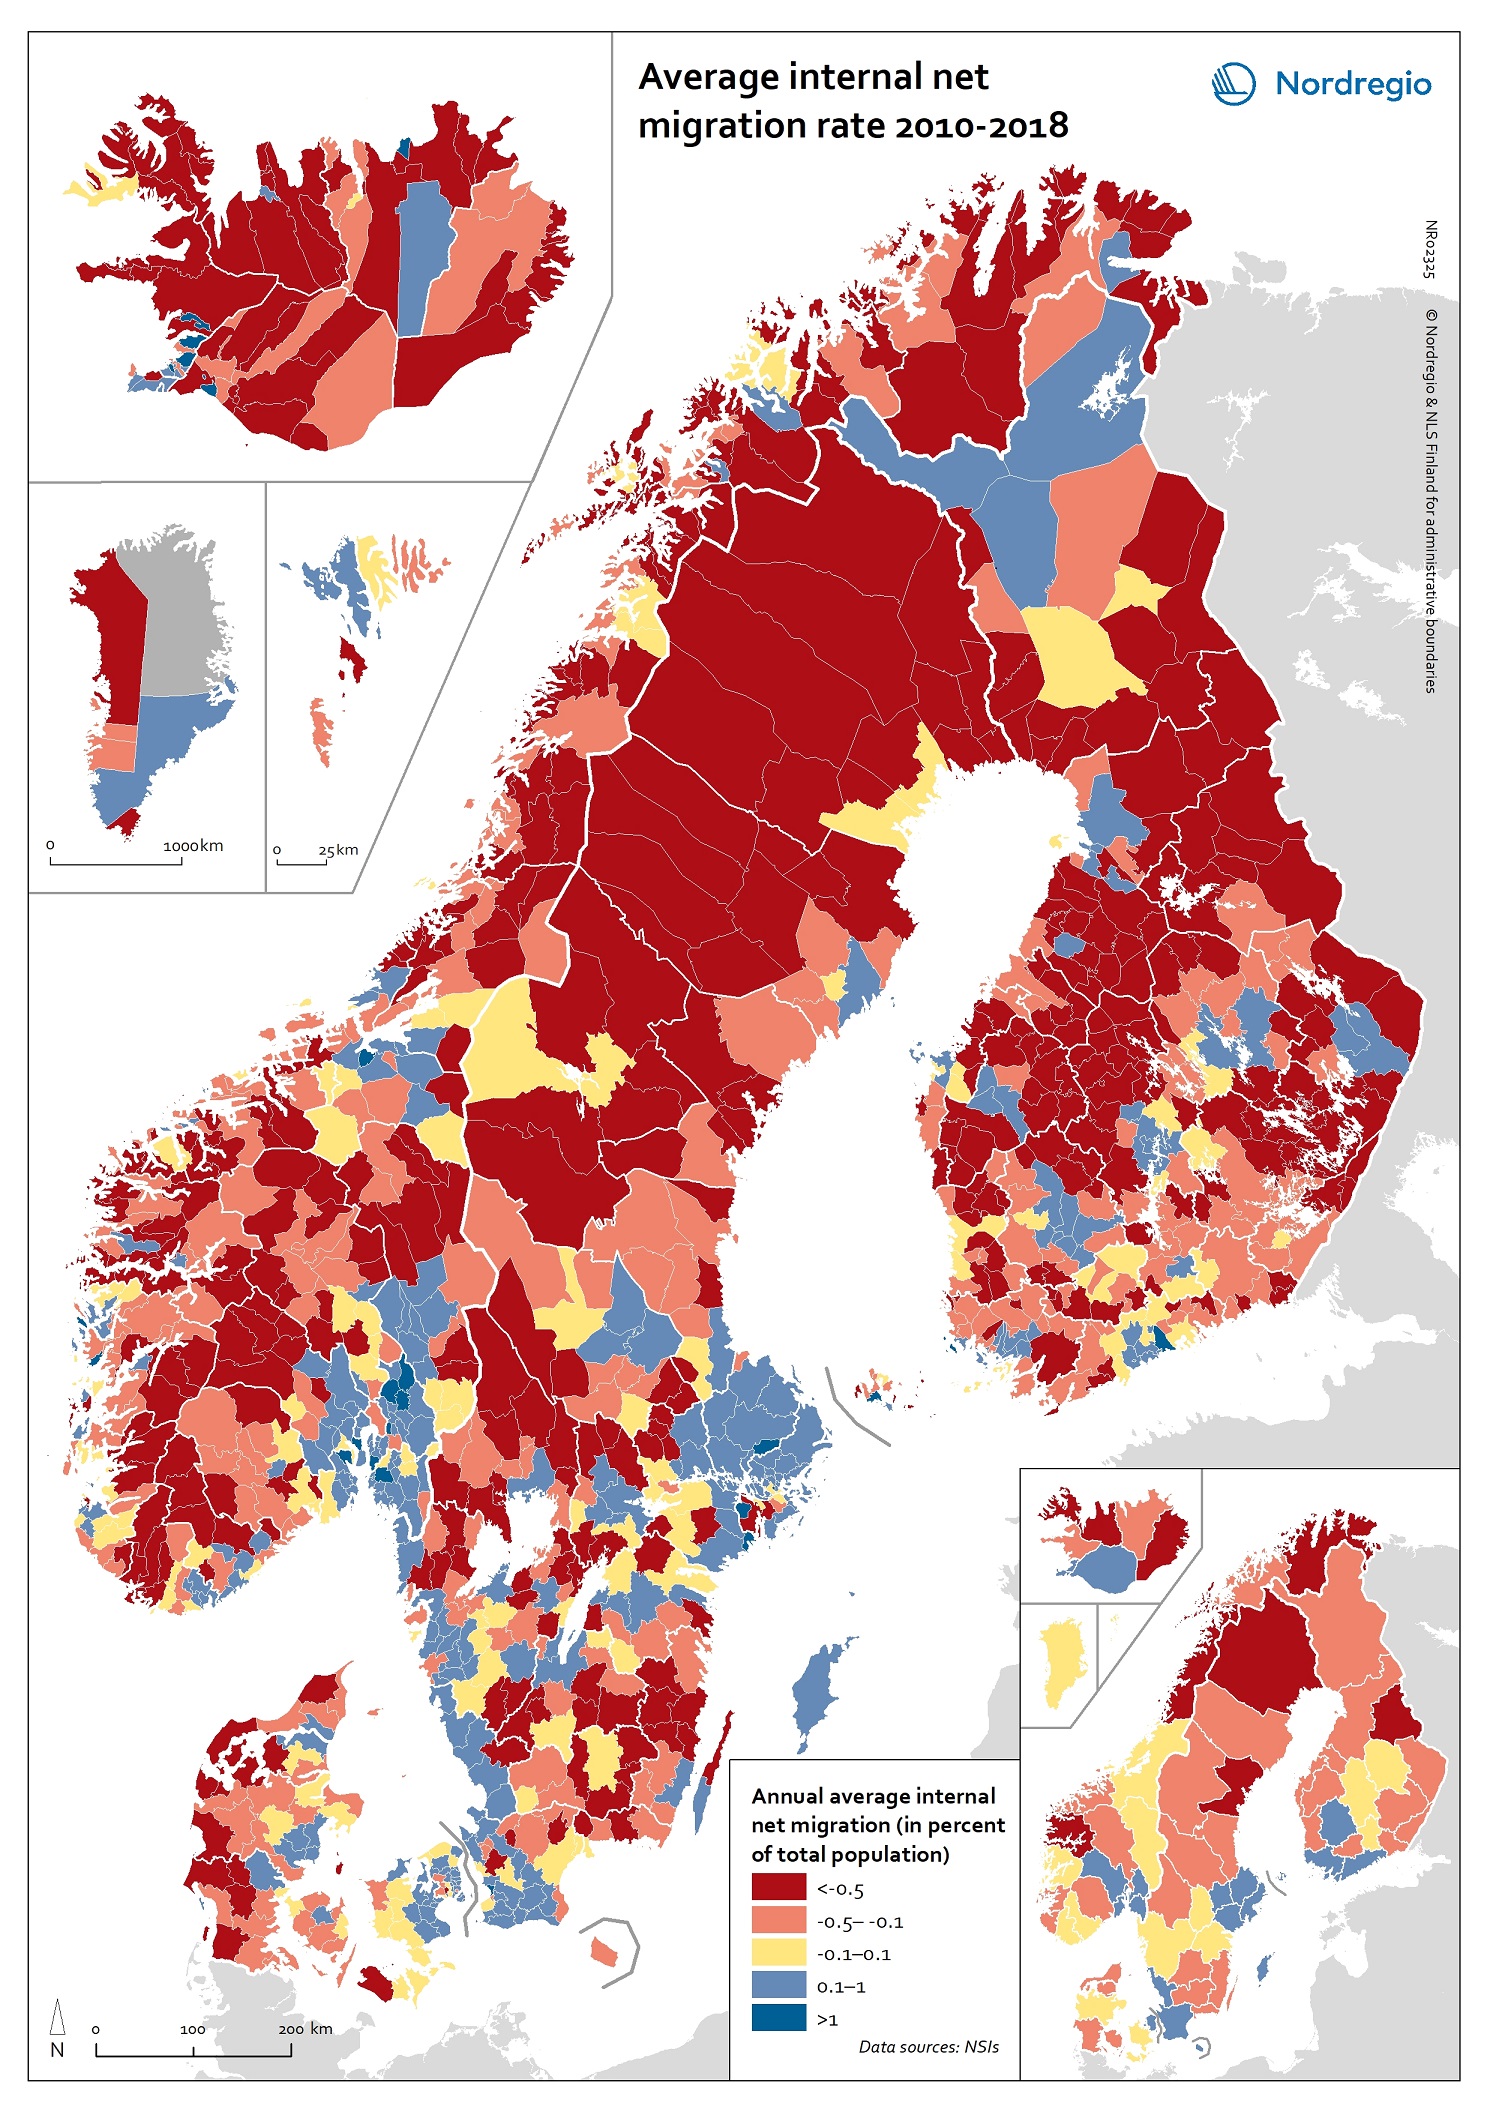
Net internal migration rate, 2010-2019
The map shows the annual average internal net migration in 2010-2019. The map is related to the same map showing net internal migration in 2020. The maps show several interesting patterns, suggesting that there may be an increasing trend towards urban-to-rural countermigration in all the five Nordic countries because of the pandemic. In other words, there are several rural municipalities – both in sparsely populated areas and areas close to major cities – that have experienced considerable increases in internal net migration. In Finland, for instance, there are several municipalities in Lapland that attracted return migrants to a considerable degree in 2020 (e.g., Kolari, Salla, and Savukoski). Swedish municipalities with increasing internal net migration include municipalities in both remote rural regions (e.g., Åre) and municipalities in the vicinity of major cities (e.g., Trosa, Upplands-Bro, Lekeberg, and Österåker). In Iceland, there are several remote municipalities that have experienced a rapid transformation from a strong outflow to an inflow of internal migration (e.g., Ásahreppur, Tálknafjarðarhreppurand, and Fljótsdalshreppur). In Denmark and Norway, there are also several rural municipalities with increasing internal net migration (e.g., Christiansø in Denmark), even if the patterns are somewhat more restrained compared to the other Nordic countries. Interestingly, several municipalities in capital regions are experiencing a steep decrease in internal migration (e.g., Helsinki, Espoo, Copenhagen and Stockholm). At regional level, such decreases are noted in the capital regions of Copenhagen, Reykjavík and Stockholm. At the same time, the rural regions of Jämtland, Kalmar, Sjælland, Nordjylland, Norðurland vestra, Norðurland eystra and Kainuu recorded increases in internal net migration. While some of the evolving patterns of counterurbanisation were noted before 2020 for the 30–40 age group, these trends seem to have been strengthened by the pandemic. In addition to return migration, there may be a larger share of young adults who…
- 2022 March
- Demography
- Migration
- Nordic Region
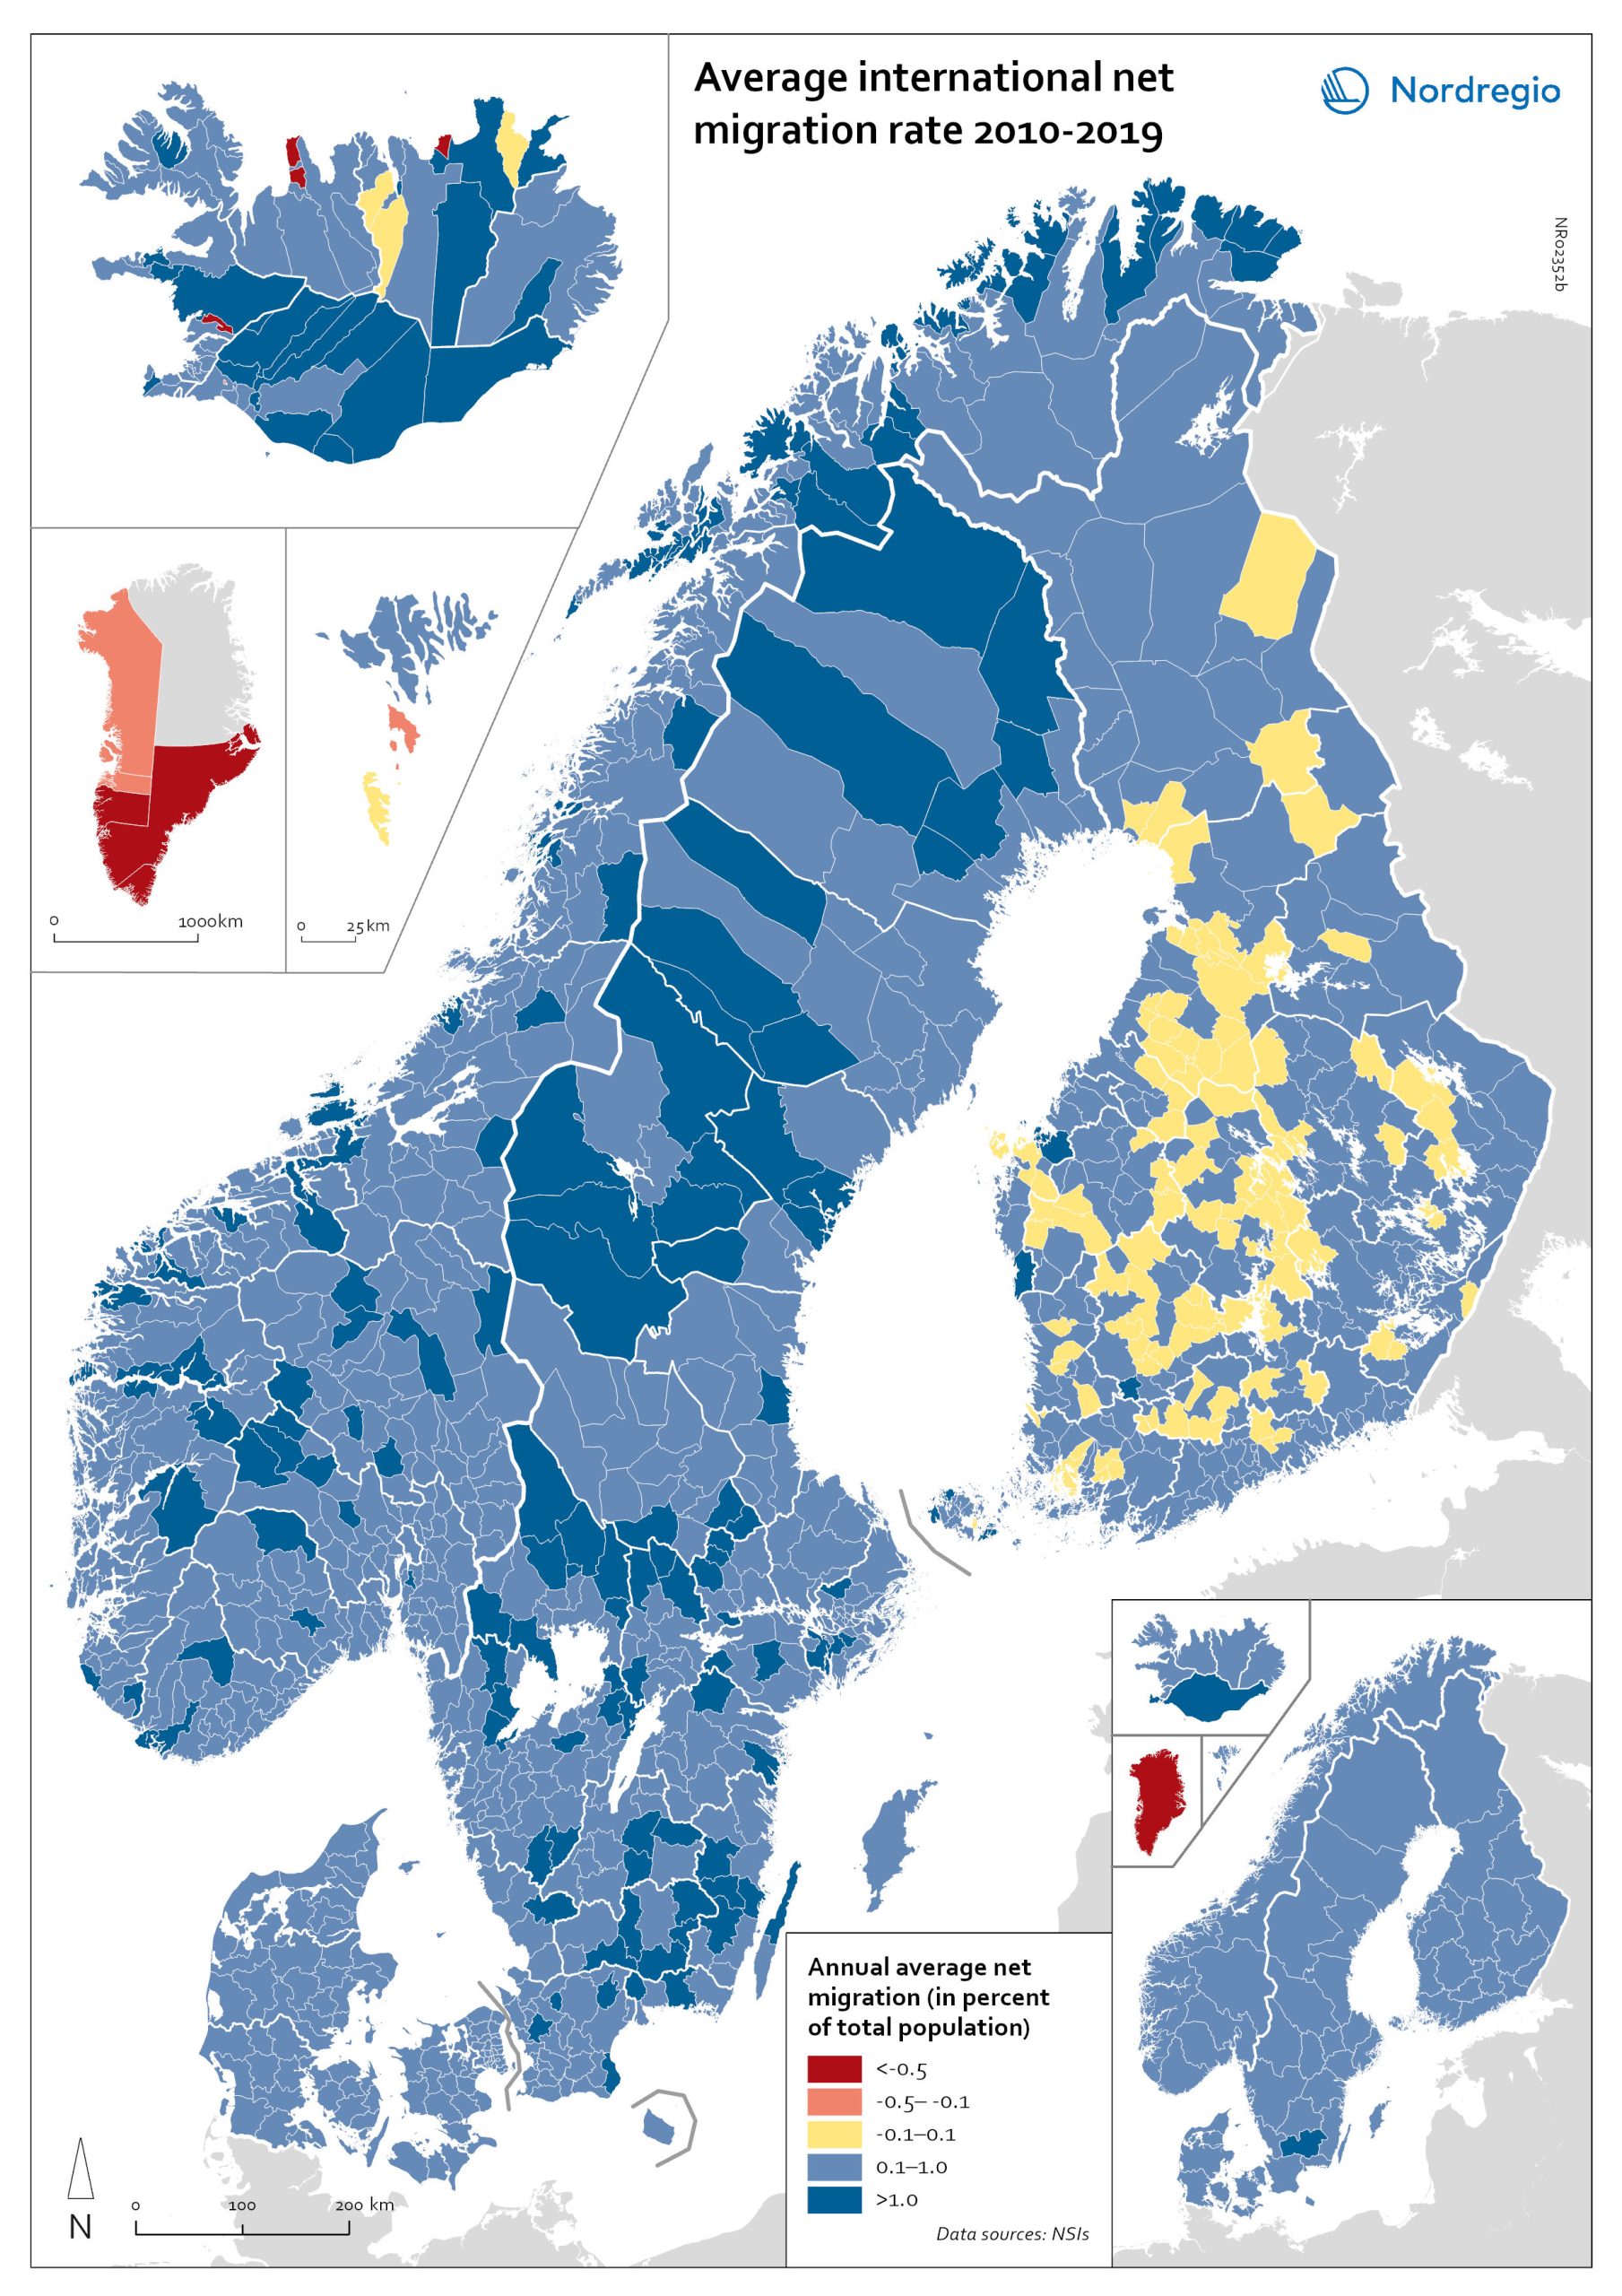
Net international migration rate, 2010–2019
The map shows the annual average international net migration from 2010 to 2019. The map is related to the same map showing net migration in 2020. At regional level, there are only minor changes between the net migration in 2010-2019 and 2020. All regions of Norway, all regions of Sweden except Gotland and Uppsala, and the regions of Österbotten in Finland, Midtjylland in Denmark and Norðurland eystra in Iceland experienced a slight decrease in international net migration I 2020 compared to 2010-2019. There is a more marked increase in net migration in the Faroe Islands, Greenland and the region of Norðurland vestra in Iceland, and a slight increase in the region of Austurland in Iceland. At municipal level, the maps show more changing patterns. In Denmark, Norway and Sweden, several municipalities – both in the capital, intermediate, and rural regions – had lower levels of international net migration in 2020 compared to 2010-2019. In Iceland and Finland, the picture is more balanced, with some municipalities showing a decrease, others an increase. In the Faroe Islands and Greenland, several municipalities/regions had an increase in international net migration.
- 2022 March
- Demography
- Migration
- Nordic Region
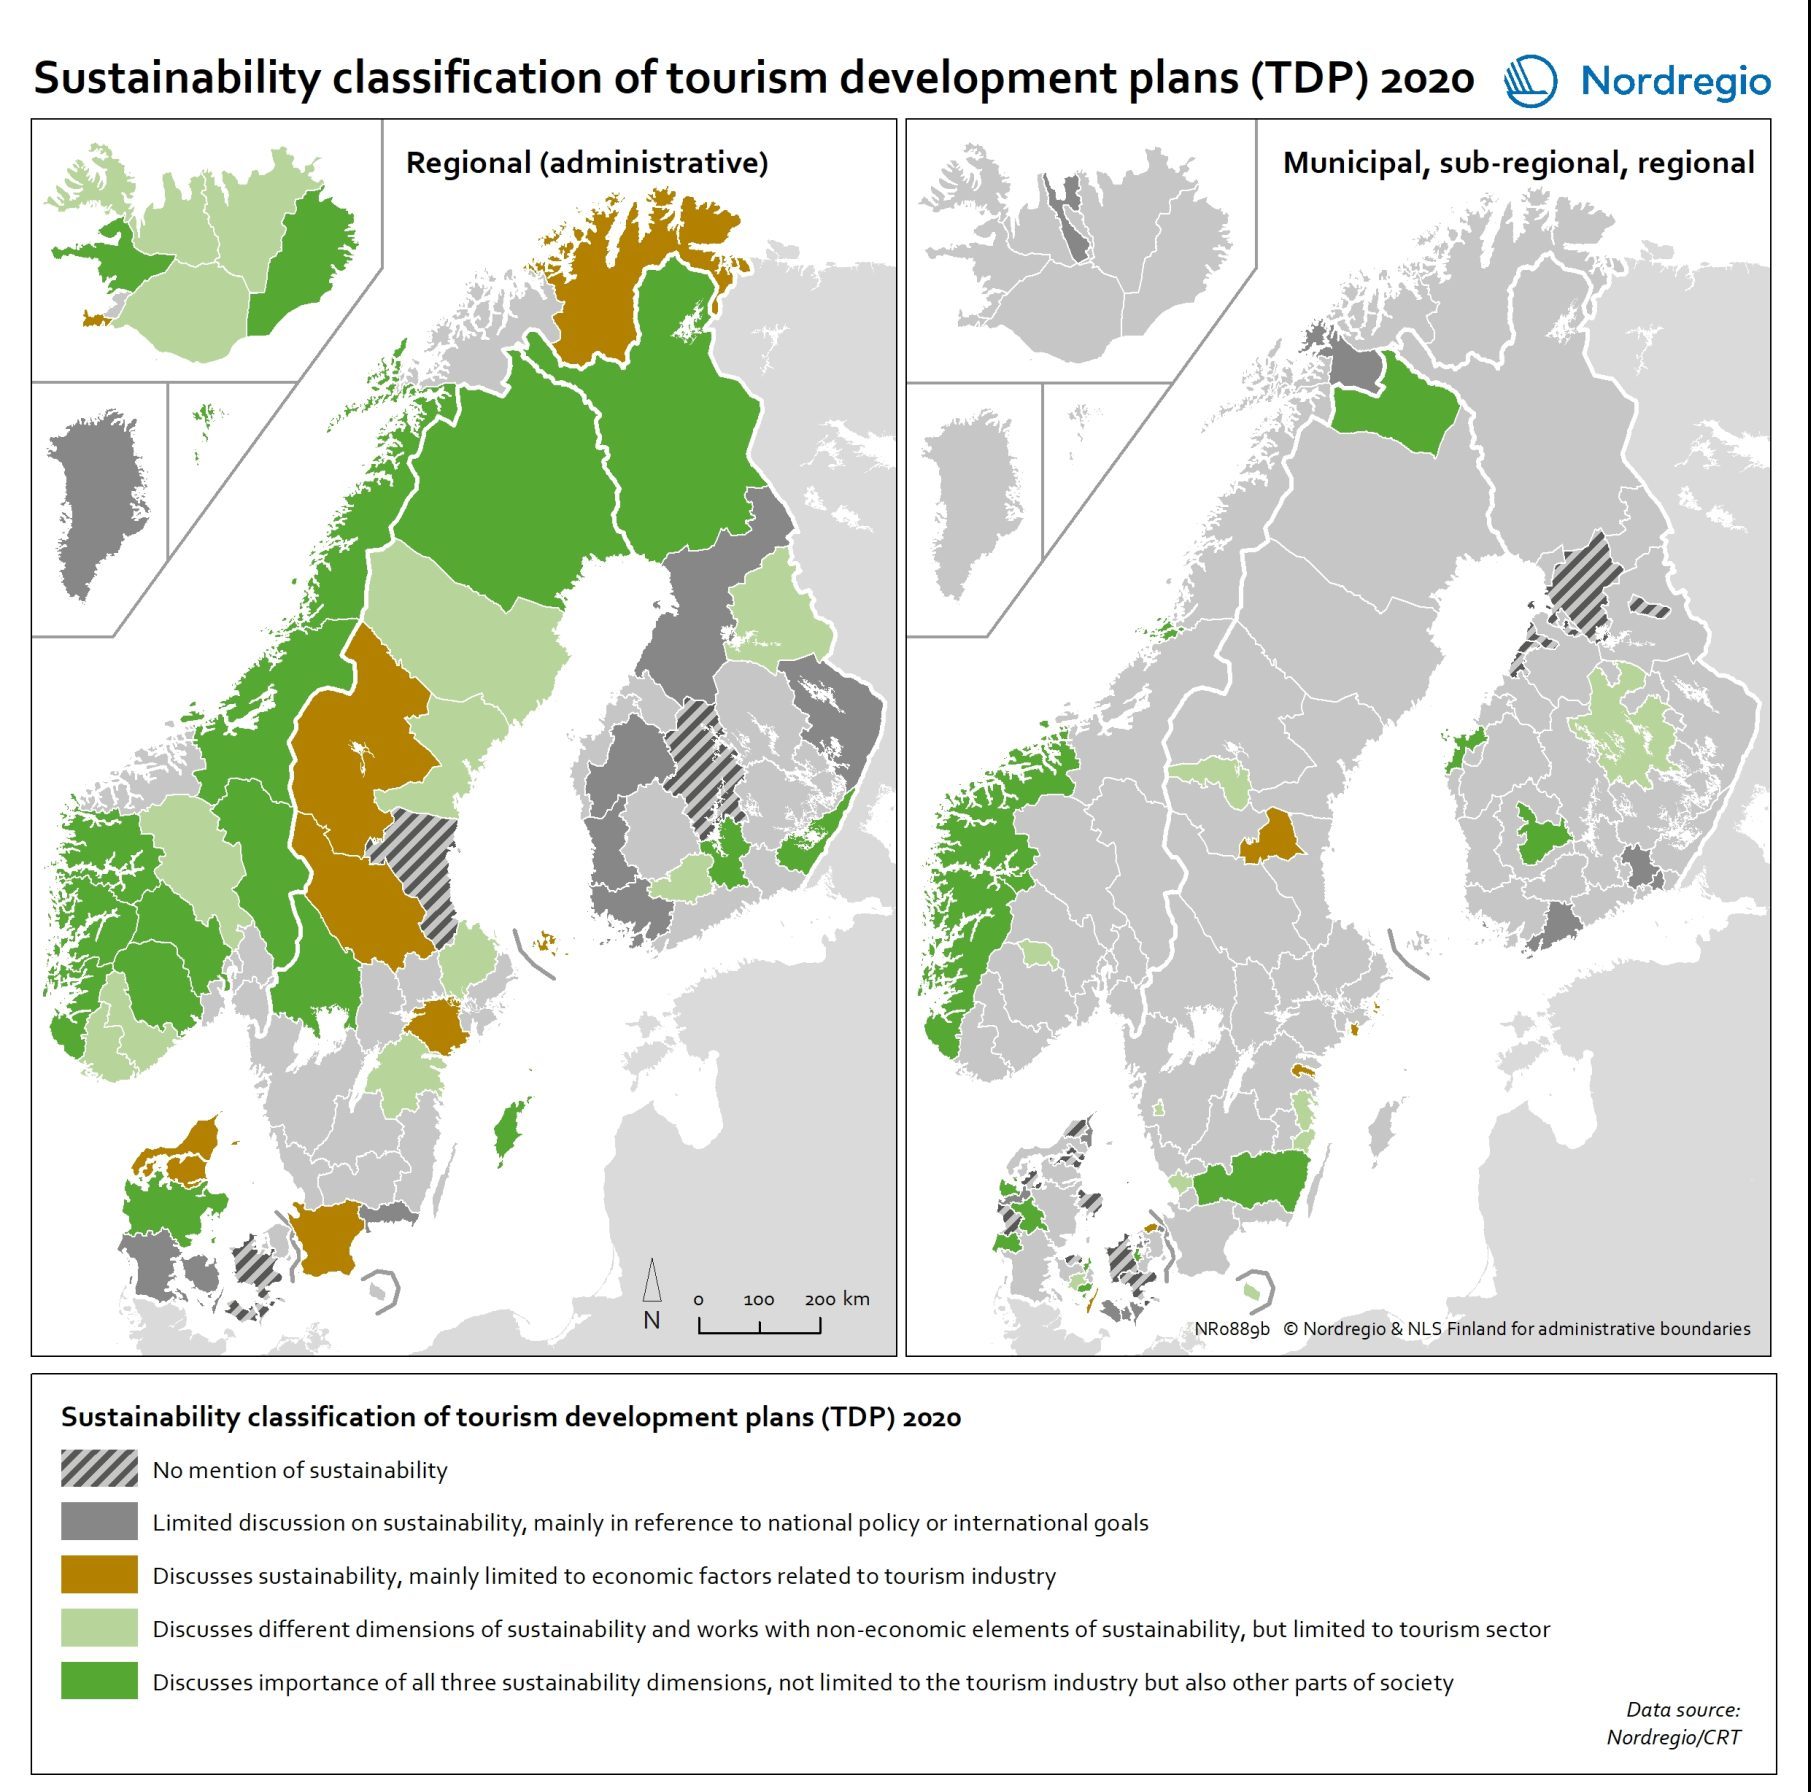
Sustainability classification of tourism development plans (TDPs)
This map indicates the distribution of different TDP sustainability concern treatment classes in the Nordic Region in 2020 Sustainability is seen as an important part of the tourism development in large parts of the Nordic rural regions, at least on paper. Some tourism policies even state it as the point of departure, the light that guides the way in everything that tourism involves. A growing public awareness of the need to transition to more sustainable practices, increased public pressure, along with political statements and commitments to do so, means that we should expect to find sustainability concerns and the SDGs strongly reflected in sub-national plans for tourism development, too. In this map, the dotted areas represent those TDPs that do not mention sustainability in any way. These mainly come from Denmark, as well as a few from Finland, Norway, and Sweden. The grey areas represent TDPs who mention the concept of sustainability, but in a very limited way, as a reference to an overall, global or international or national agenda, but without further operationalising or setting any goals regarding this for the local context. This type of treatment of sustainability concerns is mainly present in Finland, followed by Denmark and Sweden, plus a few cases from Norway and Iceland. Together, these two types represent almost two out of every five TDPs. They greyish green areas represent those TDPs which limit their discussion of sustainability to the economic sustainability of tourism businesses. This type of TDP is mainly found in Sweden, followed by Denmark, and then a case from each from Finland, Norway and Iceland. The green areas, which represent just under half of the TDPs, engage in a holistic treatment of sustainability concerns, including their economic, social and environmental aspects. The light green TDPs, with a tourism-centred sustainability treatment, come…
- 2021 December
- Nordic Region
- Tourism
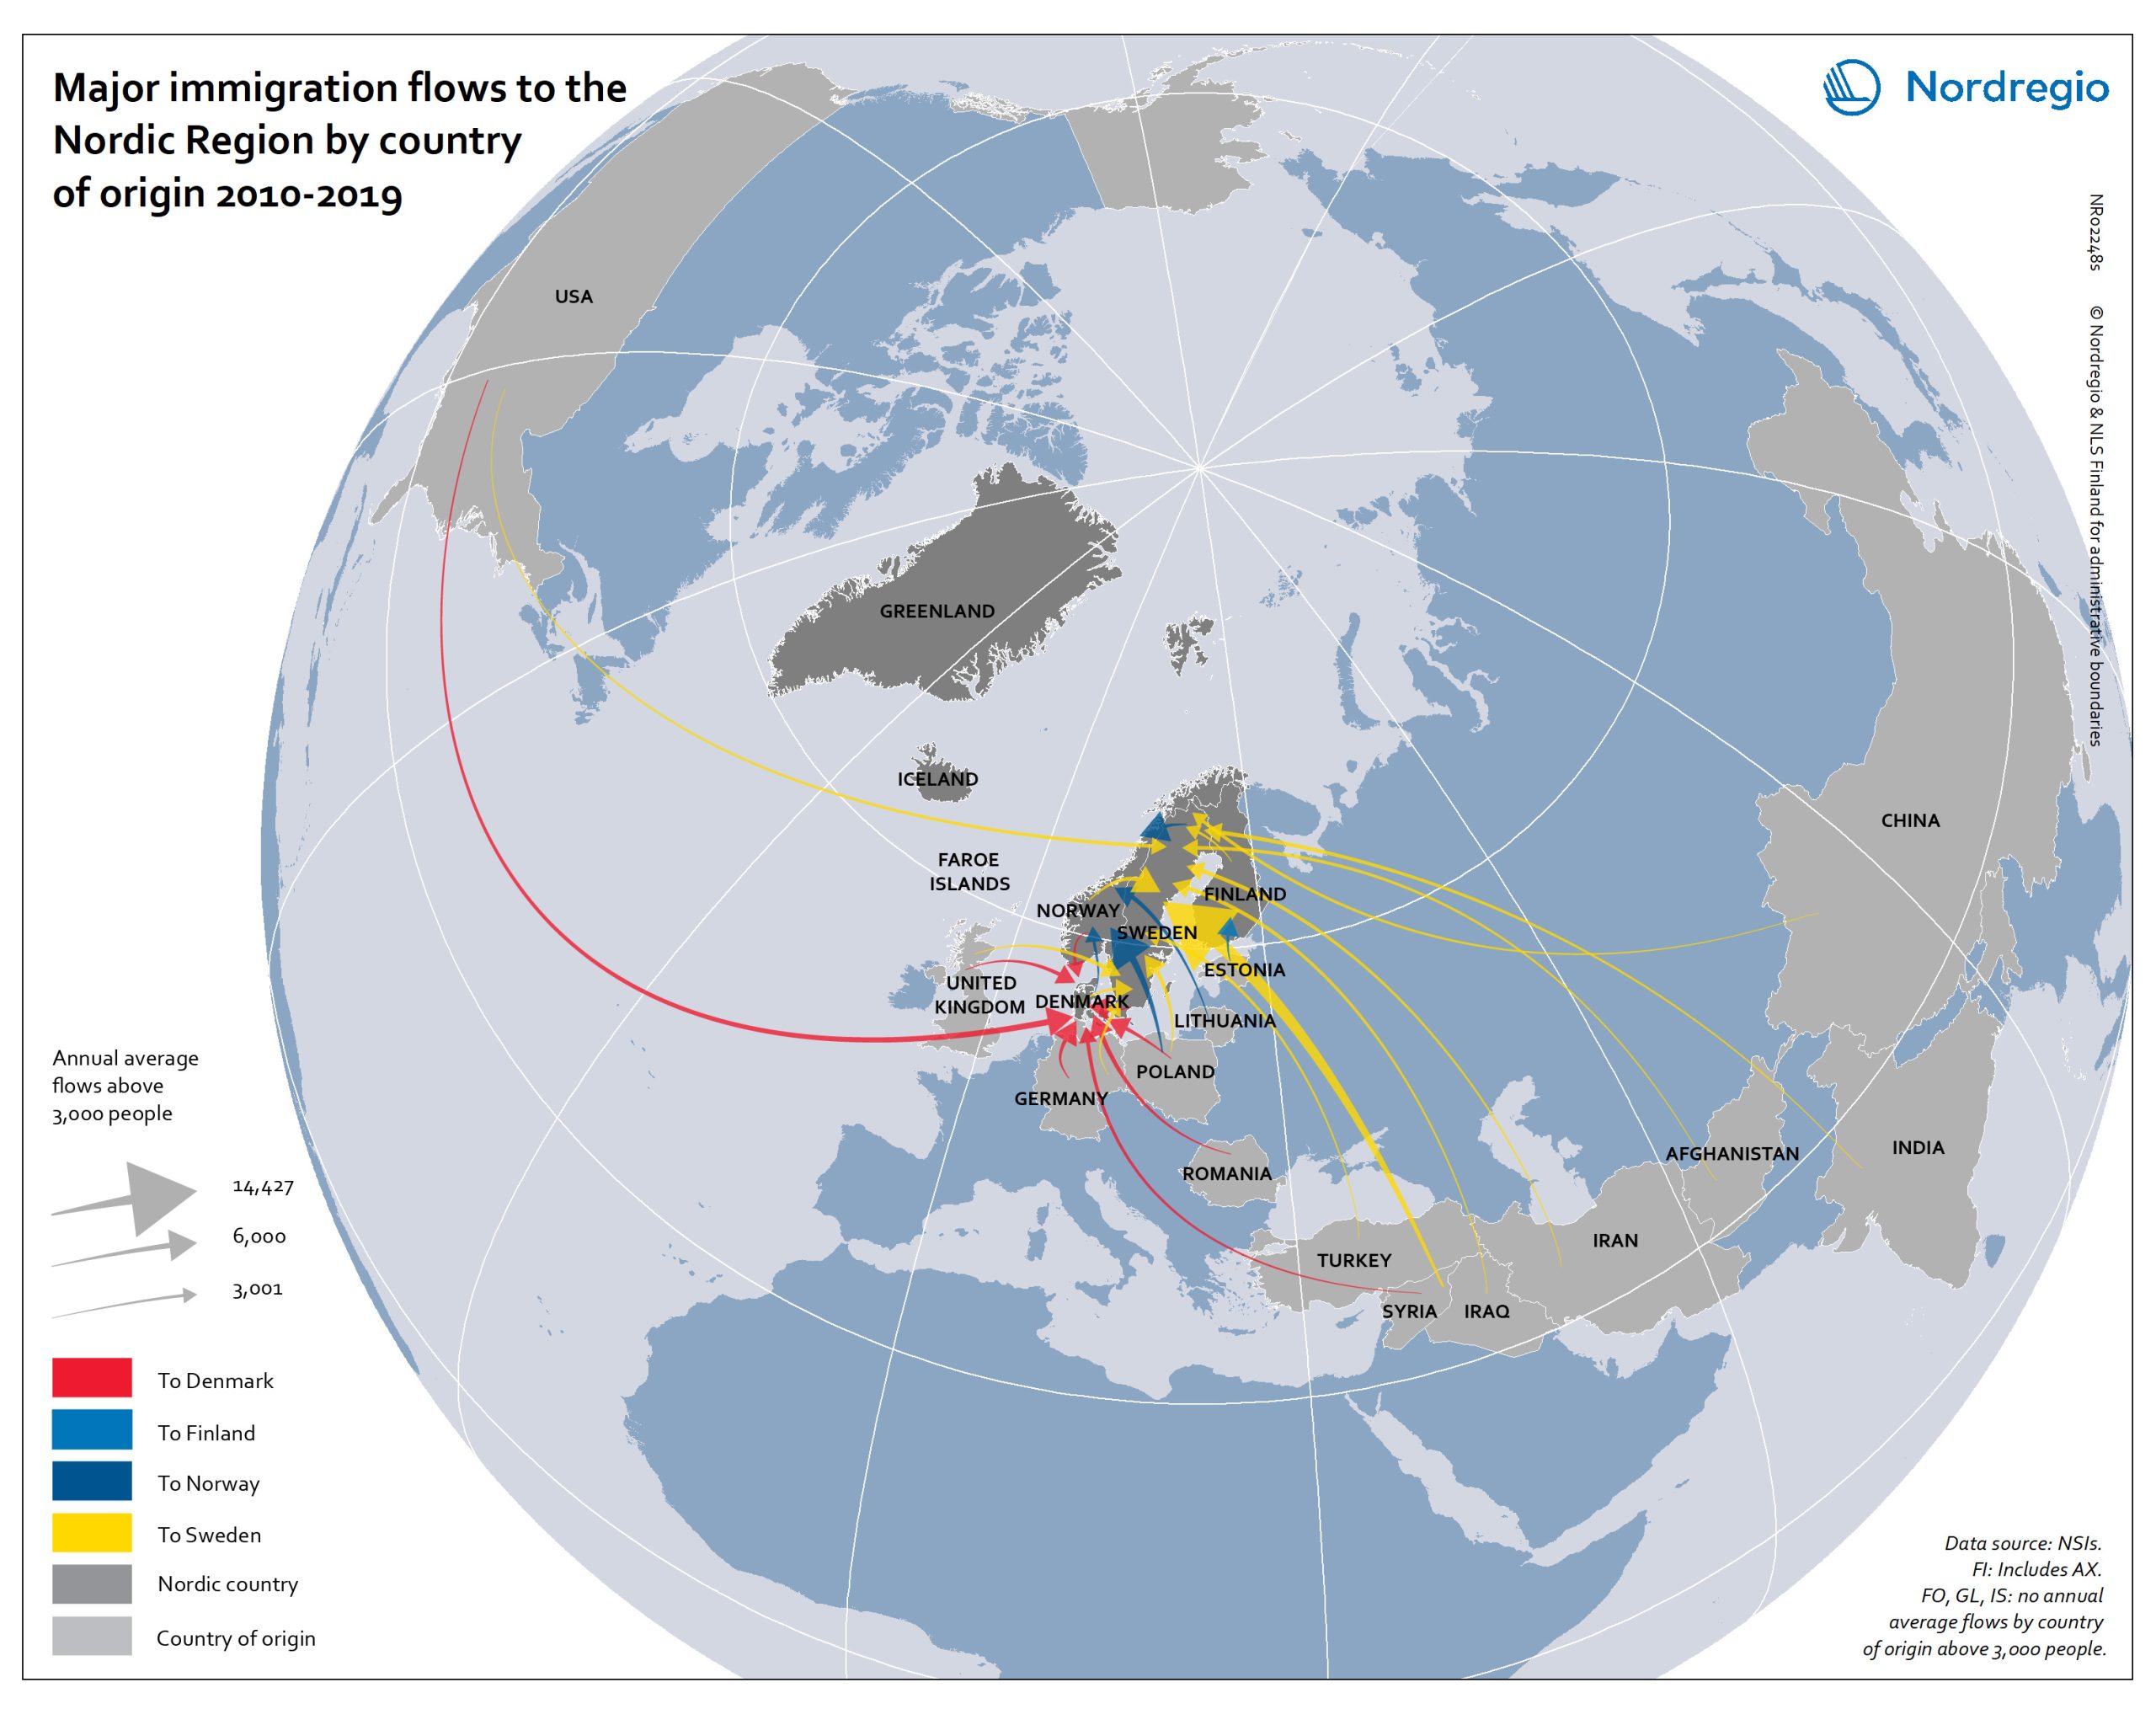
Major immigration flows to the Nordic Region from 2010 to 2019
The map shows annual average immigration flows above 3,000 people, and the growing diversity in their countries of origin Sweden and Denmark, in particular, experienced large inflows from non-Nordic countries during the period 2010-2019, with Sweden standing out as the Nordic country with by far the largest immigrant in-flows. A large portion of these arrivals were from war-torn Syria (an annual average of almost 15,000), followed by Poland (approximately 4,500), United Kingdom, Iraq, India and Iran (around 4,000 each). Denmark experienced a smaller number of inflows above 3,000 people, compared to Sweden. The largest non-Nordic inflows to Denmark were around 5,000 people (per sending country) and included migrants from the U.S., Germany, Romania and Poland. For Norway, large non-Nordic in-flows were limited to Lithuania and Poland. Similarly, Finland had only one major inflow, from Estonia.
- 2021 December
- Migration
- Nordic Region
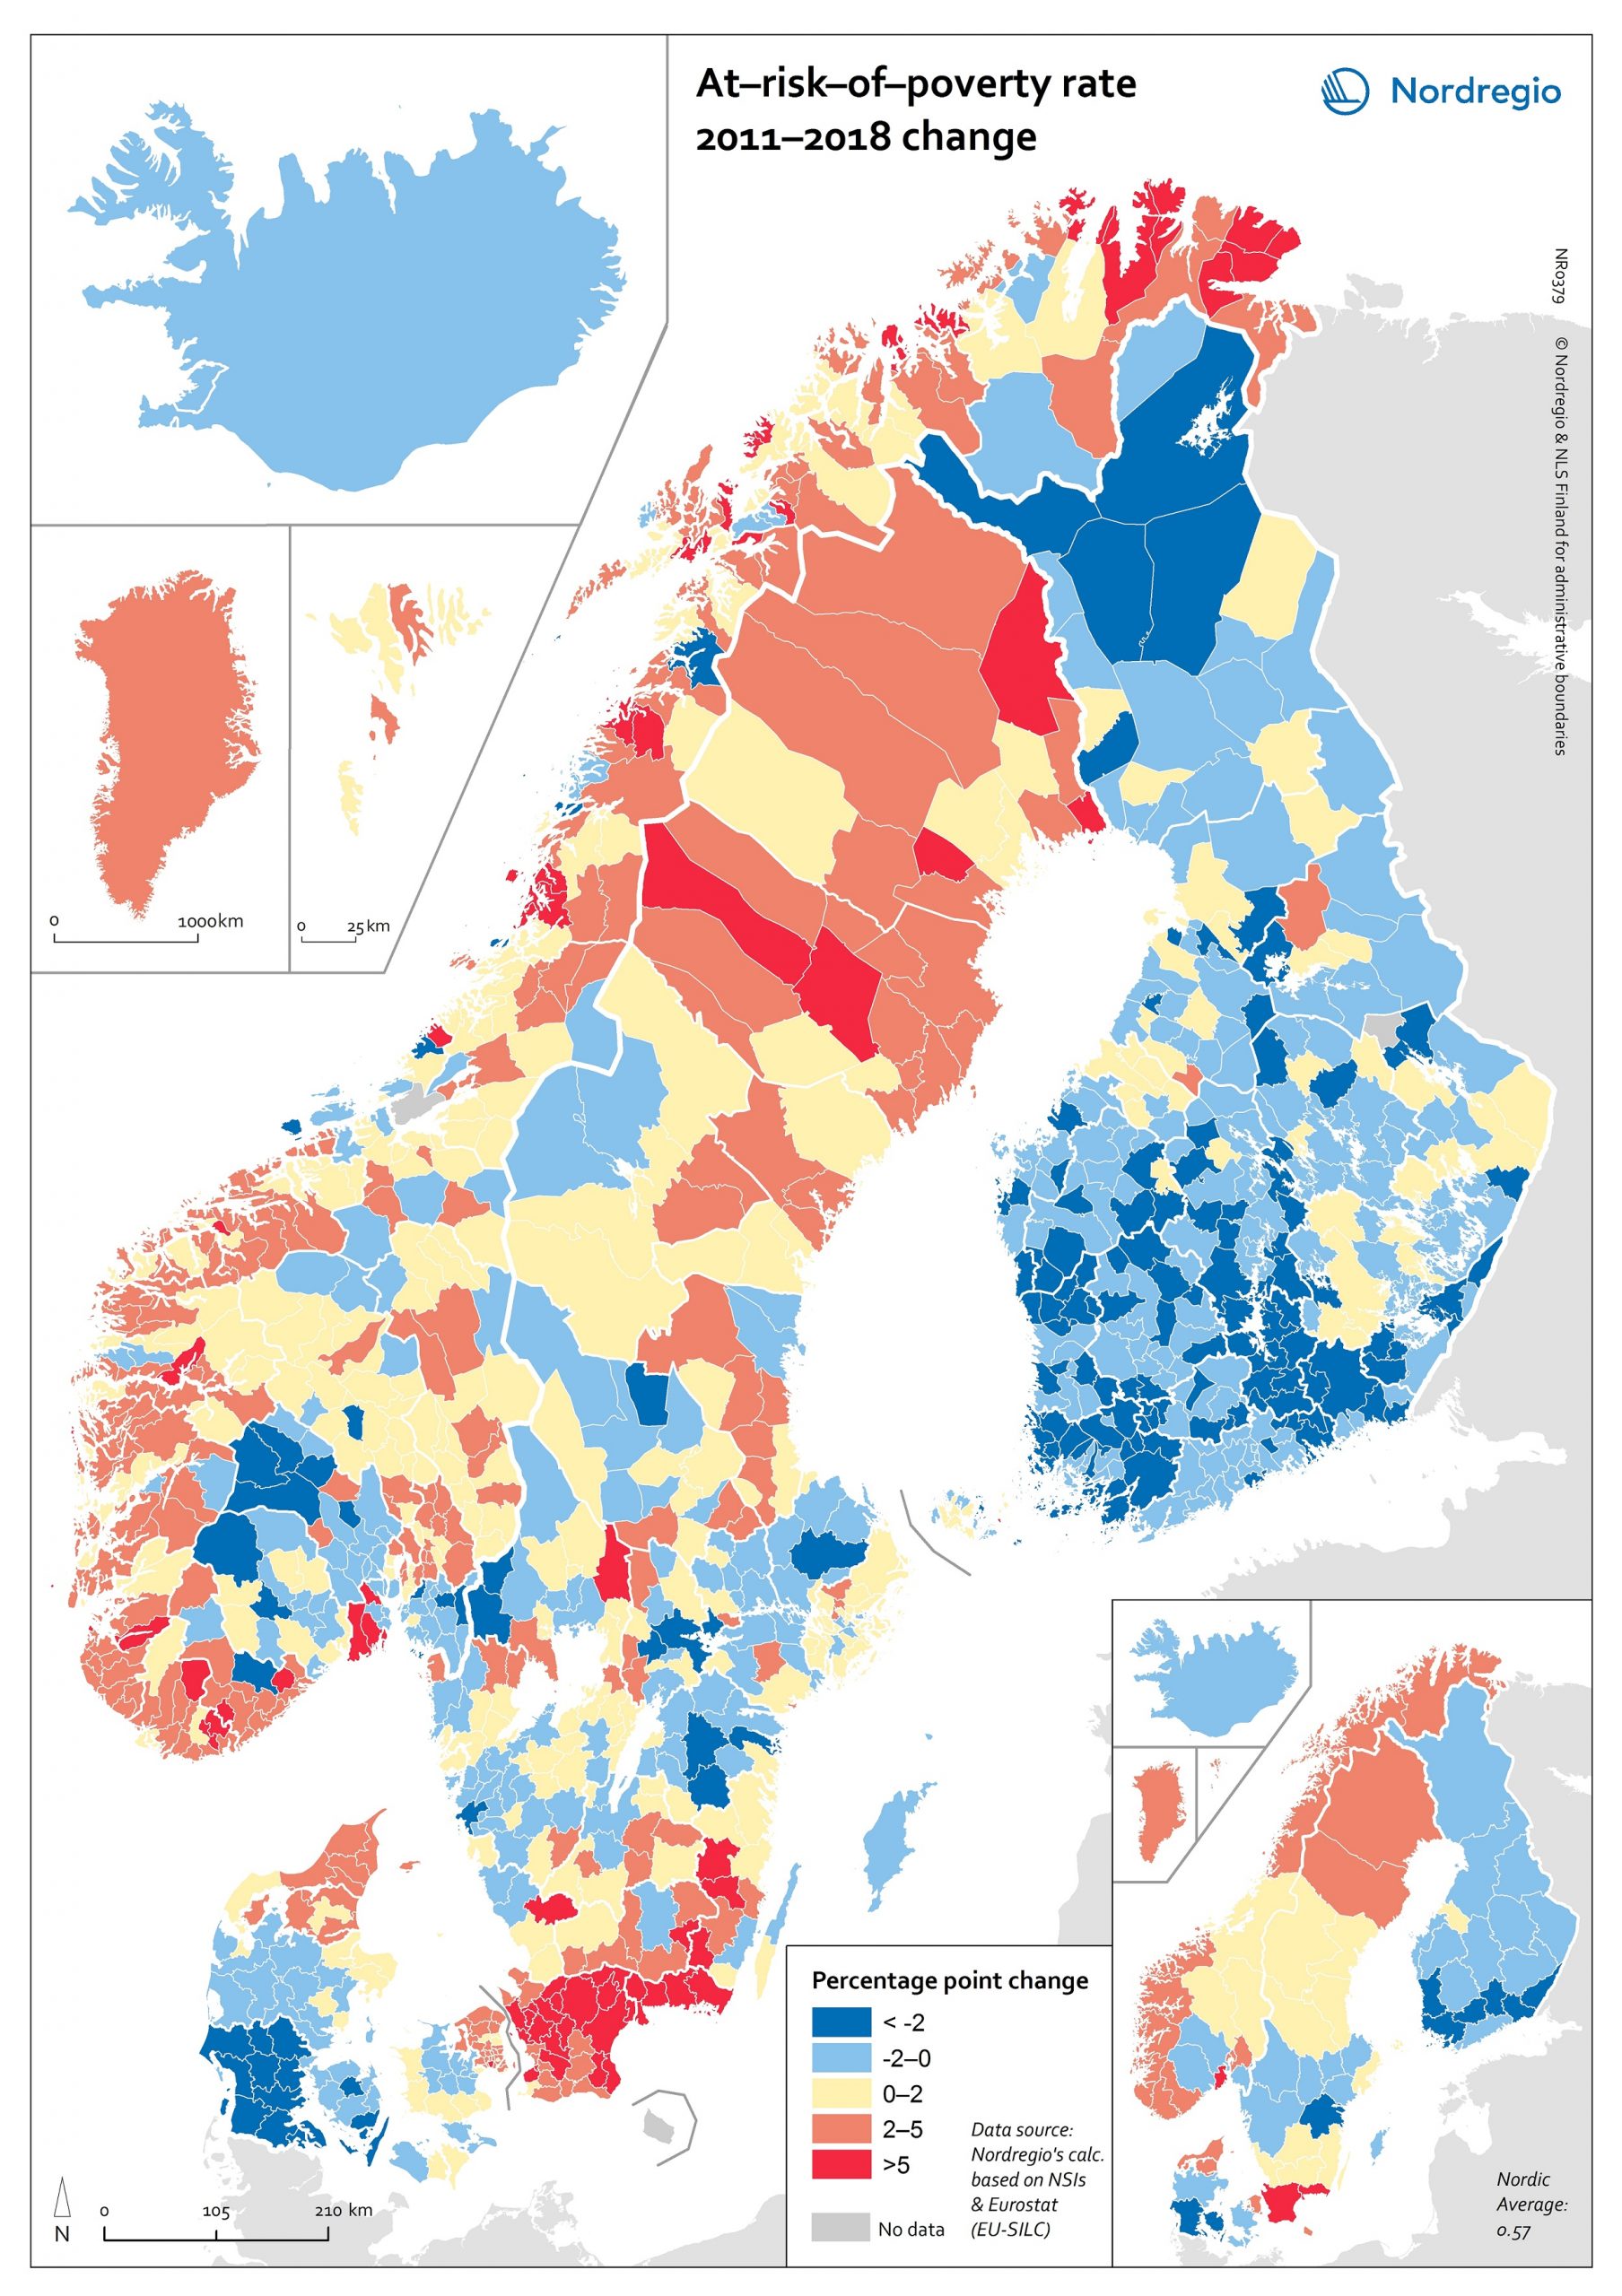
At-risk-of-poverty rate 2011-2018 change
The map shows the “at-risk-of-poverty” (AROP) rate in the Nordic Region. For the period from 2004 to 2018, the AROP rate increased in all Nordic countries except Iceland. This trend was strongest in Sweden. In Finland the AROP rate has been decreasing during the past few years, in line with what has previously been indicated – namely, on account of economic turmoil. This points to one of the weaknesses of using the AROP rate alongside several other measures of inequality. That is, while people have become poorer due to the economic crisis, the at-risk-of-poverty rate has paradoxically gone down. In addition, the AROP rate for Finland is higher in 2018 than it was in 2004. Looking at these trends on a regional level over a period of time (between 2011 and 2018), we can see that the AROP rate has decreased in almost all areas of Finland, whereas the pattern is rath er more varied in the other Nordic countries (we can also see a cohesive area in the south of Denmark where the AROP rate has decreased.) Again, Sweden has the most regions displaying increases in the AROP rate. Finland and Sweden contain the largest differences between the regions with the highest and lowest AROP rate. Hence the greatest regional differences are to be found in Sweden and Finland. Sweden also has the highest average AROP rate. About the At-risk-of-poverty The at-risk-of-poverty rate is a common measure of relative poverty and social inclusion. Most notably, it has been used for monitoring the EU2020 goal of inclusive growth. The at-risk-of-poverty rate is normally defined as “the share of people with an equivalised disposable income (after social transfer) below the at-risk-of-poverty threshold, which is set at 60% of the national median equivalised disposable income after social transfer.” (Eurostat). The indicator is…
- 2020 October
- Demography
- Economy
- Nordic Region
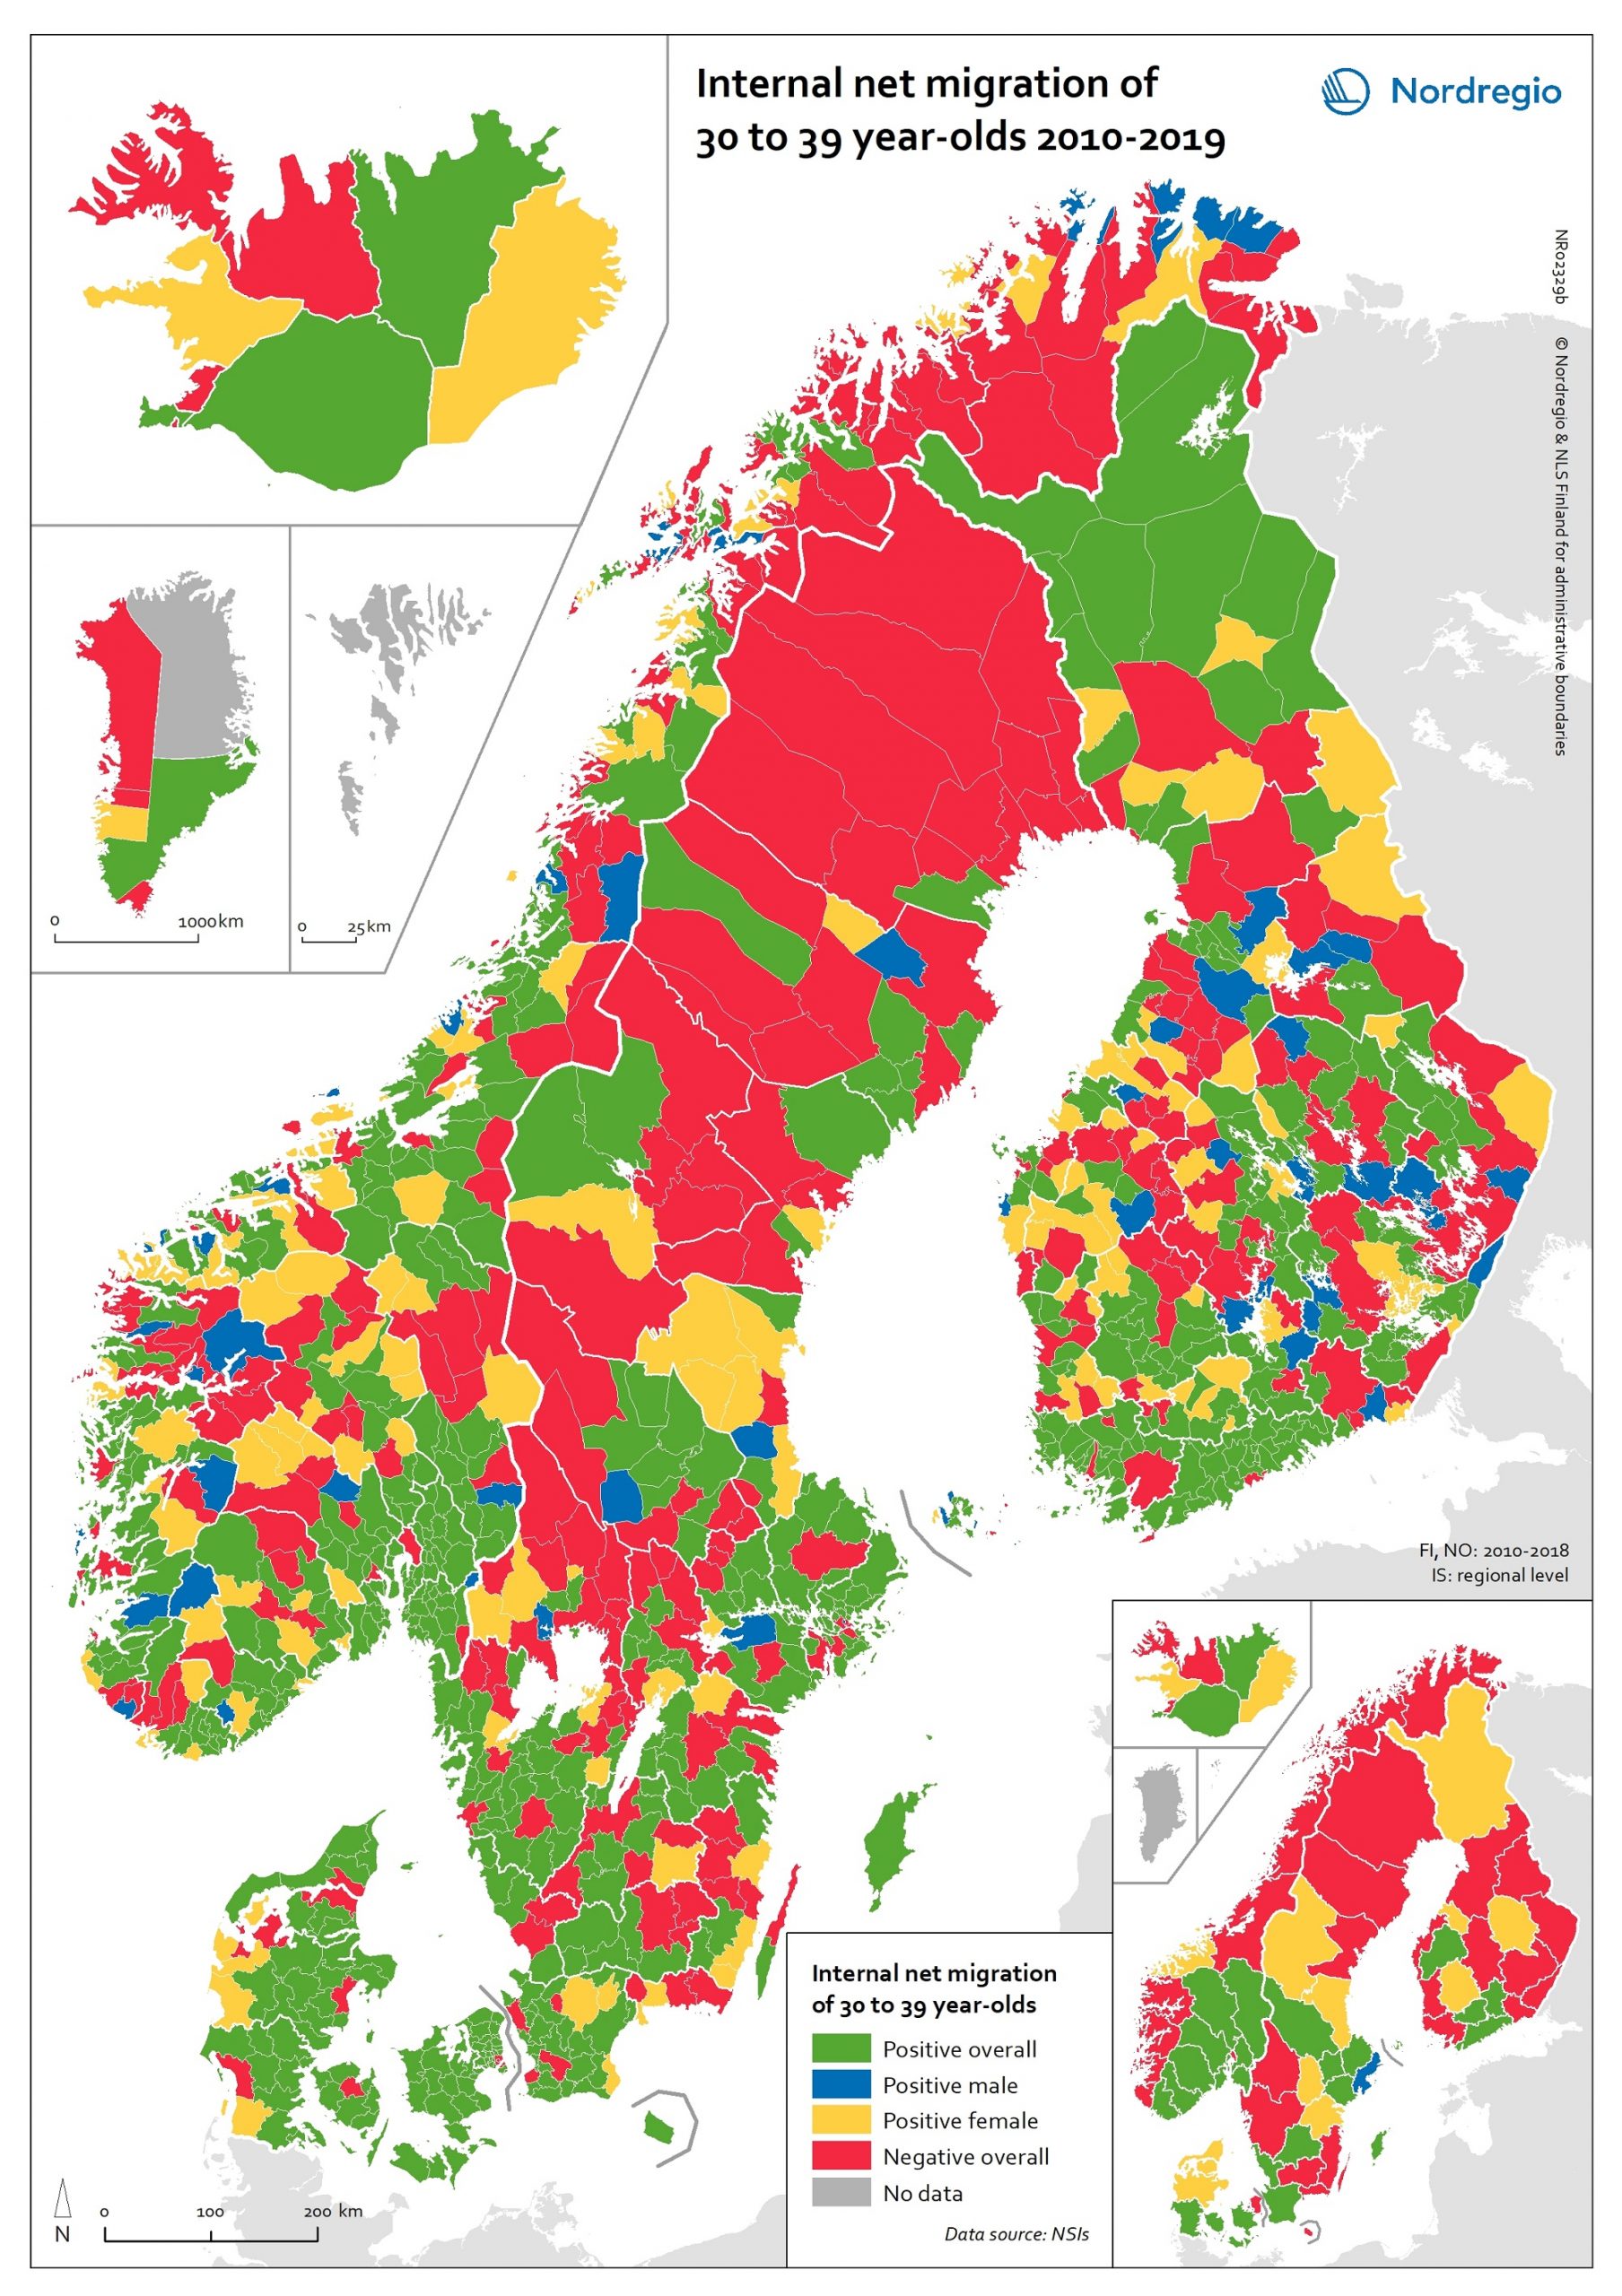
Internal net migration of 30 to 39 years-of-age, by gender, in 2010-2019
This map shows a typology that divides the Nordic municipalities and regions into four migration categories: positive net migration for both males and females (green on the map), positive male net migration (blue on the map), positive female net migration (yellow on the map), and negative net migration for both males and females (red on the map). These migration flows on 30 to 39-year-olds are of particular interest since it is often assumed that the future of rural regions is dependent upon their capability both to retain their populations and to attract newcomers, returning residents and second home owners. In this context, the map provides a rather positive picture, because a considerable proportion of rural municipalities have experienced positive net migration among females, males, or both sexes across all the Nordic countries. Even so, there is negative net migration among both females and males in many municipalities in northern Sweden, north-eastern Norway and eastern Finland, in addition to several inland municipalities within these countries. Interestingly, there is negative net migration among both sexes across all the capital city municipalities of the Nordic Region. According to the regional map, the capital city regions of Denmark, Iceland and Norway all experienced negative net migration of young people aged 30-39 years between 2010 and 2019. The capital city region of Sweden experienced positive net migration of males and negative net migration of females while the capital city region of Finland experienced positive net migration overall. Despite the majority of peripheral regions experiencing negative net migration of 30 to 39-year-olds during the time period studied, there are also several interesting examples of rural regions which experienced positive female net migration, for example Nordjylland (Denmark), Pohjois-Savo (Finland), Austurland (Iceland), Møre og Romsdal (Norway), and Jämtland (Sweden).
- 2020 October
- Demography
- Migration
- Nordic Region
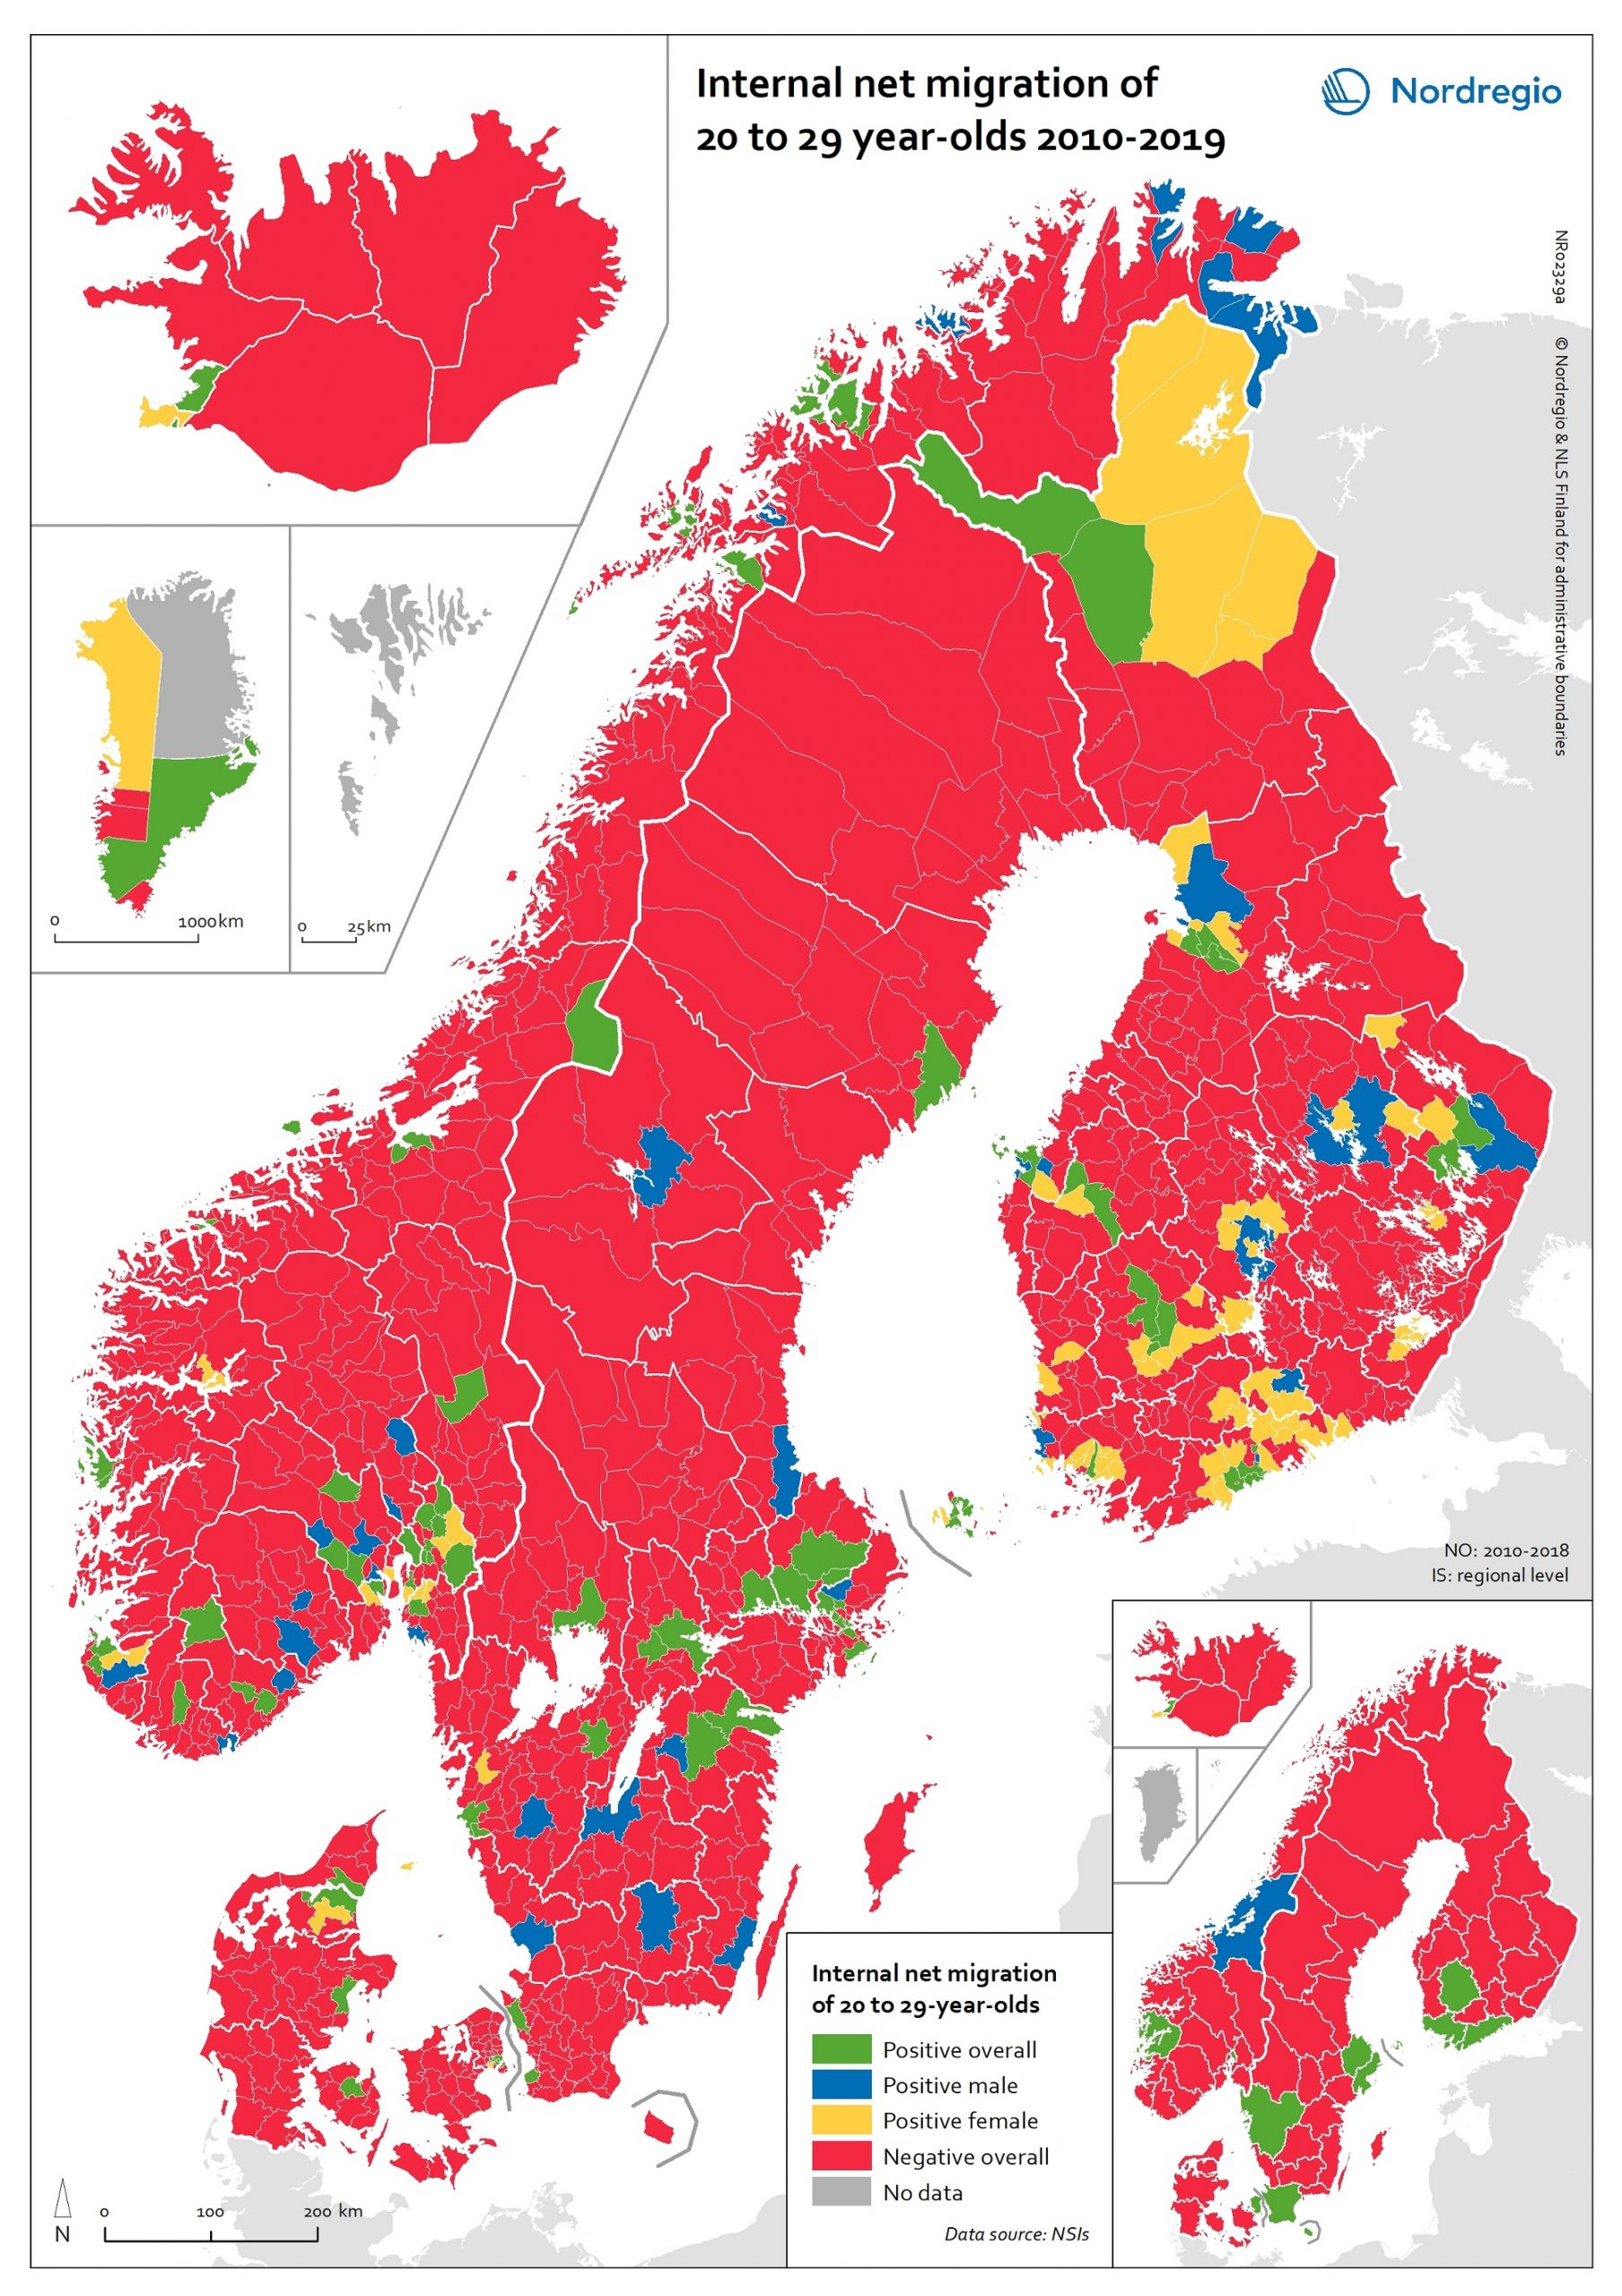
Internal net migration of 20 to 29 years-of-age, by gender, in 2010-2019
This map shows a typology that divides the Nordic municipalities and regions into four migration categories: positive net migration for both males and females (green on the map), positive male net migration (blue on the map), positive female net migration (yellow on the map), and negative net migration for both males and females (red on the map). These migration flows of 20 to 29-year-olds are of interest since there is a particularly high level of internal migration among young adults across the Nordic countries compared to other EU countries. While the map shows that the great majority of municipalities experience negative net migration of young adults in favour of a few functional urban areas and some larger towns, it is possible to observe a number of exceptions to this general rule. The rural municipalities of Utsira, Moskenes, Valle, Smøla, Ballangen and Lierne in Norway have the highest positive net migration rates both for men and women. There are also positive net migration rates for males and females in the peripheral municipalities of Jomala, Kittilä, Lemland and Finström in Finland and Åland. There is positive male net migration but negative female net migration in Gratangen, Loppa, Gamvik, Drangedal and a few other Norwegian rural municipalities, plus Mariehamn in Åland, while several municipalities in remote areas of Finland have positive female net migration but negative male net migration. Some of these patterns may be related to specialised local labour markets, such as fisheries in Loppa, or recreational tourism in Kittilä. In general, the pattern of net migration among young adults is more diverse in Finland (where 72.0% of all municipalities have negative net migration), compared with 84.6% in Norway, 88.9% in Denmark and 89.0% in Sweden. However, it is important to remember that Danish, Finnish and Norwegian municipalities are smaller in size…
- 2020 October
- Demography
- Migration
- Nordic Region
Internal net migration as percentage of population 2010–2018
This map shows annual average internal net migration rate at the municipal and regional level in 2010-2018. The map shows the percentage change from internal migration for the period 2010 to 2018. Internal or domestic migration refers to migration between municipalities and regions within the same country. The blue areas on the map show municipalities/regions with positive internal net migration (i.e. more people arriving than departing), the red areas show municipalities/regions with negative internal net migration (i.e. more people departing than arriving) and the yellow areas show municipalities/regions with balanced internal net migration rates (i.e. comparable numbers of people arriving and departing). The trend revealed is that internal migration movements are directed towards larger city regions, with many rural periphery regions losing people. The loss of people in some of these regions is felt especially acutely because of the age selectivity of migration, with young people leaving in large numbers, accelerating the ageing of the population structure in regions with high out-migration. Read the digital publication here.
- 2020 February
- Demography
- Migration
- Nordic Region
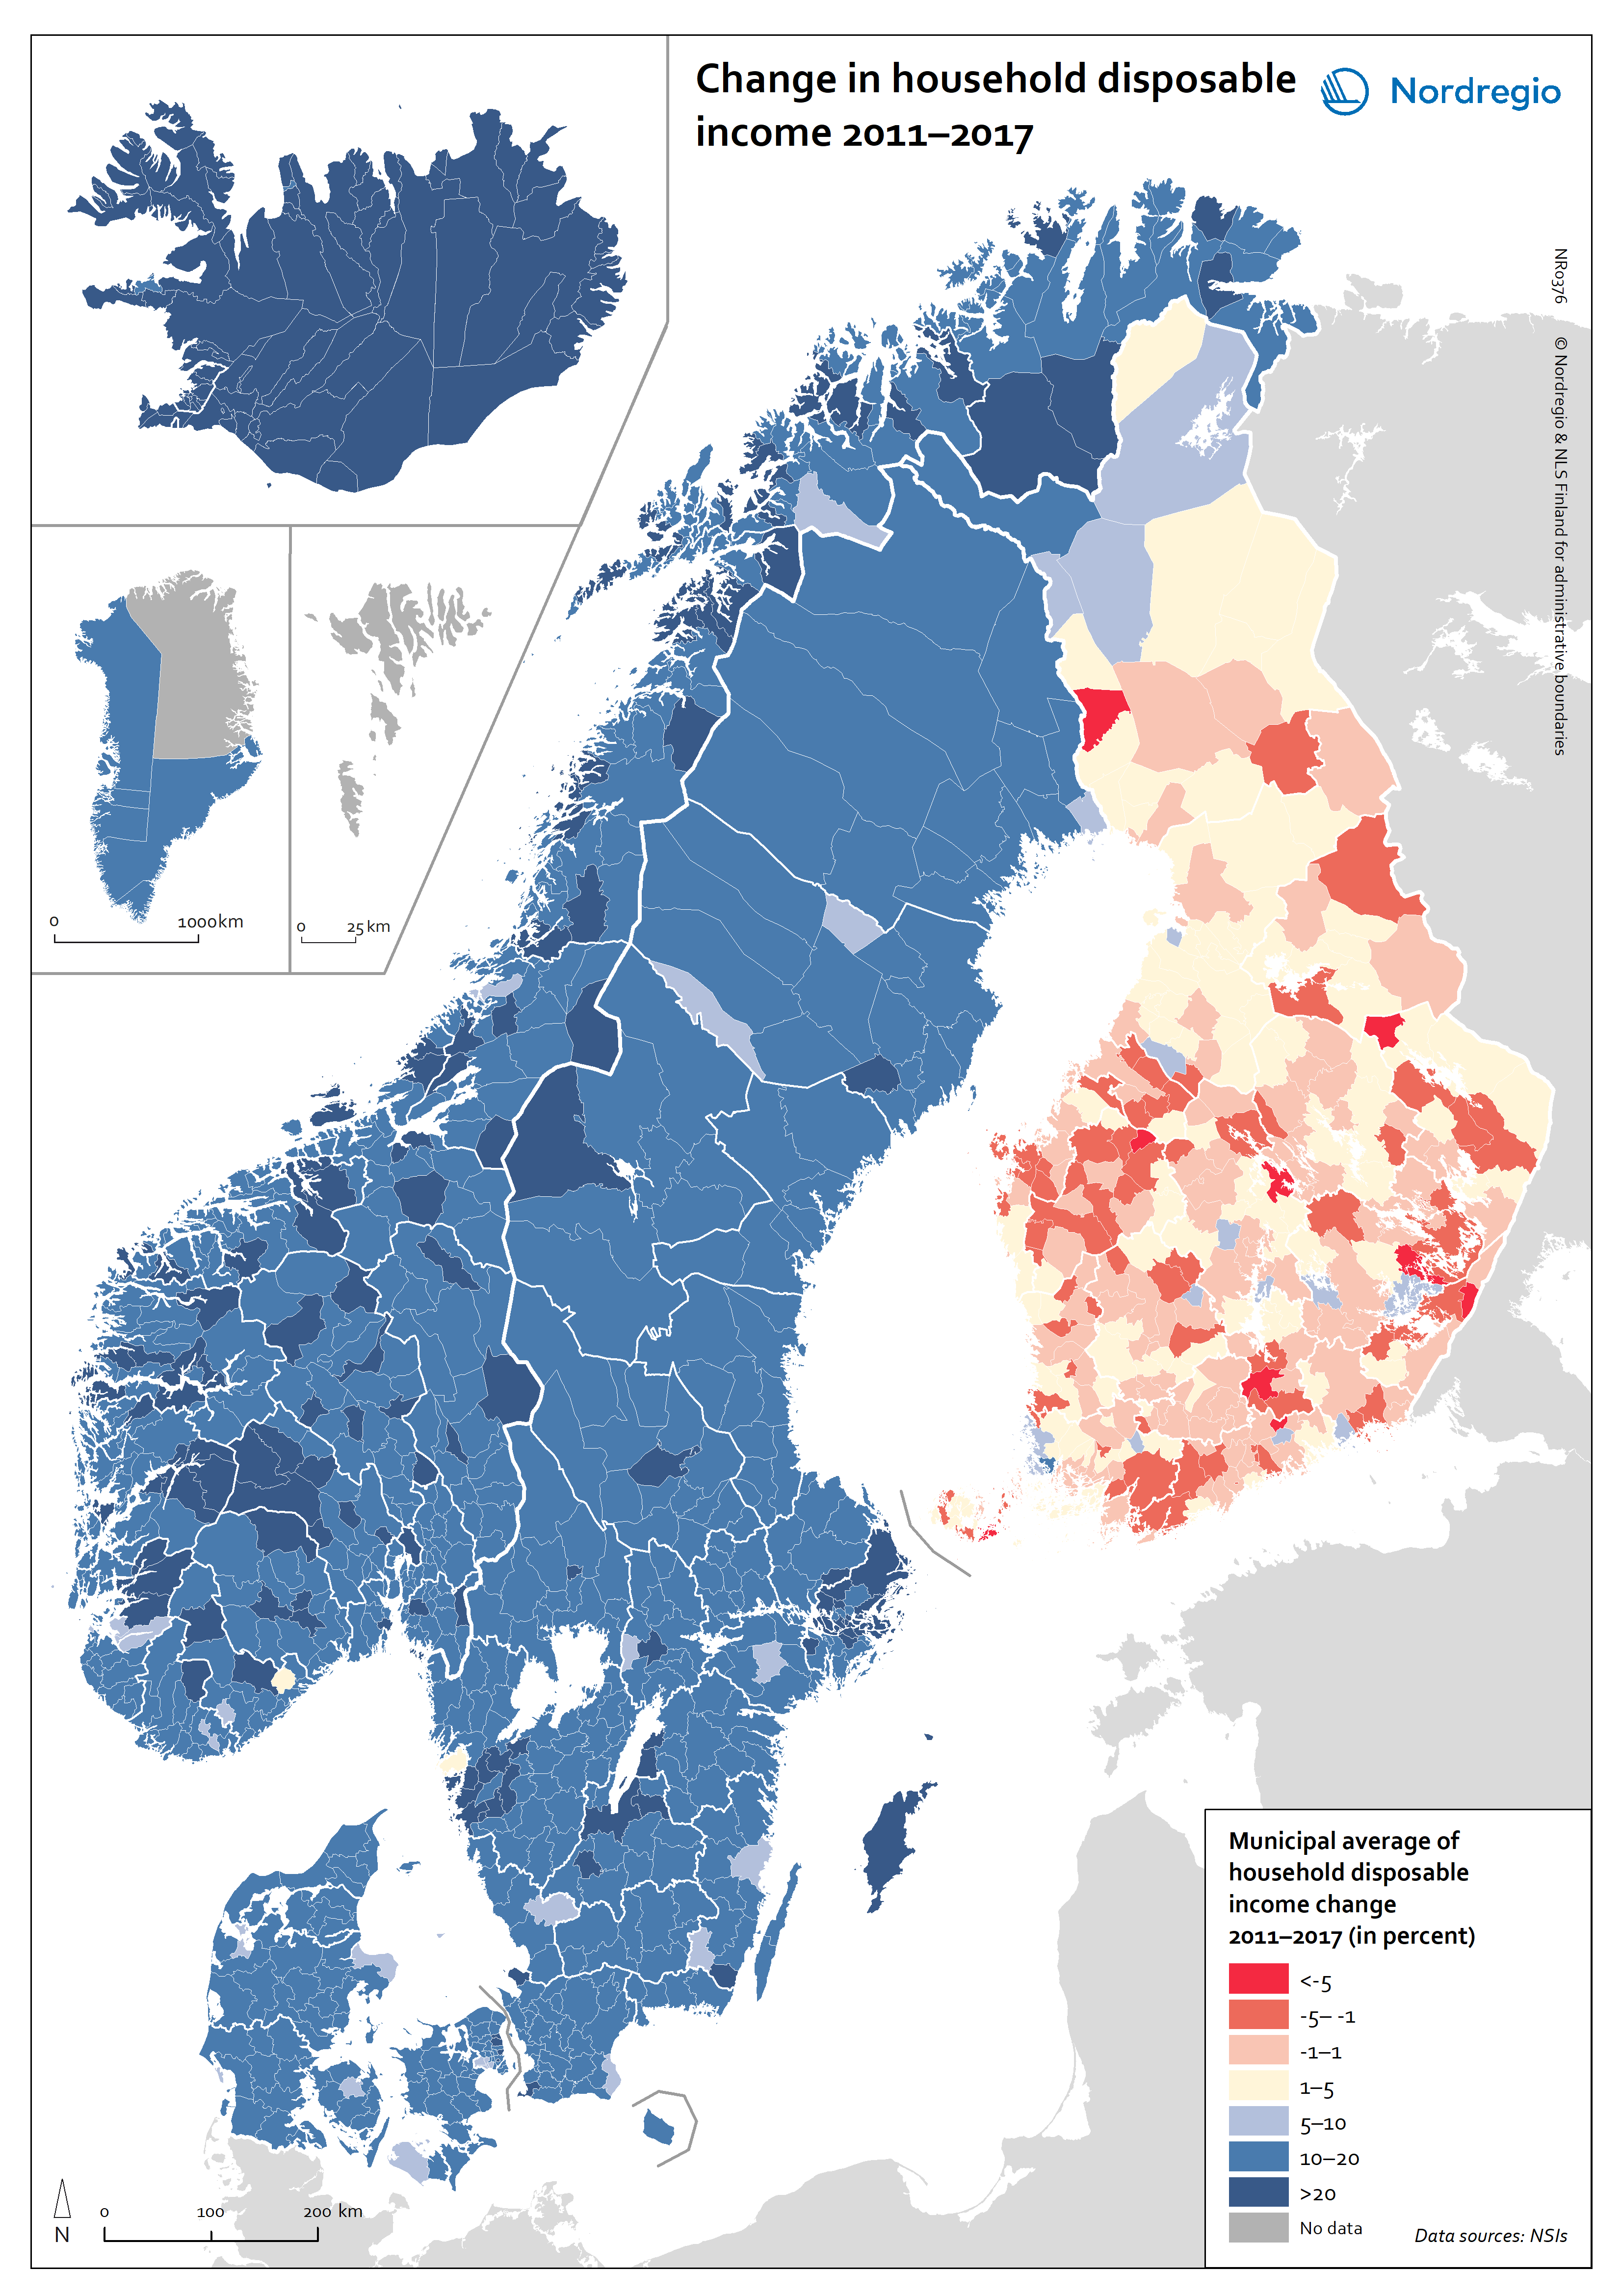
Change in household disposable income 2011–2017
This map shows the change in household disposable income at the municipal level during the period 2011-2017. The blue colours indicate an increase in average household disposable income and the red colours indicate a decrease in average household disposable income. Household disposable income is defined as the sum of the income of a household (i.e. income from employment, net property income, social transfers and social benefits) minus direct taxes and social contributions, with dividends and net interest taken into consideration. The map reveals that a striking difference between the trends in Finland and Åland and those in the rest of the Nordic Region. The average household disposable income has fallen in almost half of the municipalities in Finland and Åland, but increased in all municipalities in Denmark, Greenland, Iceland, Norway and Sweden. Vimpeli, Rautjärvi and Pukkila, all in Finland, are the municipalities which experienced the largest drop in average household income between 2011 and 2017. This negative trend in municipalities in Finland was largely the consequence of a prolonged recession in the early 2010s, when the manufacturing sector was hit by a structural crisis. The situation was exacerbated by out-migration to urban areas and a rise in the unemployment rate in Finland, which peaked in 2015. Read the digital publication here.
- 2020 February
- Economy
- Migration
- Nordic Region
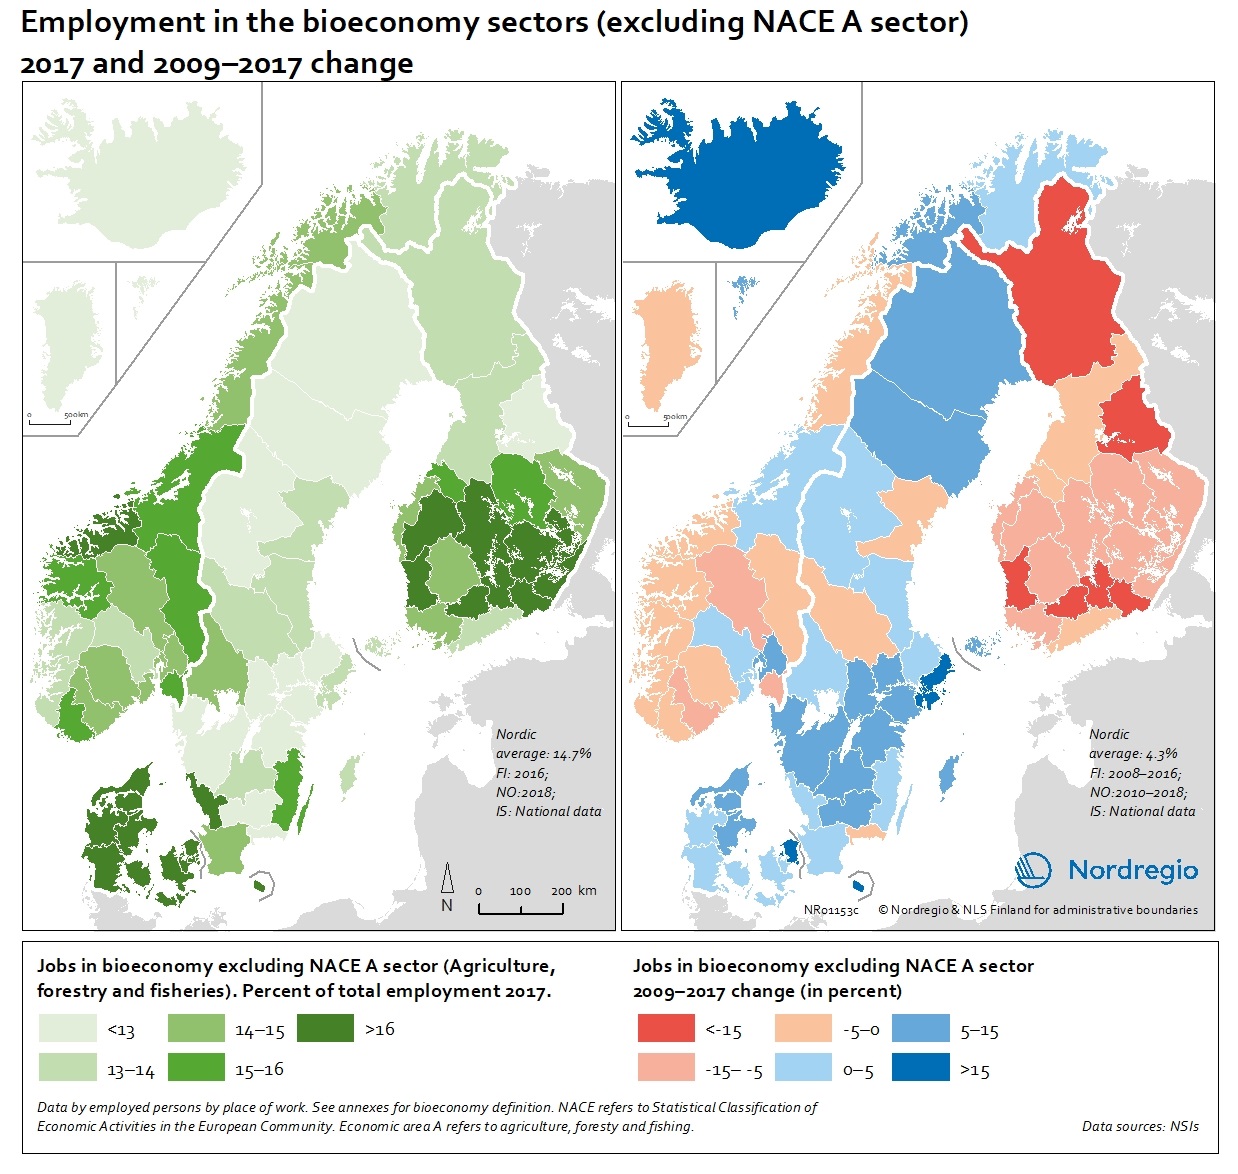
People employed in the bioeconomy excluding NACE sector A in 2017 and 2009-2017 change
These maps show the number of jobs in the bioeconomy sectors as a share of the total employment in 2017 (left) and 2009-2017 change (right), excluding the NACE A sectors. The non-NACE-A sectors have seen a more moderate decrease in Finland but a noticeable increase in most parts of Sweden, Denmark and the Faroe Islands and a remarkable increase in Iceland with more than 15% (Figure 9.3). The average increase in the Nordic Region is 4.3% in the non-NACE-A sectors. There are also notable differences within the countries, showing that regional differences matter. In Denmark, Greenland and the Faroe Islands, there is a positive trend in most regions, but in Finland, almost all regions are losing jobs in the primary industries. In Norway and Sweden, some regions show positive development while others are in decline. Read the digital publication here.
- 2020 February
- Economy
- Labour force
- Nordic Region
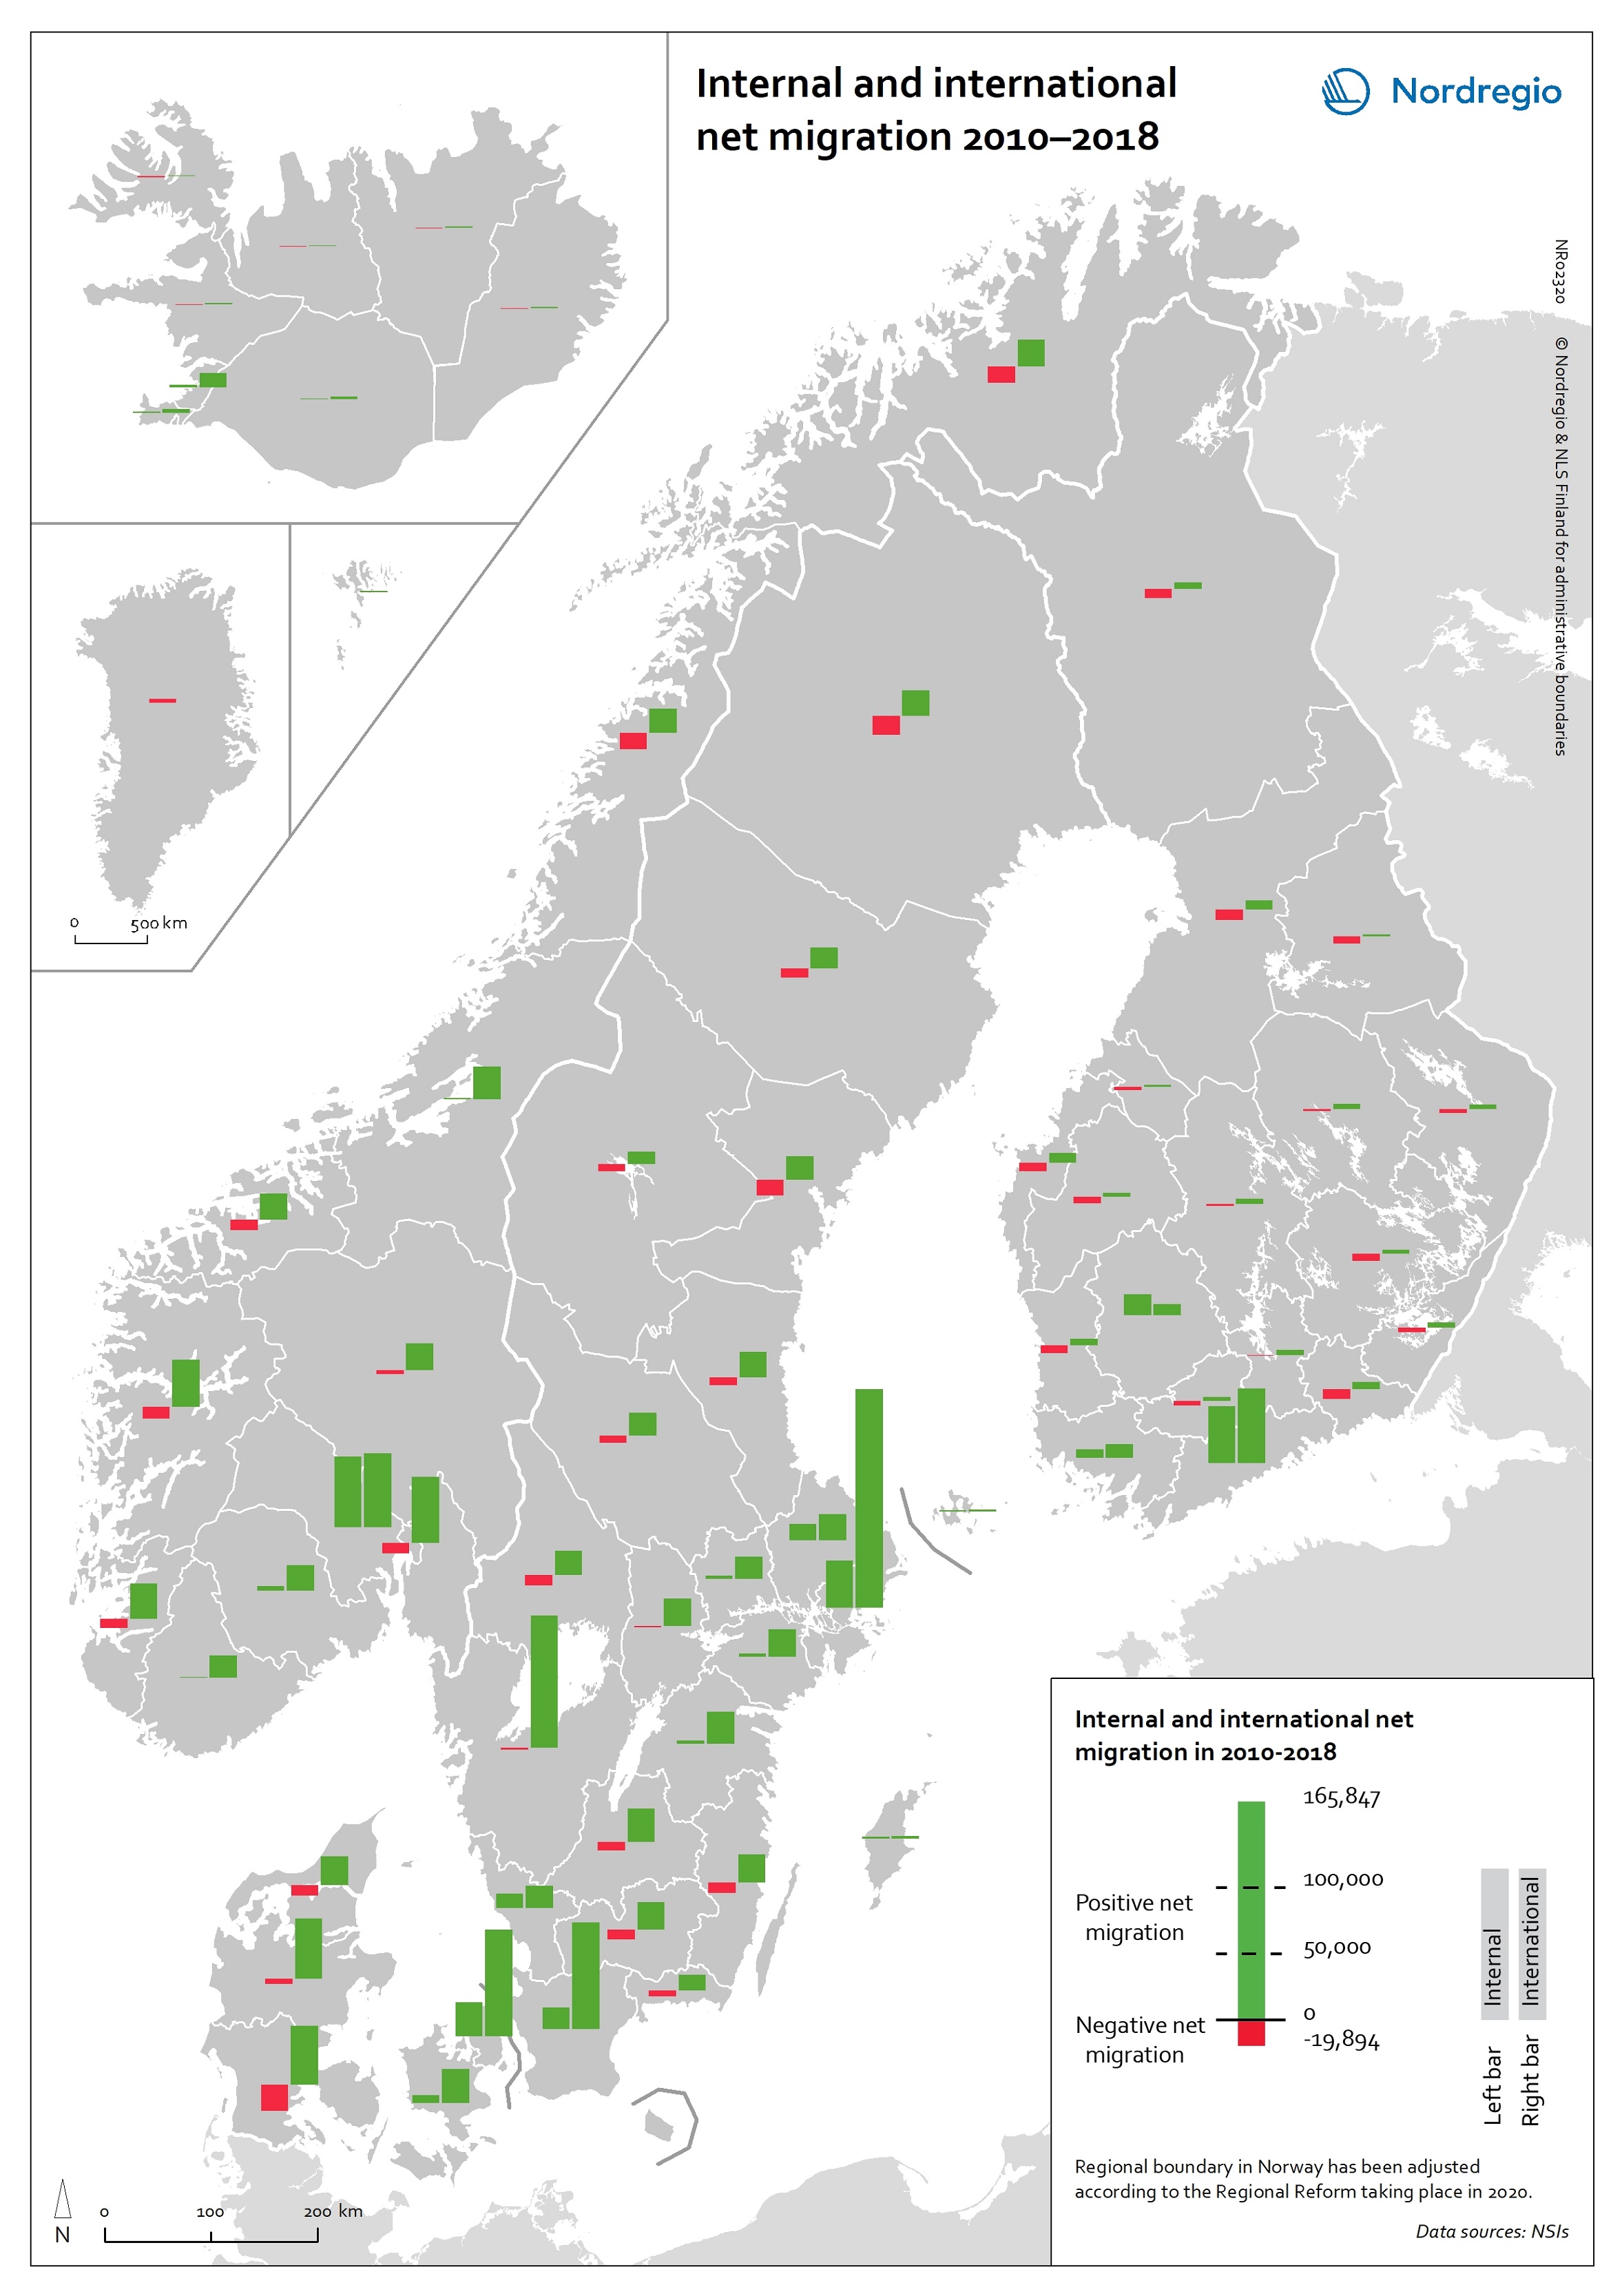
Internal and international net migration 2010-2018
This map shows internal and international net migration in 2010-2018. The map shows the combination of domestic migration (left-hand bar) and international migration (right-hand bar), with red indicating net out-migration and green indicating net in-migration, for the 66 regions within the Nordic Region in the period 2010 to 2018. The size of the bar indicates the size of the net flows. All regions have had positive international migration since 2010, which is not surprising given the size of the international migration flows into the Nordic Region in recent years. Overall in the Nordic Region, there were either domestic migration losses and international migration gains or gains from people moving both from elsewhere in the country and from abroad. The gains from international migration far exceeded those of internal migration in almost all regions that experienced net gains from both streams. Due to these different patterns of internal and international migration, nearly all regions are becoming much more diverse in terms of the size of foreign-born populations. Read the digital publication here.
- 2020 February
- Demography
- Migration
- Nordic Region
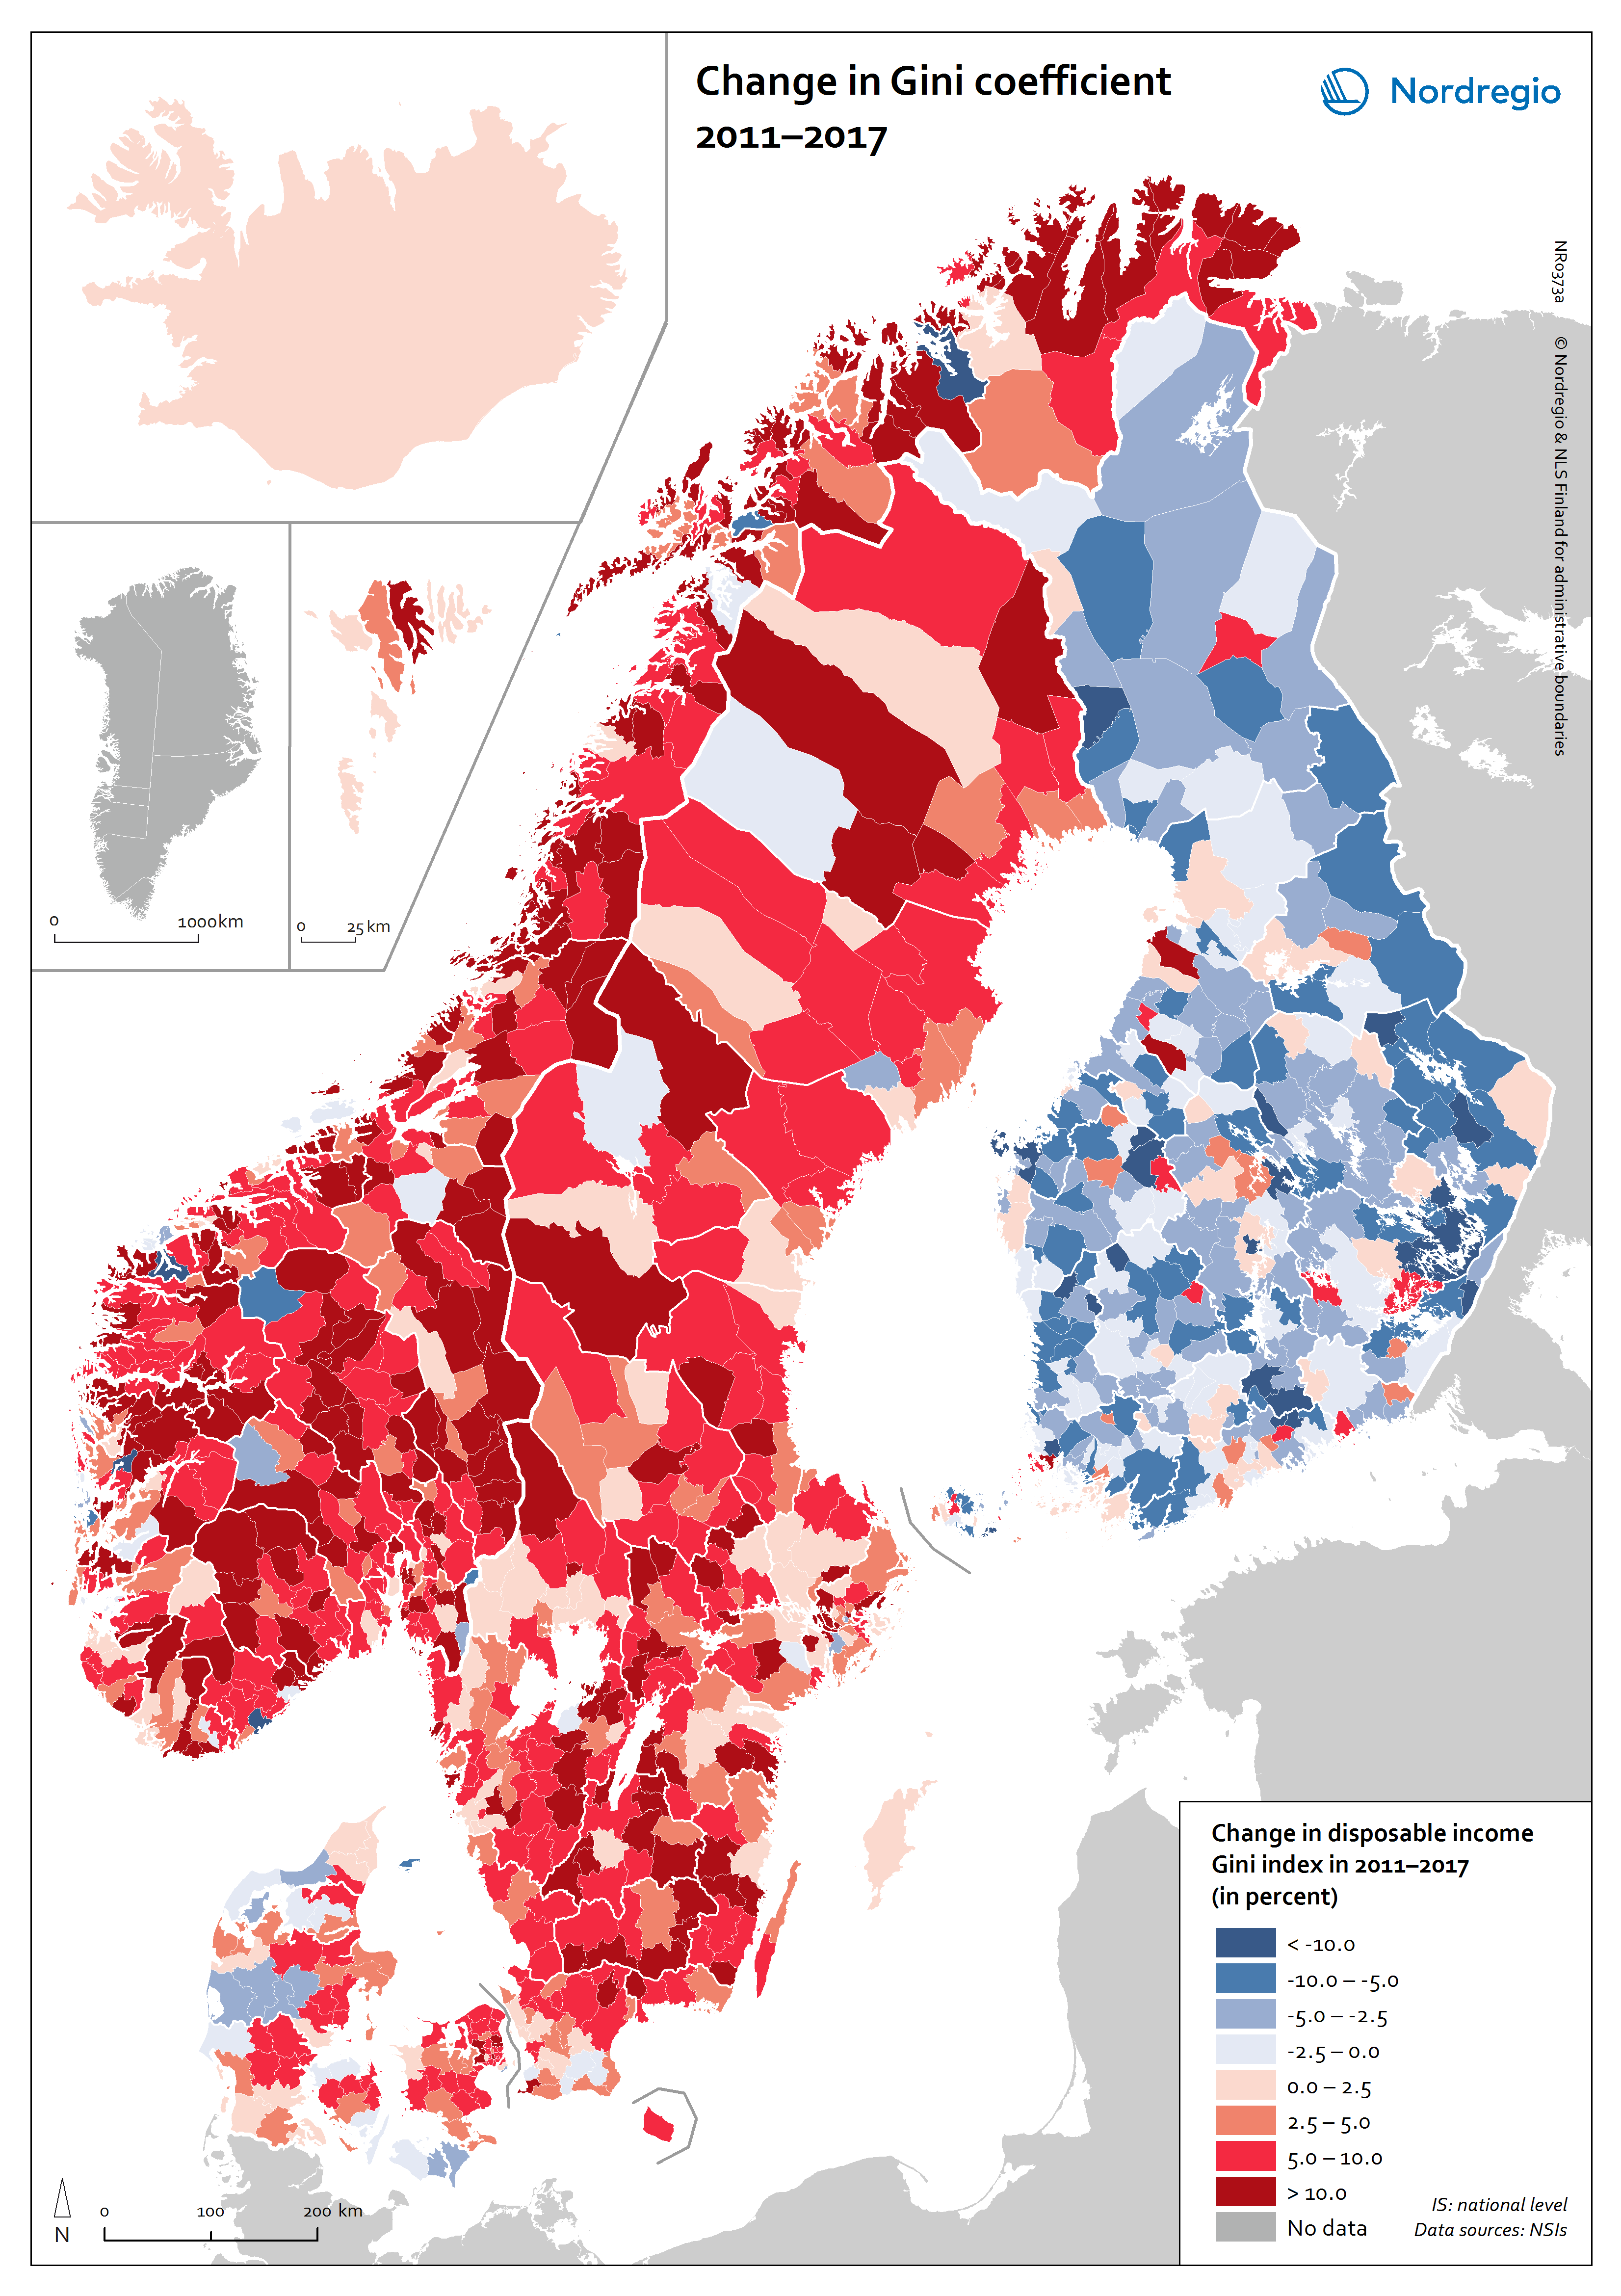
Change in Gini coefficient 2011-2017
This map shows the change in disposable income Gini index at the municipal level during the period 2011-2017. The blue shades indicating a decrease in income inequality and the red shades indicating an increase in income inequality. The figure reveals that the situation is very different across the municipalities and countries of the Nordic Region. Income inequality increased between 2011 and 2017 in the vast majority of municipalities across the Nordic Region. The greatest increases are found in rural areas in both Norway and Sweden. These increases are largely explained by an increase in income for households that already had a high income in 2011. However, income inequality decreased in almost a quarter of the municipalities in the Nordic Region during the same period. These municipalities are mainly located in Finland and Åland. The narrowing of the household income gap in many municipalities across Finland is mainly due to the prolonged economic recession in the early 2010s combined with demographic changes (e.g. out-migration and ageing). Read the digital publication here.
- 2020 February
- Economy
- Migration
- Nordic Region
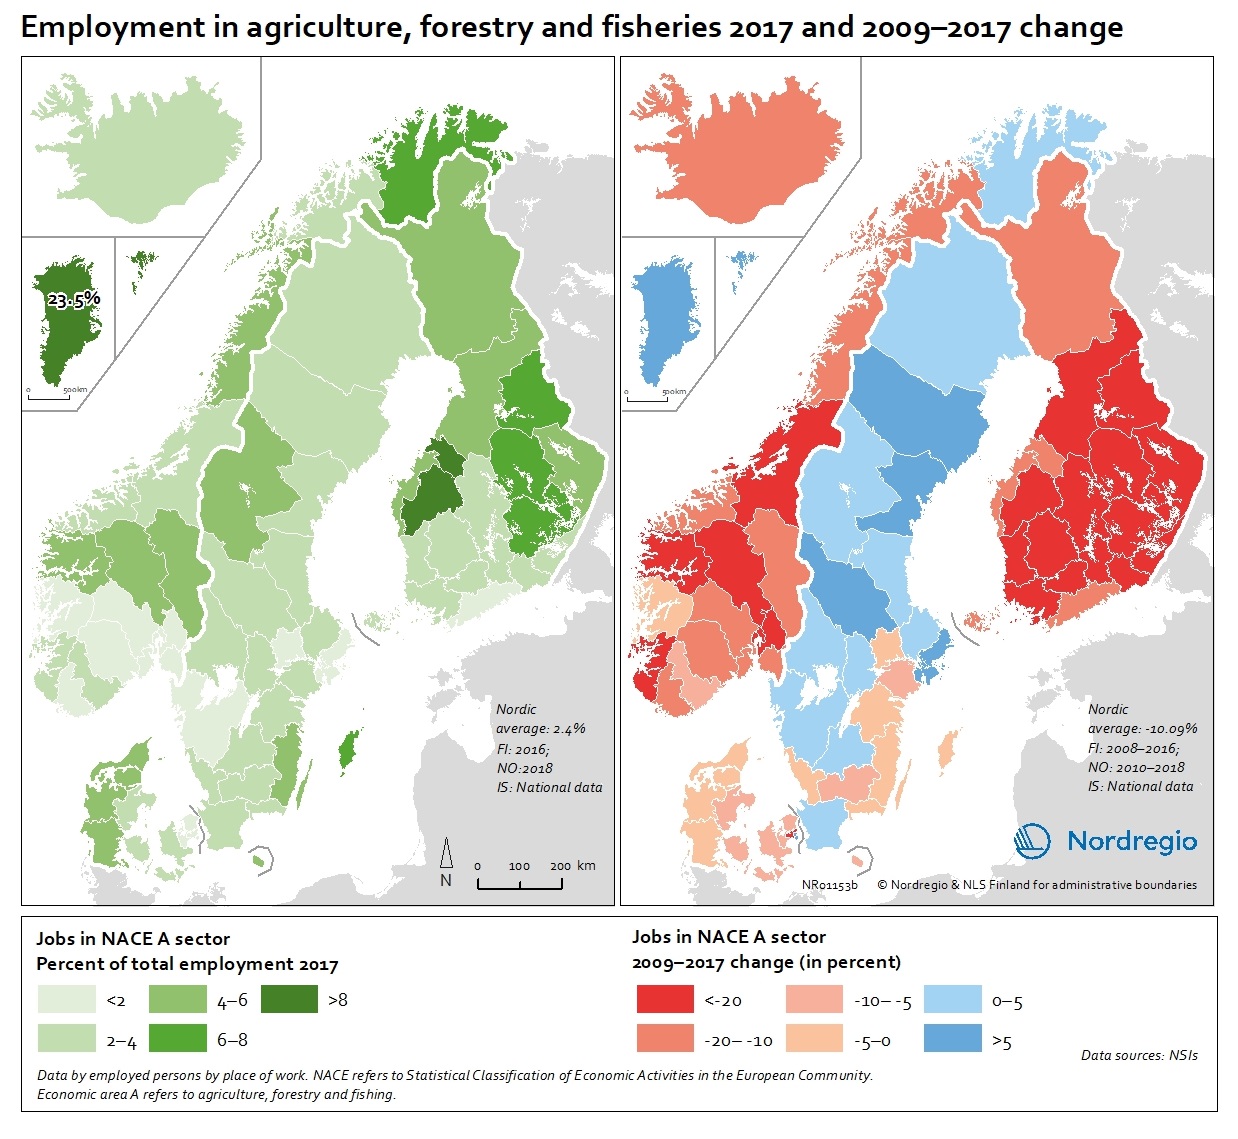
People employed in the agriculture, forestry and fisheries sectors (NACE Sector A) in 2017 and 2009-2017 change
These map show the number of jobs in the agriculture, forestry and fisheries sectors (NACE A sectors) as a share of the total employment in 2017 (left) and 2009-2017 change (right). The map (left) indicates ranges of people employed in agriculture, forestry and fisheries sectors between below 2% to above 8%, with the highest proportion being in Greenland with 23.5% in 2017. In the EU-28, the overall proportion of the total workforce with jobs in the NACE-A sectors is an average of 4.6%. Overall, the NACE-A sectors show a sharp decline in employment (right map), particularly in Finland, Iceland and Norway (except northern Norway), where the decline was up to 20% between 2009 and 2017. Read the digital publication here.
- 2020 February
- Economy
- Labour force
- Nordic Region
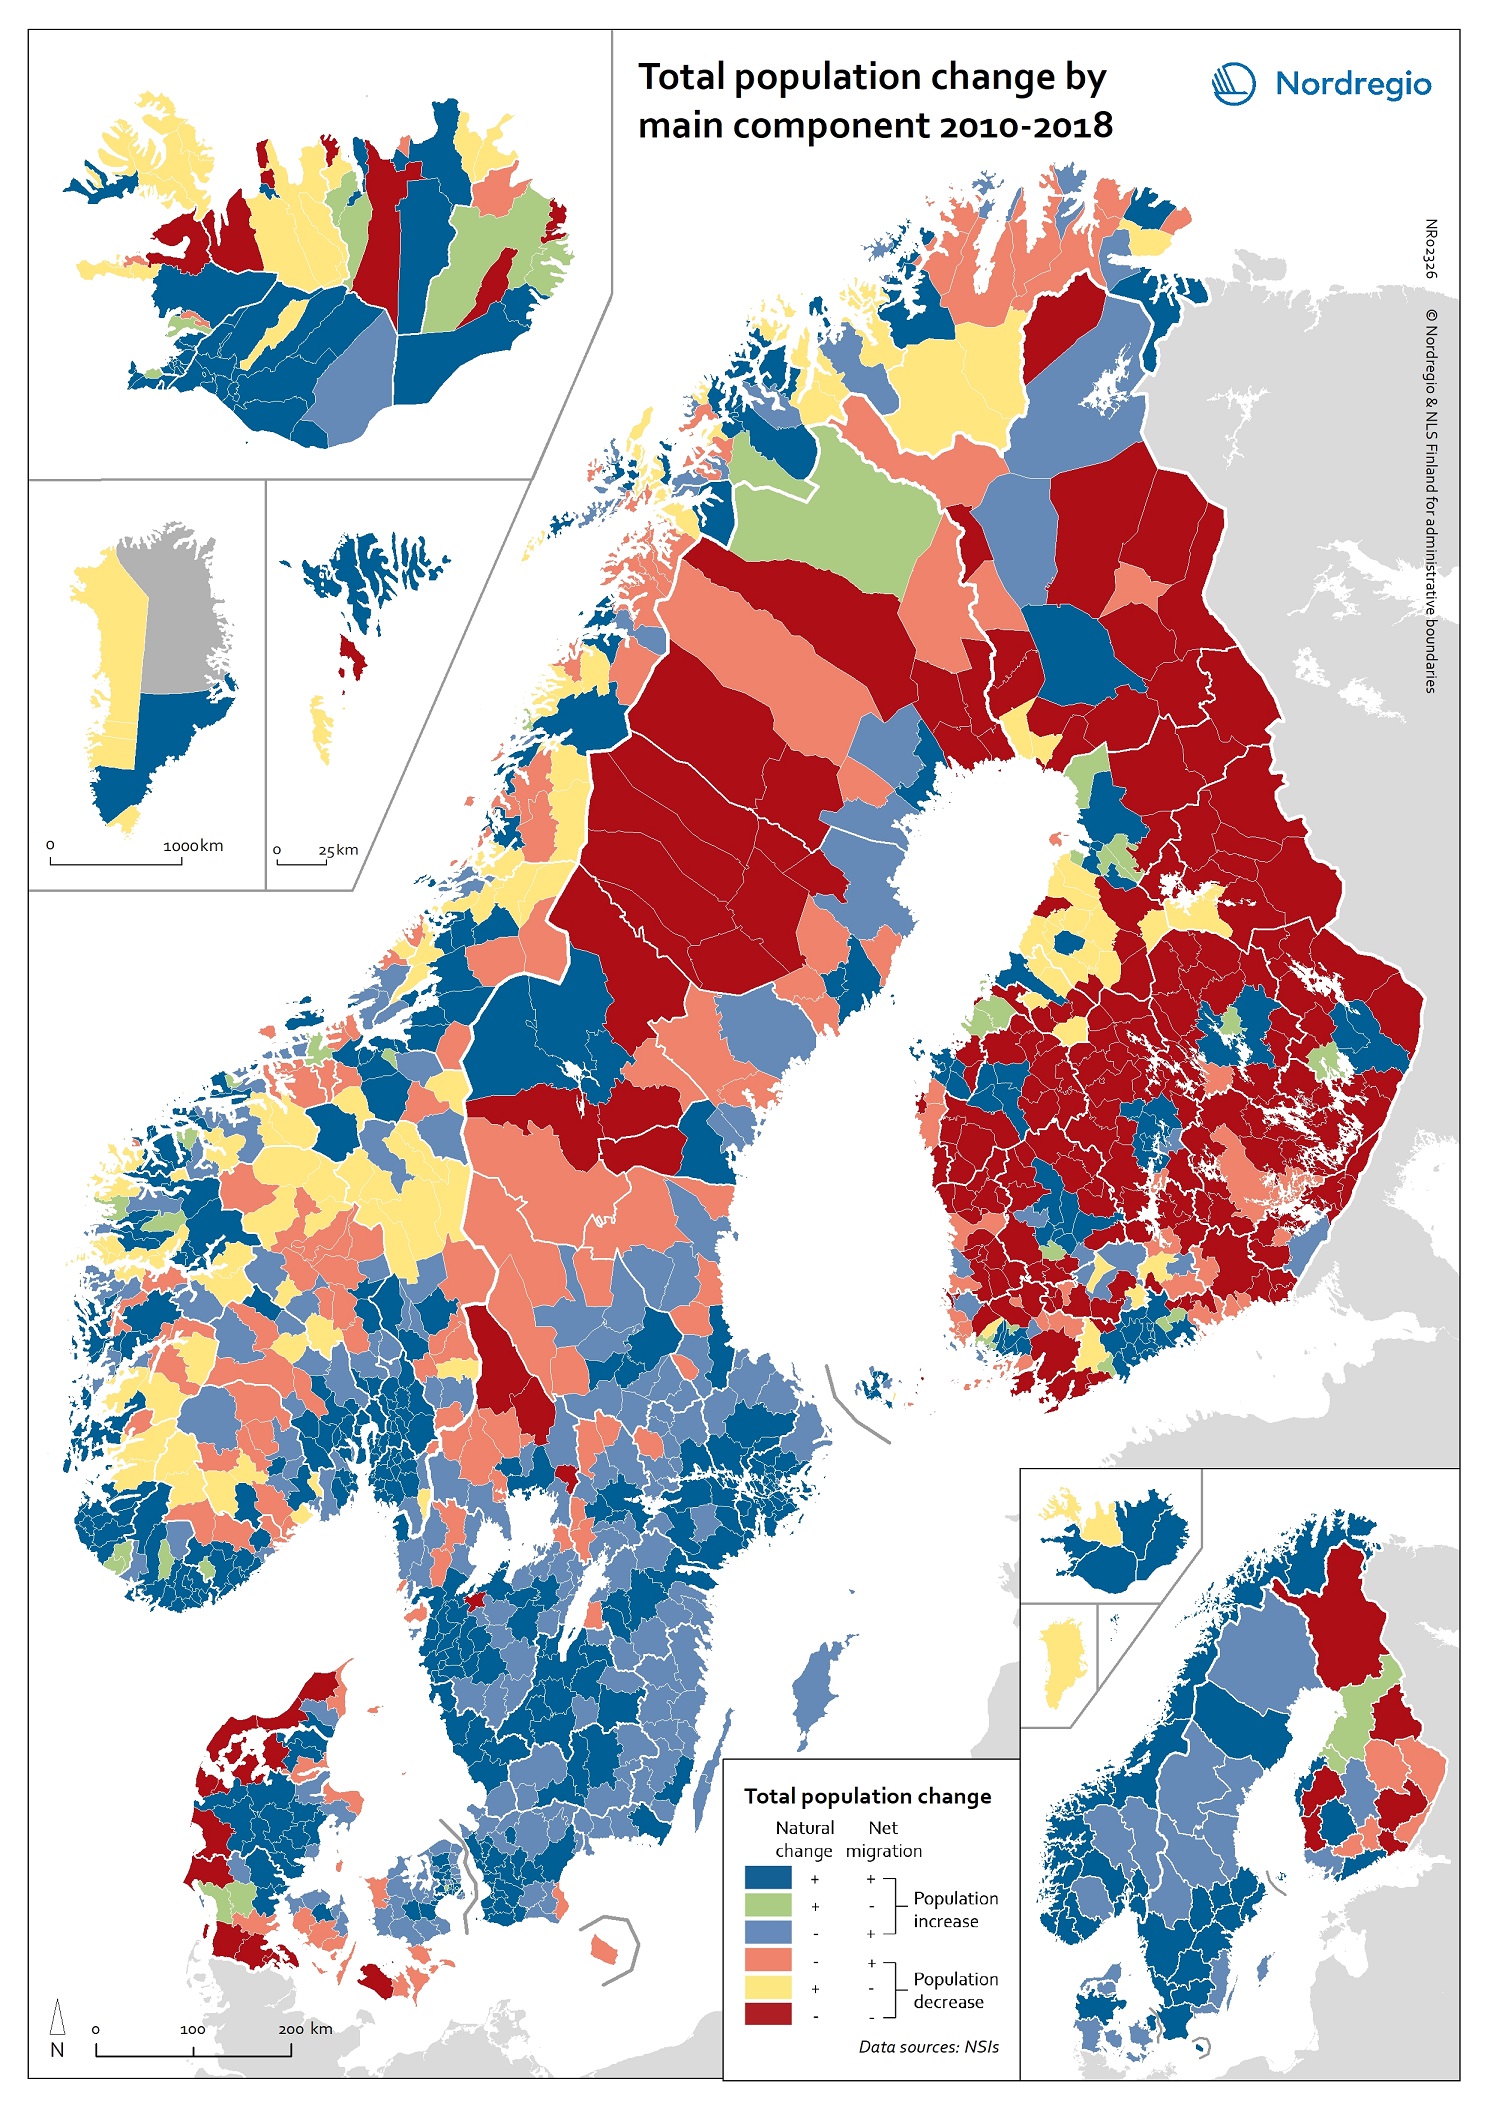
Total population change by main component 2010-2018
This map shows total population change by main component at the municipal and regional level in 2010-2018. The two components of population change are natural change and net migration. As the map shows, all regions in Denmark, Norway and Sweden experienced population increase due to either a combination of natural increase and net migration or through net migration alone between 2010-2018. In Iceland, all regions experienced both positive natural increase and positive net migration, except for Vestfirðir and Norðurland vestra, which experienced population decline despite experiencing more births than deaths over the period. The regional picture in Finland was more varied, with population decline most pronounced in the east and the north. At the municipal level, the highest overall population growth can be found mostly in the capital regions and bigger cities (e.g. Tampere and Turku in Finland), Central Jutland (Denmark), coastal areas of Norway, southern Iceland, southern Sweden, the northern municipalities of the Faroe Islands and Sermersooq Municipality (Greenland), which contains the capital of Nuuk. The highest overall population decline can be found mostly in the western and southern parts of Denmark, the majority of Finnish municipalities and most inland municipalities in northern Sweden. While the map shows a snapshot of population change for one decade, these trends of population increase in urban regions and municipalities and decline and ageing in periphery regions and municipalities have been underway for some time and are expected to continue into the foreseeable future. Read the digital publication here.
- 2020 February
- Demography
- Migration
- Nordic Region
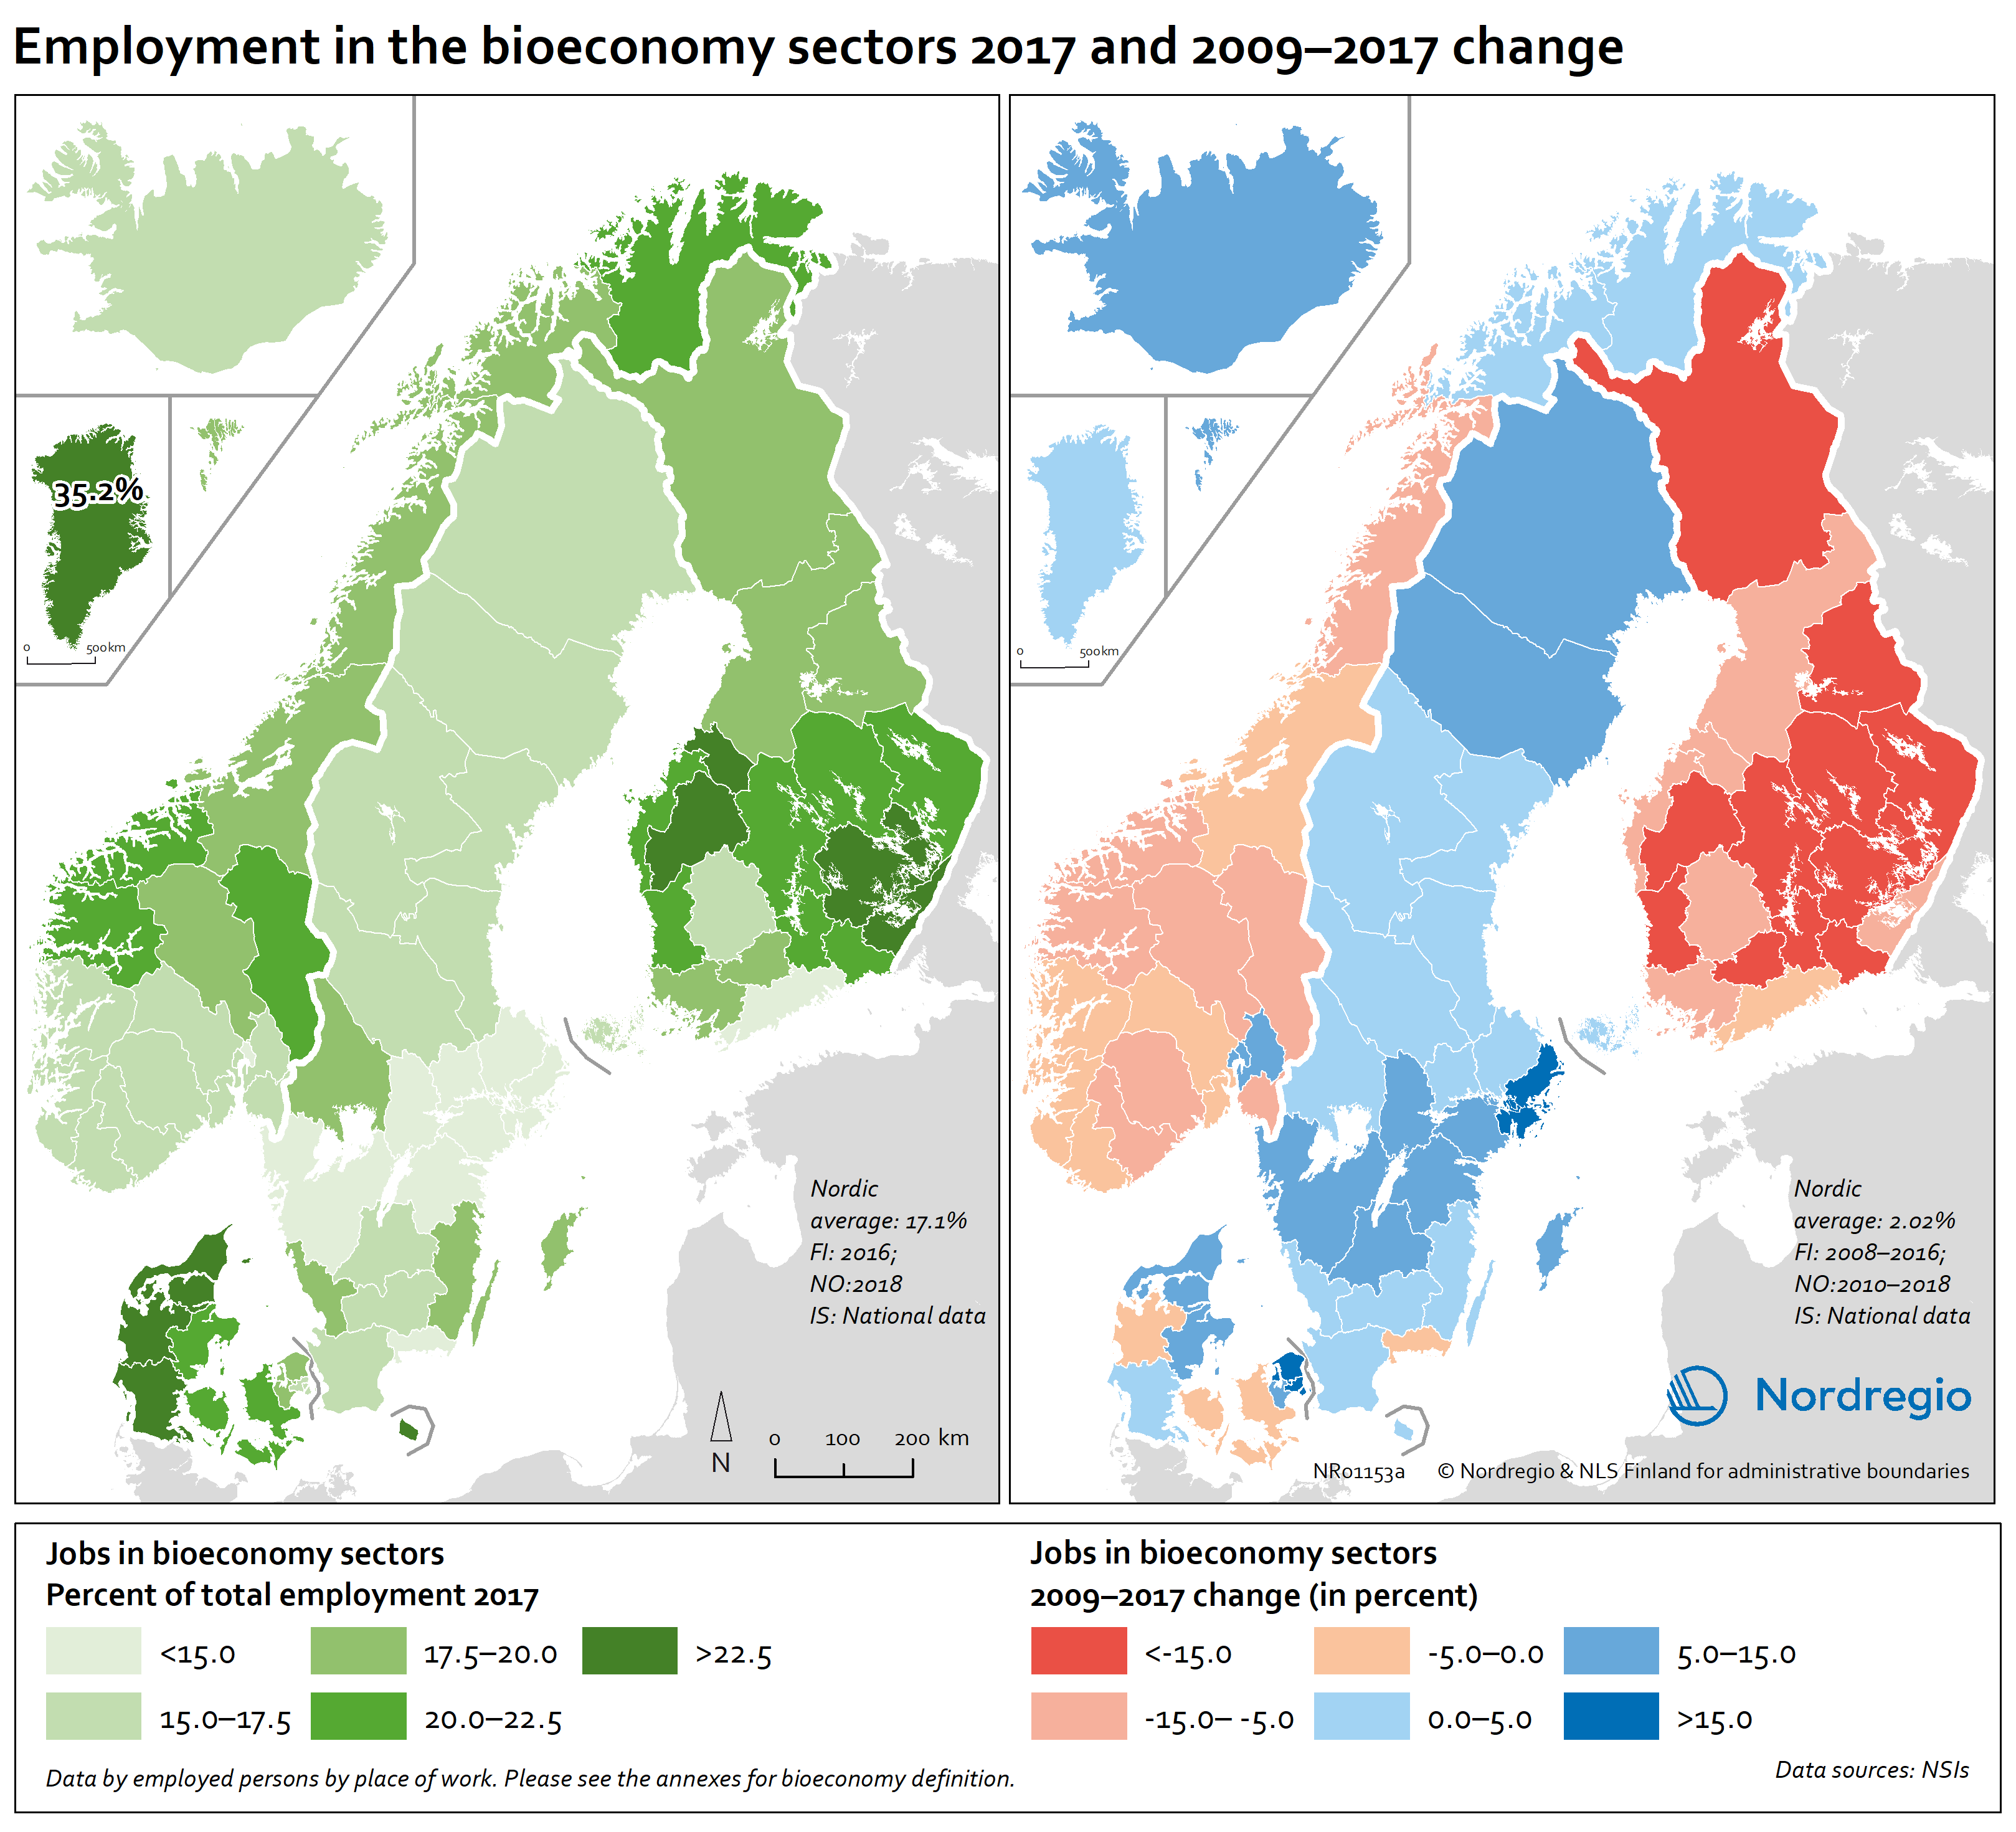
People employed in the bioeconomy including NACE sector A in 2017 and 2009-2017 change
These maps show the number of jobs in the bioeconomy sectors as a share of the total employment in 2017 (left) and 2009-2017 change (right). The share of jobs in the bioeconomy varies from below 15% to above 22.5%. For instance, in the western regions of Denmark, the central and southern regions in Finland, Greenland and some mid and northern regions of Norway, over 22.5% of the working population is employed in the bioeconomy. At the same time, most regions in mid-Norway, in all Finnish and some Danish regions witnessed negative development in jobs in the bioeconomy. In Greenland, Iceland, Faroe Islands, Sweden, Northern Norway and other parts of Denmark the situation is very different and the number of jobs in the bioeconomy has increased. These proportions should also be seen in relation to the increase in total number of jobs17 in most regions in the Nordic countries except for the Finnish regions and Åland where there is a decline in most regions. Read the digital publication here.
- 2020 February
- Economy
- Labour force
- Nordic Region
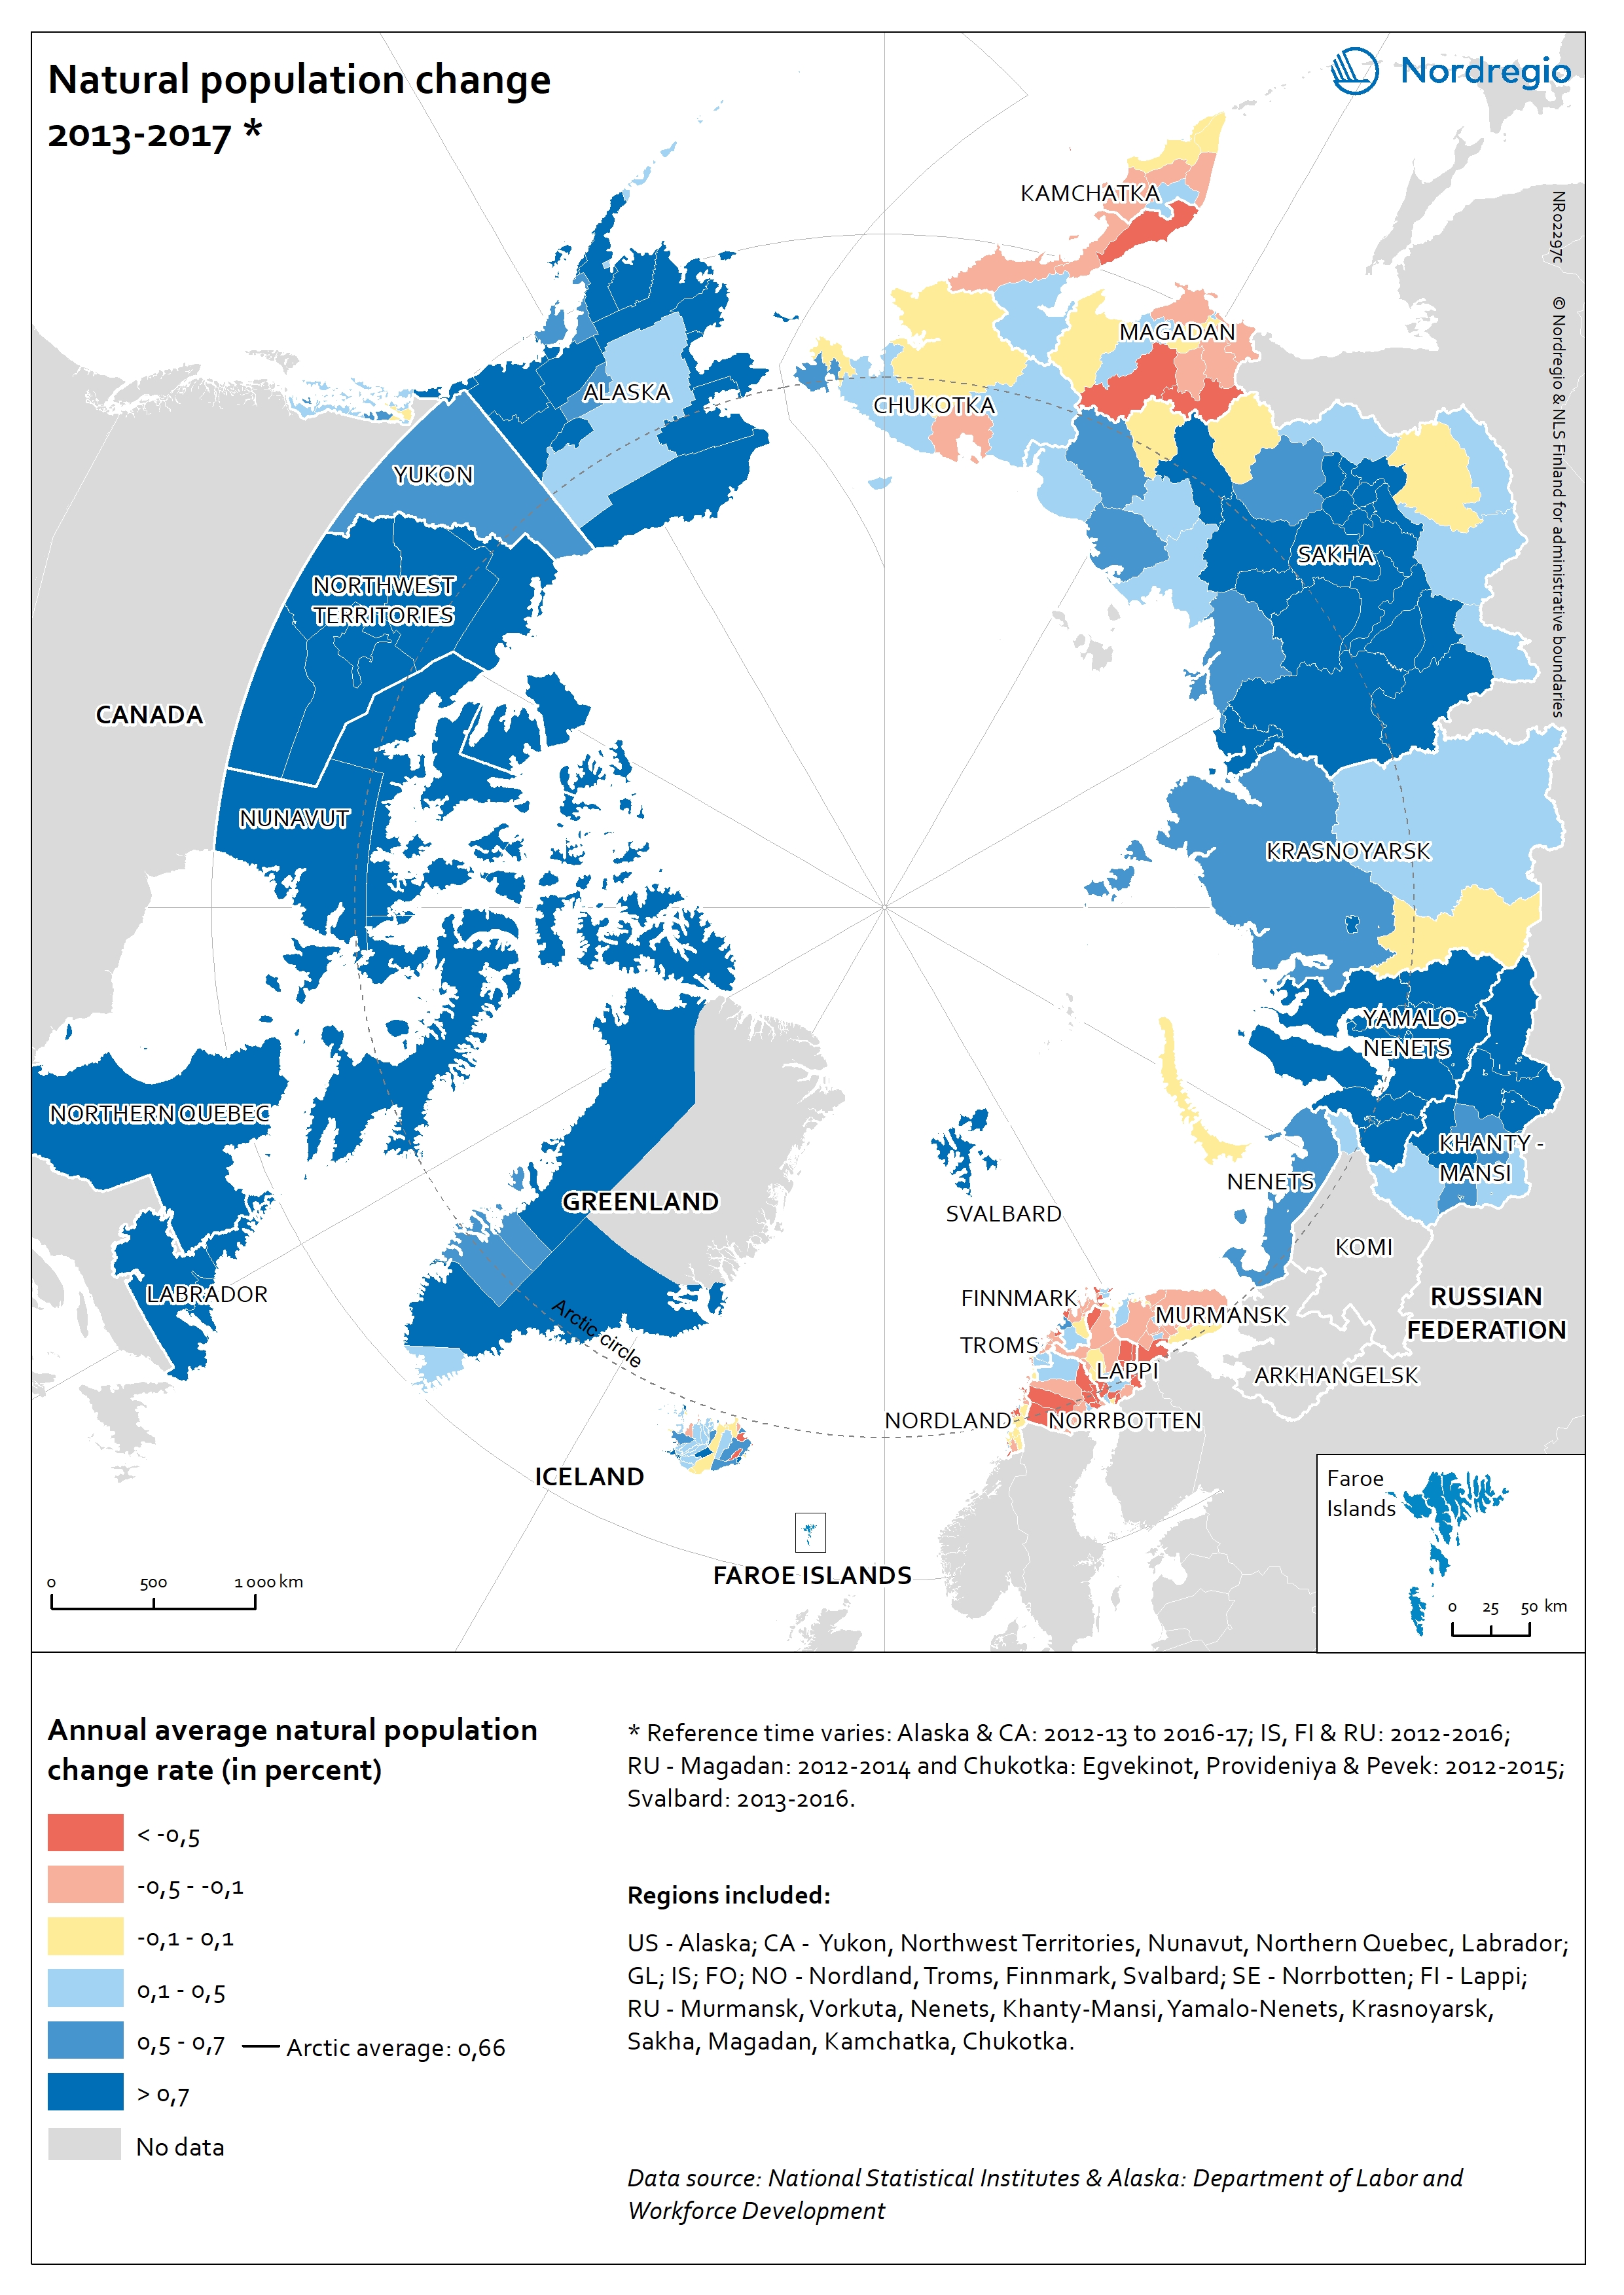
Natural population change in the Arctic
The map shows the annual natural population change rates in the Arctic subregions between 2013 and 2017. The blue tones indicate a positive change: subregions where the number of live births exceeds the number of deaths. The yellow colour indicates no or little change: subregions where the difference between births and deaths are close to zero. The red tones indicate negative change: subregions where the number of deaths exceed the number of live births. In the Artic the annual average natural population change rate was 0,66% between 2013 and 2017. The natural population change was positive especially in the Canadian Arctic, Alaska (USA), Greenland as well as in Yamalo-Nenets, Khanty-Mansi and in Sakha regions (Russian Federation). Natural population decline was the strongest in the Nordic Arctic, as well as in Murmansk, Magadan, and Kamchatka (Russian Federation).
- 2019 March
- Arctic
- Demography
