98 Maps
Typology of regional internal net migration 2020-2021
The map presents a typology of internal net migration in regions by considering average annual internal net migration in 2020-2021 alongside the same figure for 2018-2019. The colours on the map correspond to six possible migration trajectories: Dark blue: Internal net in migration as an acceleration of an existing trend (net in-migration in 2020-2021 + increase compared to 2018-2019) Light blue: Internal net in migration but at a slower rate than previously (net in-migration in 2020-2021 + decrease compared to 2018-2019) Green: Internal net in migration as a new trend (net in-migration in 2020-2021 + change from net out-migration compared to 2018-2019) Yellow: Internal net out migration as a new trend (net out-migration in 2020-2021 + change from net in-migration compared to 2018-2019) Orange: Internal net out migration but at a slower rate than previously (net out-migration in 2020-2021 + decrease compared to 2018-2019) Red: Internal net out migration as a continuation of an existing trend (net out-migration in 2020-2021 + increase compared to 2018-2019)
 2022 May
 - Demography
- Migration
- Nordic Region
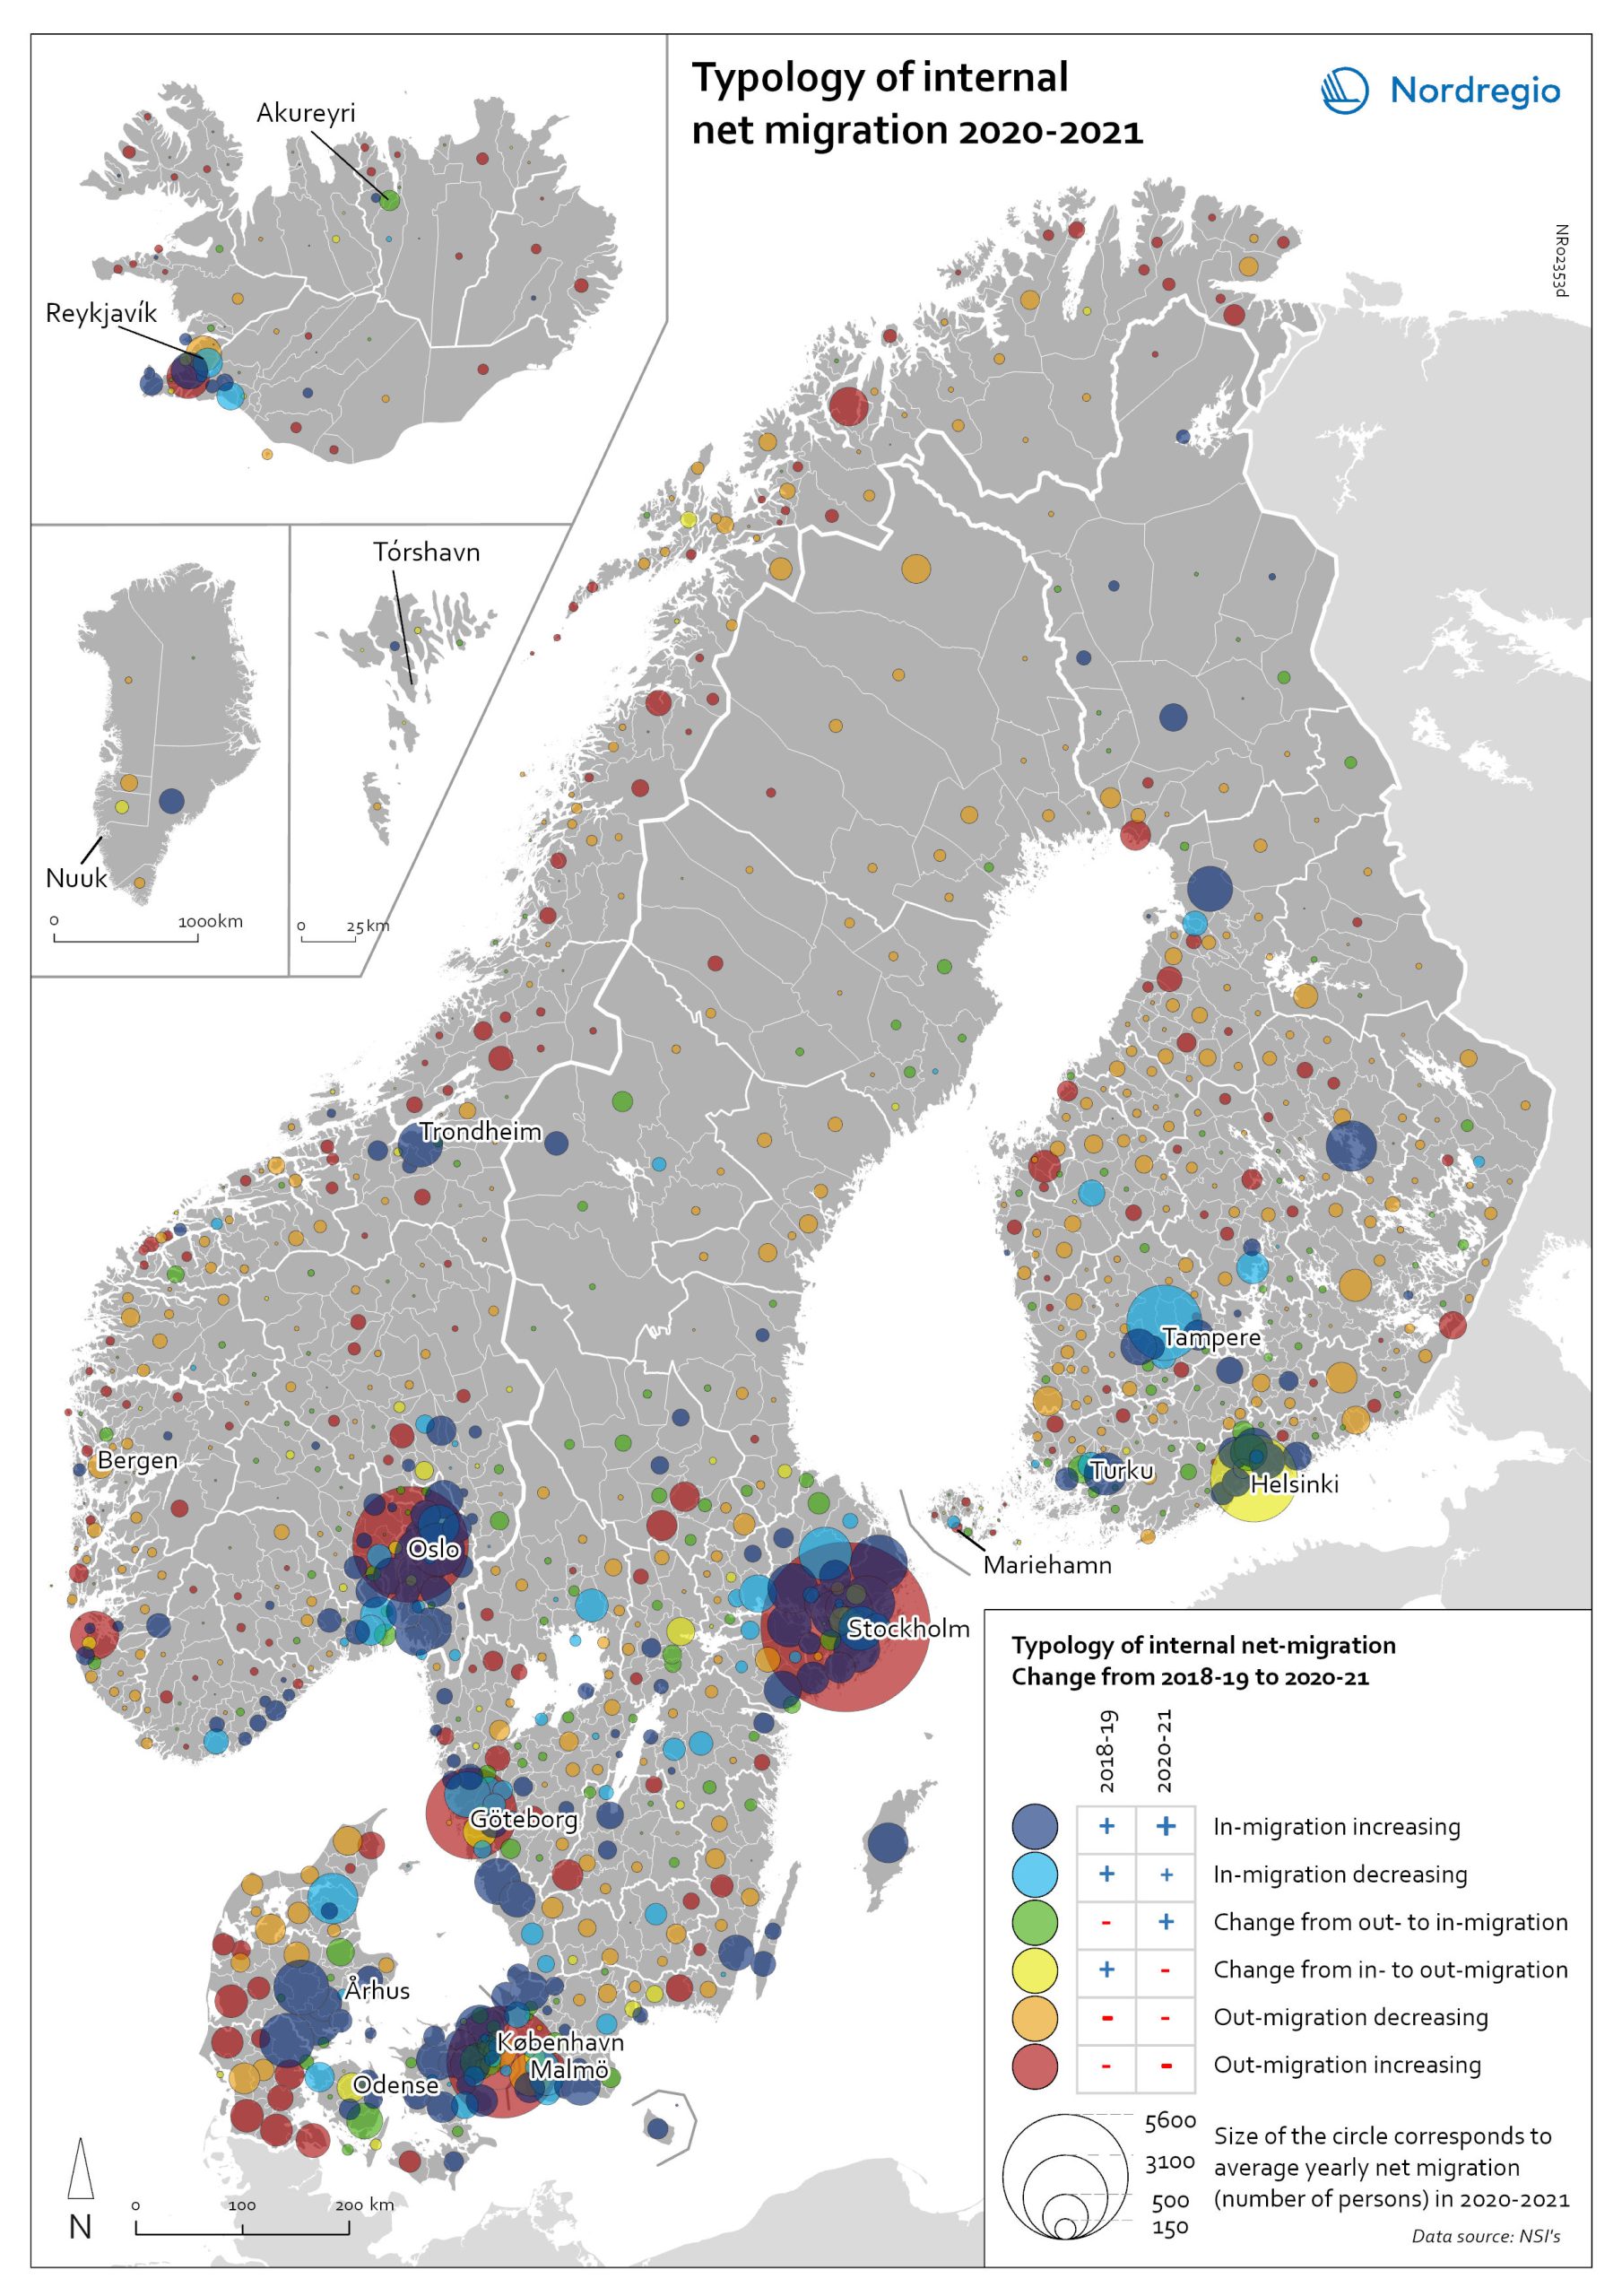
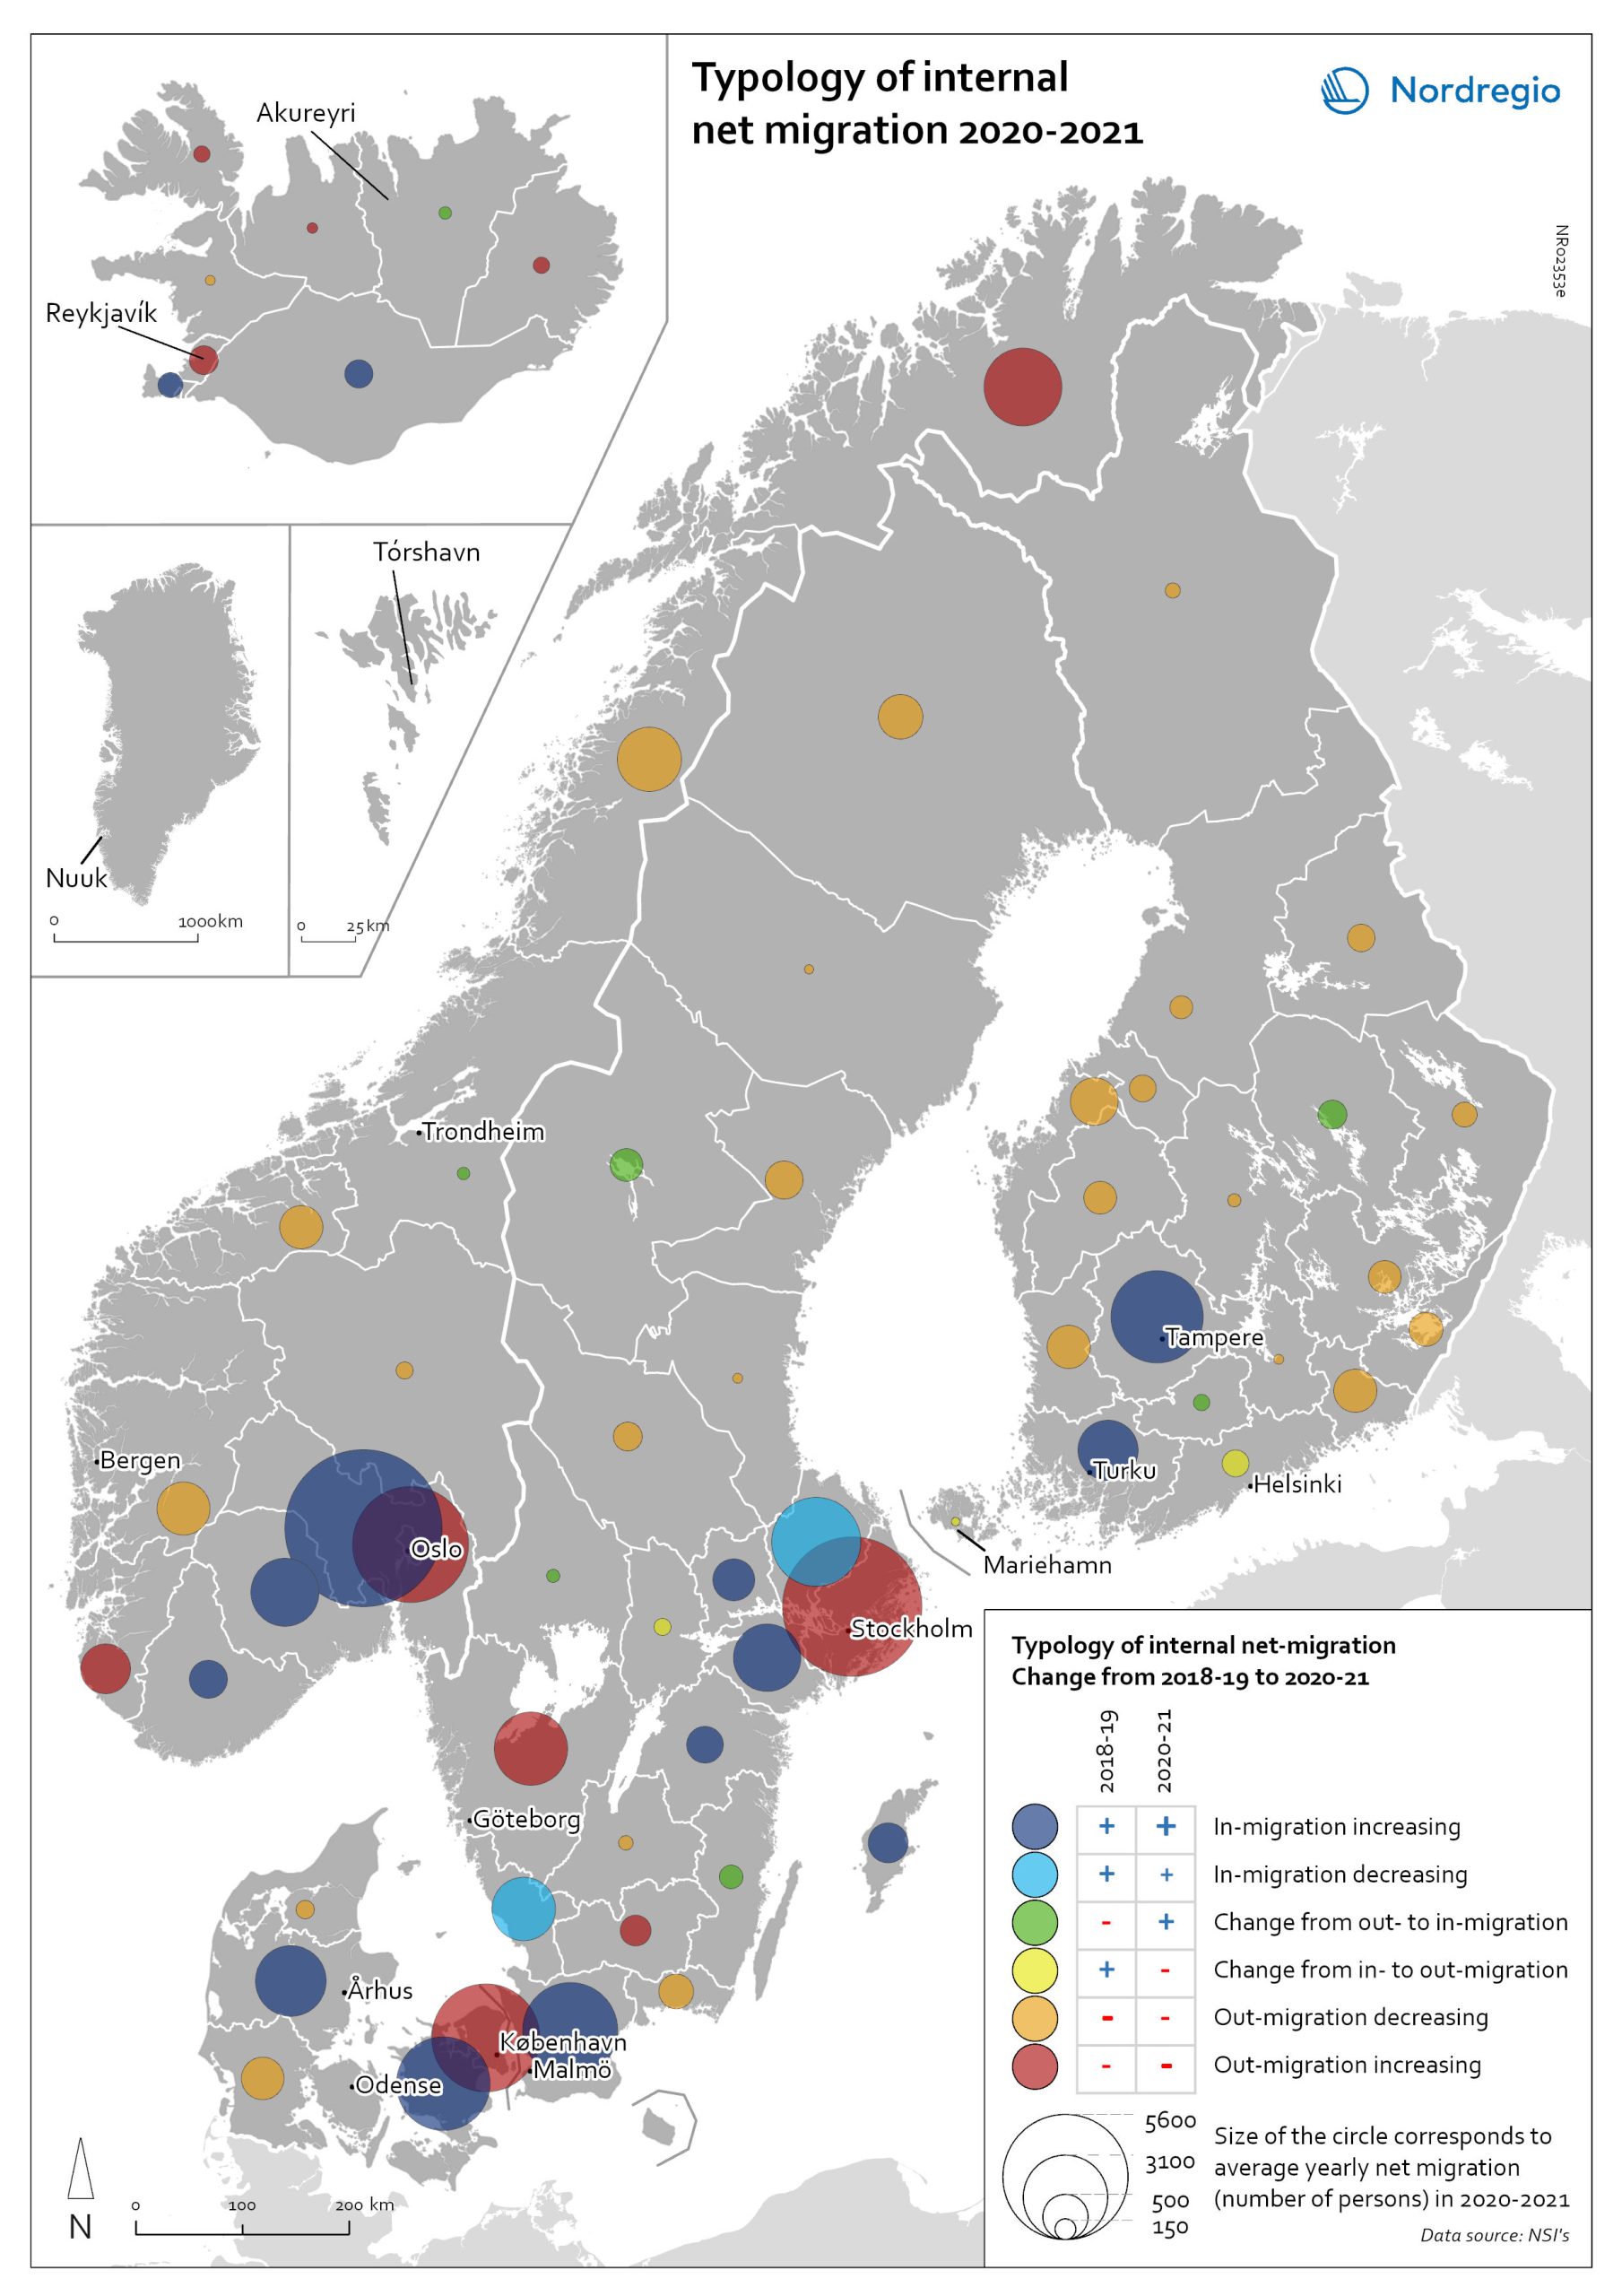
Typology of internal net migration 2020-2021
The map presents a typology of internal net migration by considering average annual internal net migration in 2020-2021 alongside the same figure for 2018-2019. The colours on the map correspond to six possible migration trajectories: Dark blue: Internal net in migration as an acceleration of an existing trend (net in-migration in 2020-2021 + increase compared to 2018-2019) Light blue: Internal net in migration but at a slower rate than previously (net in-migration in 2020-2021 + decrease compared to 2018-2019) Green: Internal net in migration as a new trend (net in-migration in 2020-2021 + change from net out-migration compared to 2018-2019) Yellow: Internal net out migration as a new trend (net out-migration in 2020-2021 + change from net in-migration compared to 2018-2019) Orange: Internal net out migration but at a slower rate than previously (net out-migration in 2020-2021 + decrease compared to 2018-2019) Red: Internal net out migration as a continuation of an existing trend (net out-migration in 2020-2021 + increase compared to 2018-2019) The patterns shown around the larger cities reinforces the message of increased suburbanisation as well as growth in smaller cities in proximity to large ones. In addition, the map shows that this is in many cases an accelerated (dark blue circles), or even new development (green circles). Interestingly, although accelerated by the pandemic, internal out migration from the capitals and other large cities was an existing trend. Helsinki stands out as an exception in this regard, having gone from positive to negative internal net migration (yellow circles). Similarly, slower rates of in migration are evident in the two next largest Finnish cities, Tampere and Turku (light blue circles). Akureyri (Iceland) provides an interesting example of an intermediate city which began to attract residents during the pandemic despite experiencing internal outmigration prior. From a rural perspective there are…
- 2022 May
- Demography
- Migration
- Nordic Region
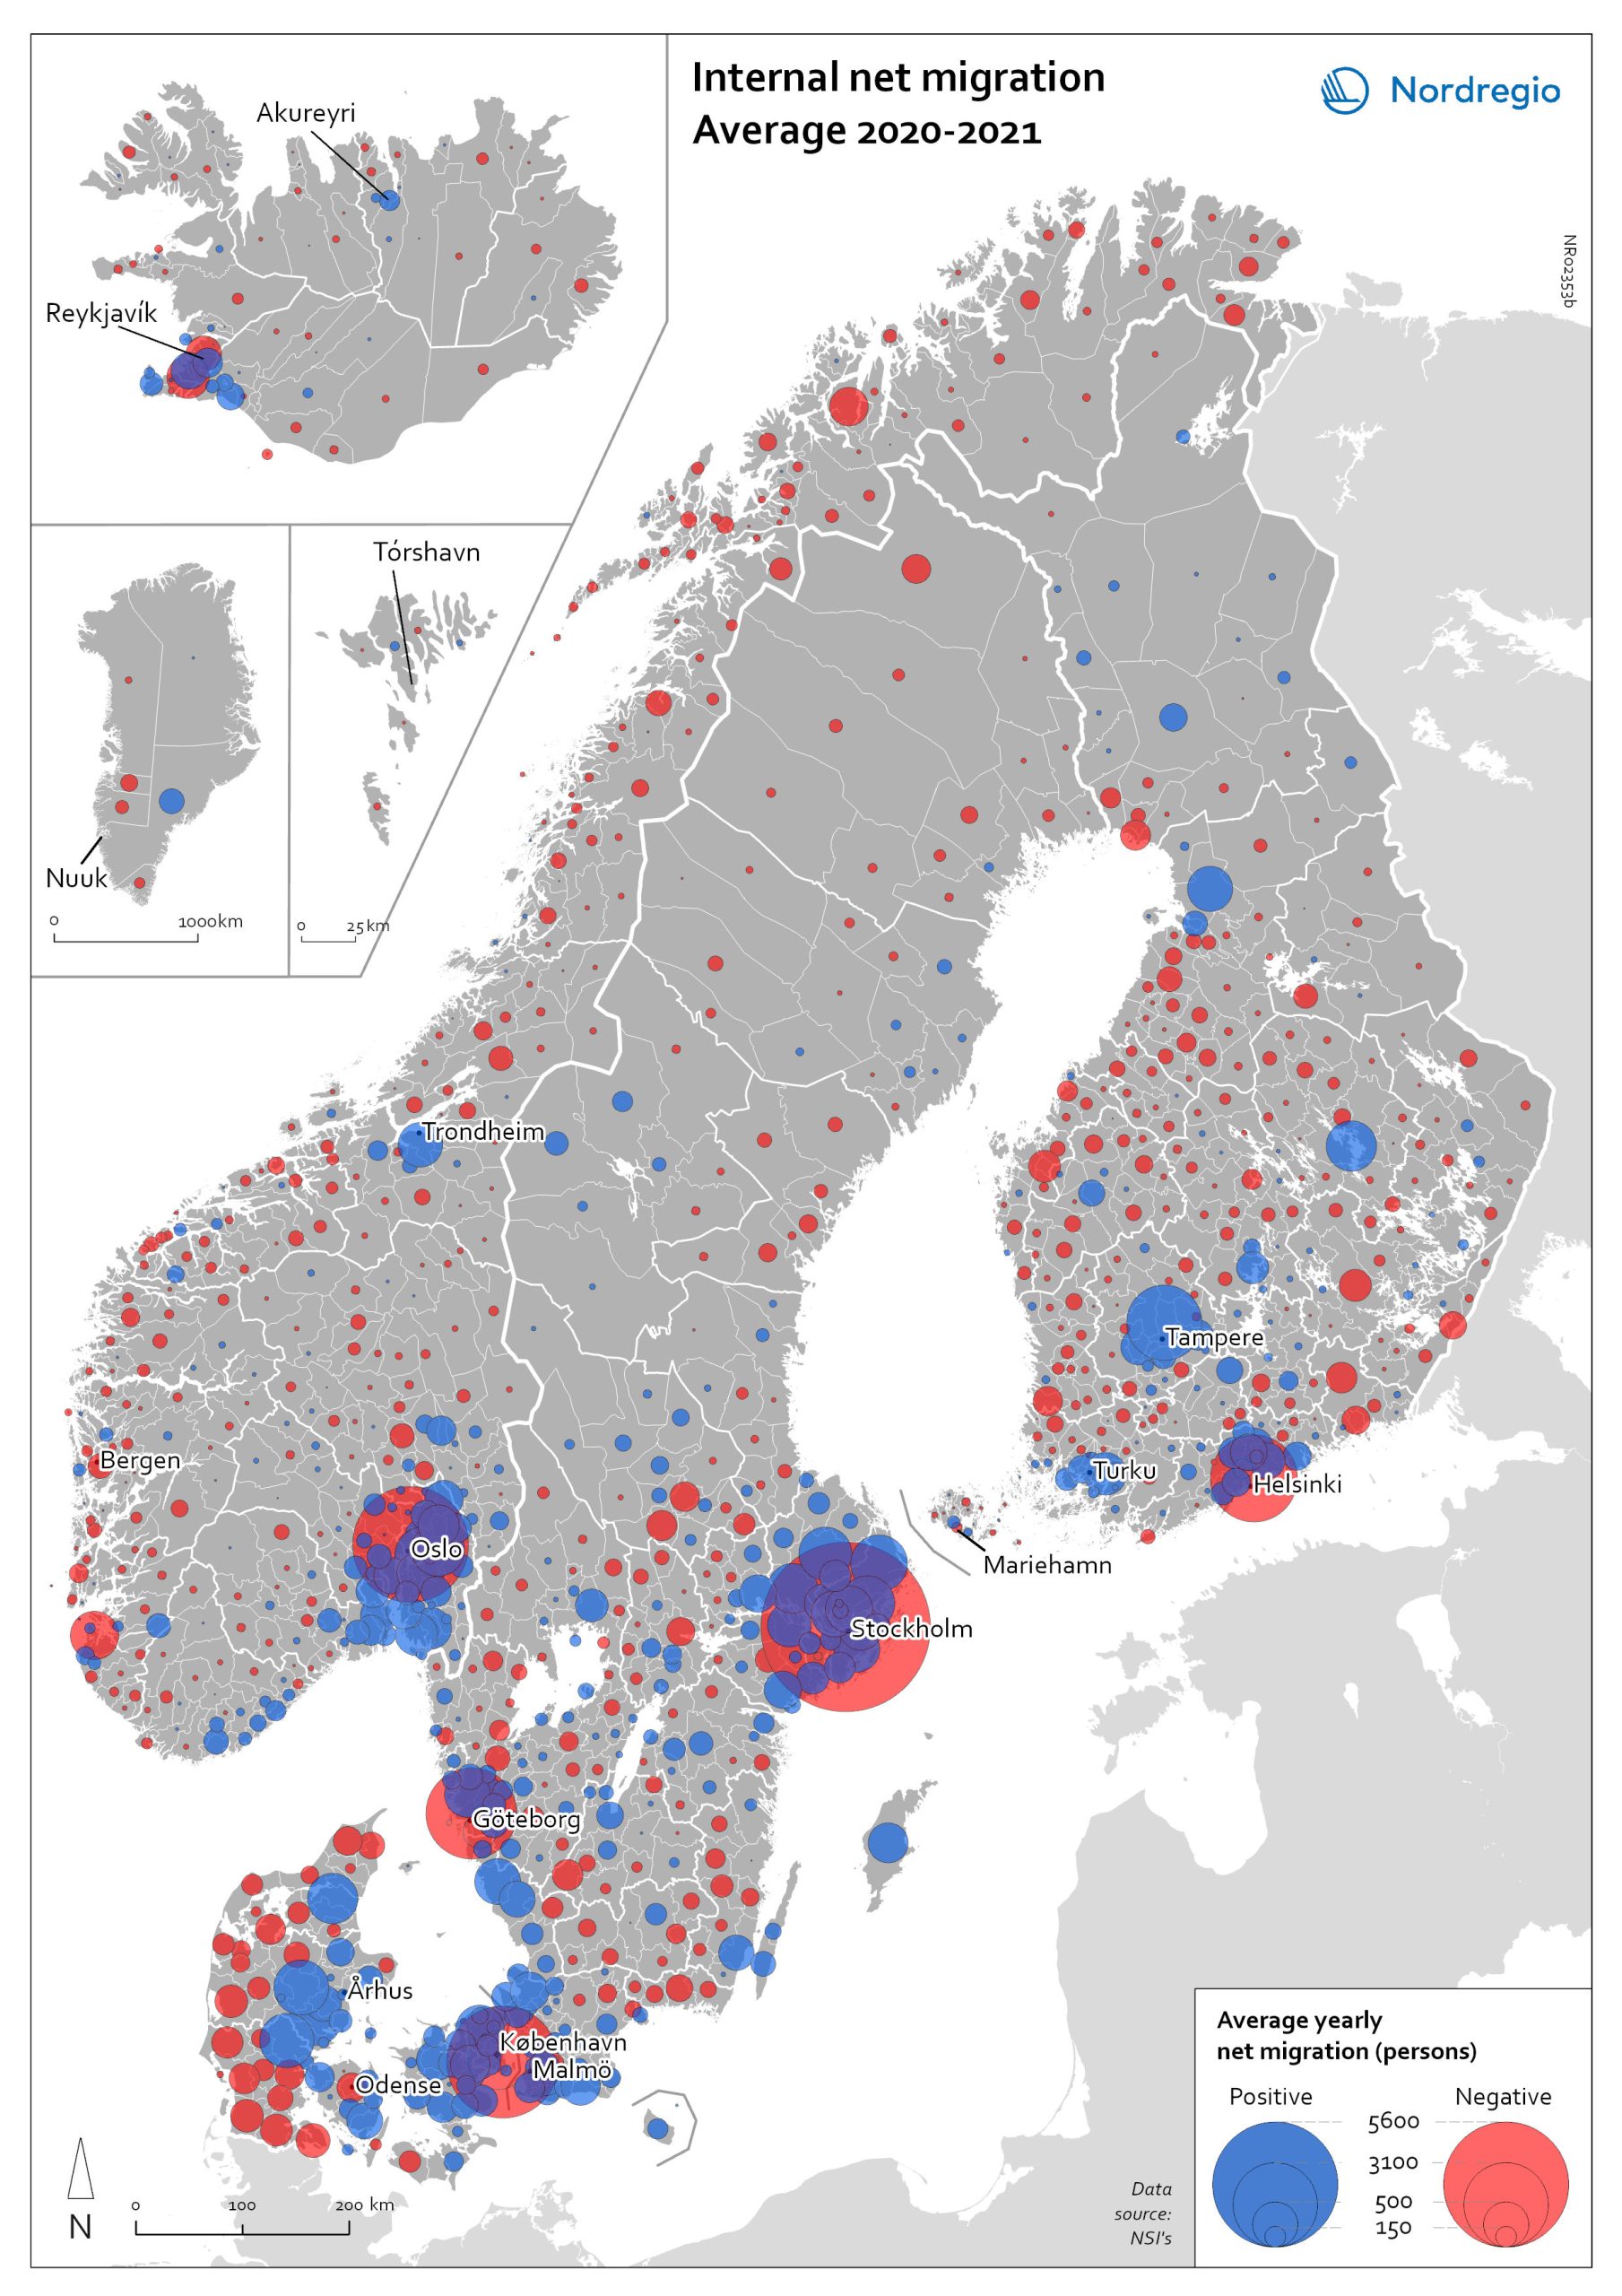
Internal net migration 2020-2021
The map shows the average internal net migration in 2020 and 2021 for Nordic municipalities. Blue dots indicate positive internal net migration (more people moving in than out) and red dots indicate negative internal net migration (more people moving out than in), while the size of the dots represents the extent of the positive or negative trend. Internal migration refers to a change of address within the same country. The map shows substantial outmigration from the Nordic capitals, as well as from Gothenburg and Malmö in Sweden. Alongside increased suburbanisation, the map also provides some evidence of growth in medium-sized cities and smaller cities within commuting distance of larger cities.
- 2022 May
- Demography
- Migration
- Nordic Region
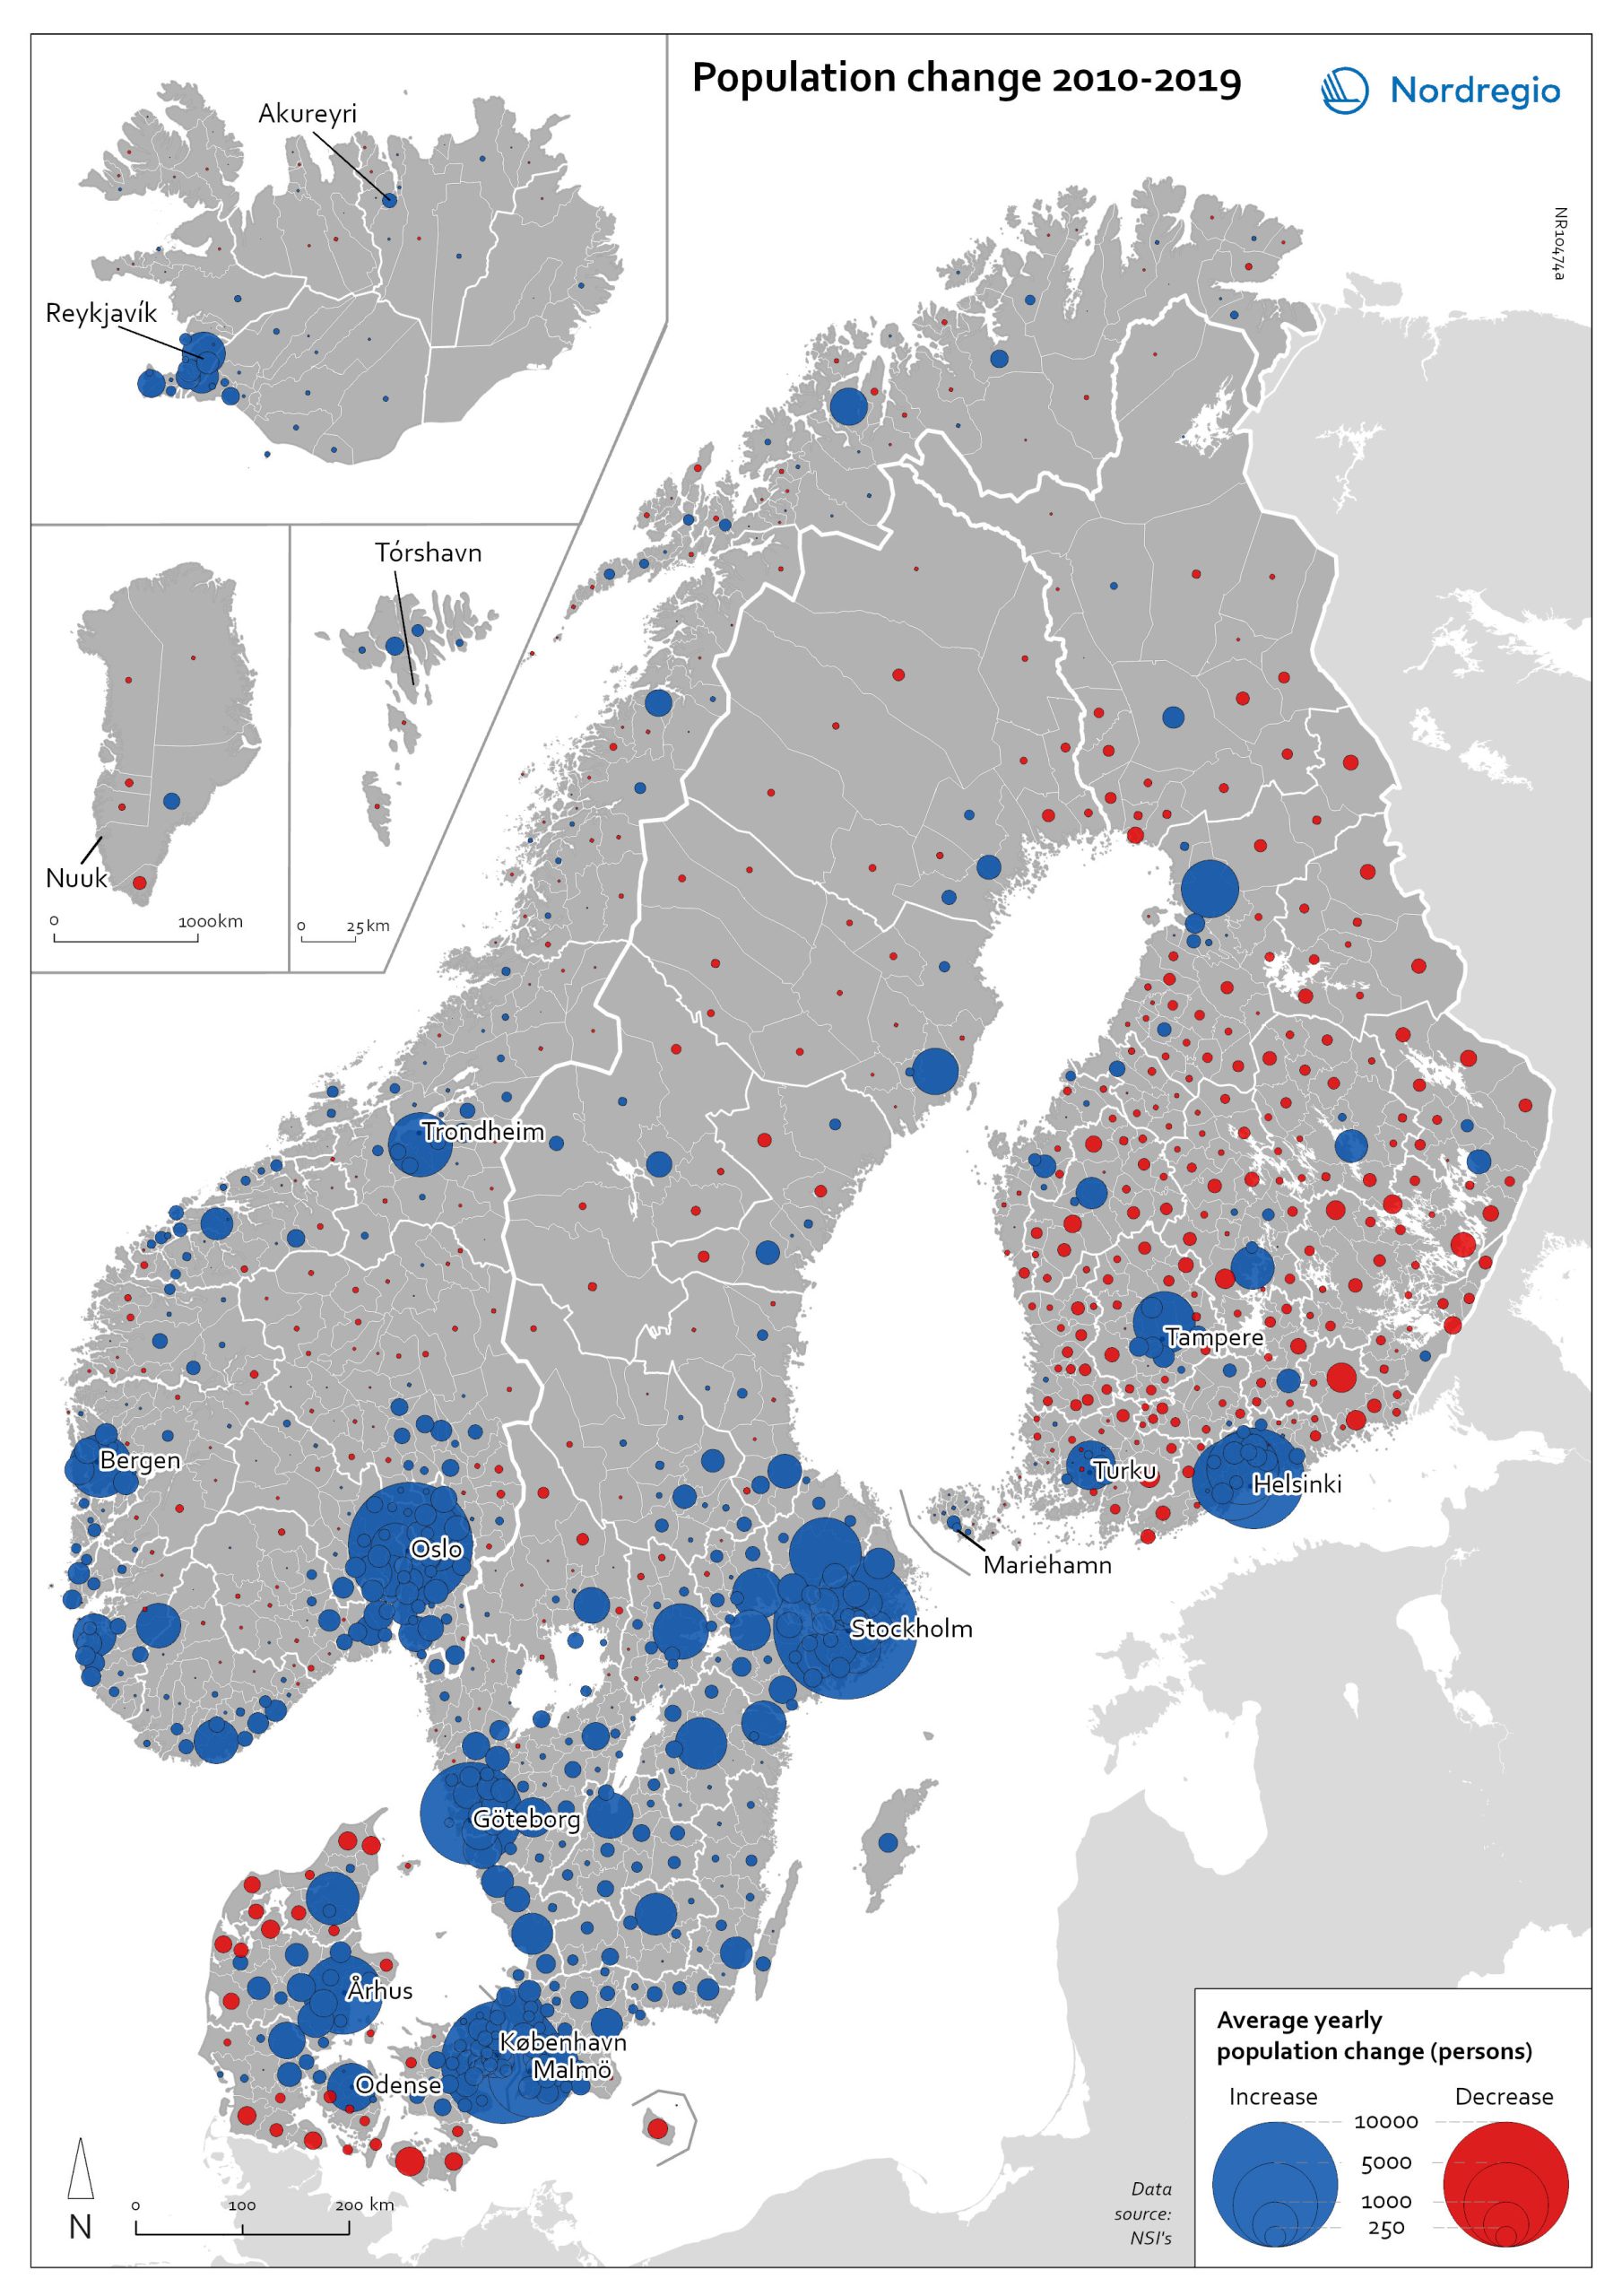
Population change 2010-2019
The map shows the type (positive or negative) and size of population change from 2010 to 2019 in all nordic municipalities. In Finland, Denmark, and Greenland there is a clear pattern of population growth in and around the larger cities and population decline in rural areas. Geographical and administrative differences mean that a much larger number of rural municipalities in Finland are dealing with population decline. Sweden experienced substantial population growth between 2010 and 2019, primarily due to high levels of international immigration. As a result, many rural areas also experienced population growth, particularly in the south of Sweden. However, in the more sparsely populated municipalities in the north of Sweden, the pattern is somewhat similar to that observed in Denmark and Finland, albeit with population decline in lower absolute numbers. Both Iceland and the Faroe Islands experienced substantial growth of their tourism industries within the period. This enabled some rural areas to maintain or even grow their populations. Norway exhibits more balanced population development in general, with a mix of population growth and decline in rural areas throughout the country.
- 2022 May
- Demography
- Migration
- Nordic Region
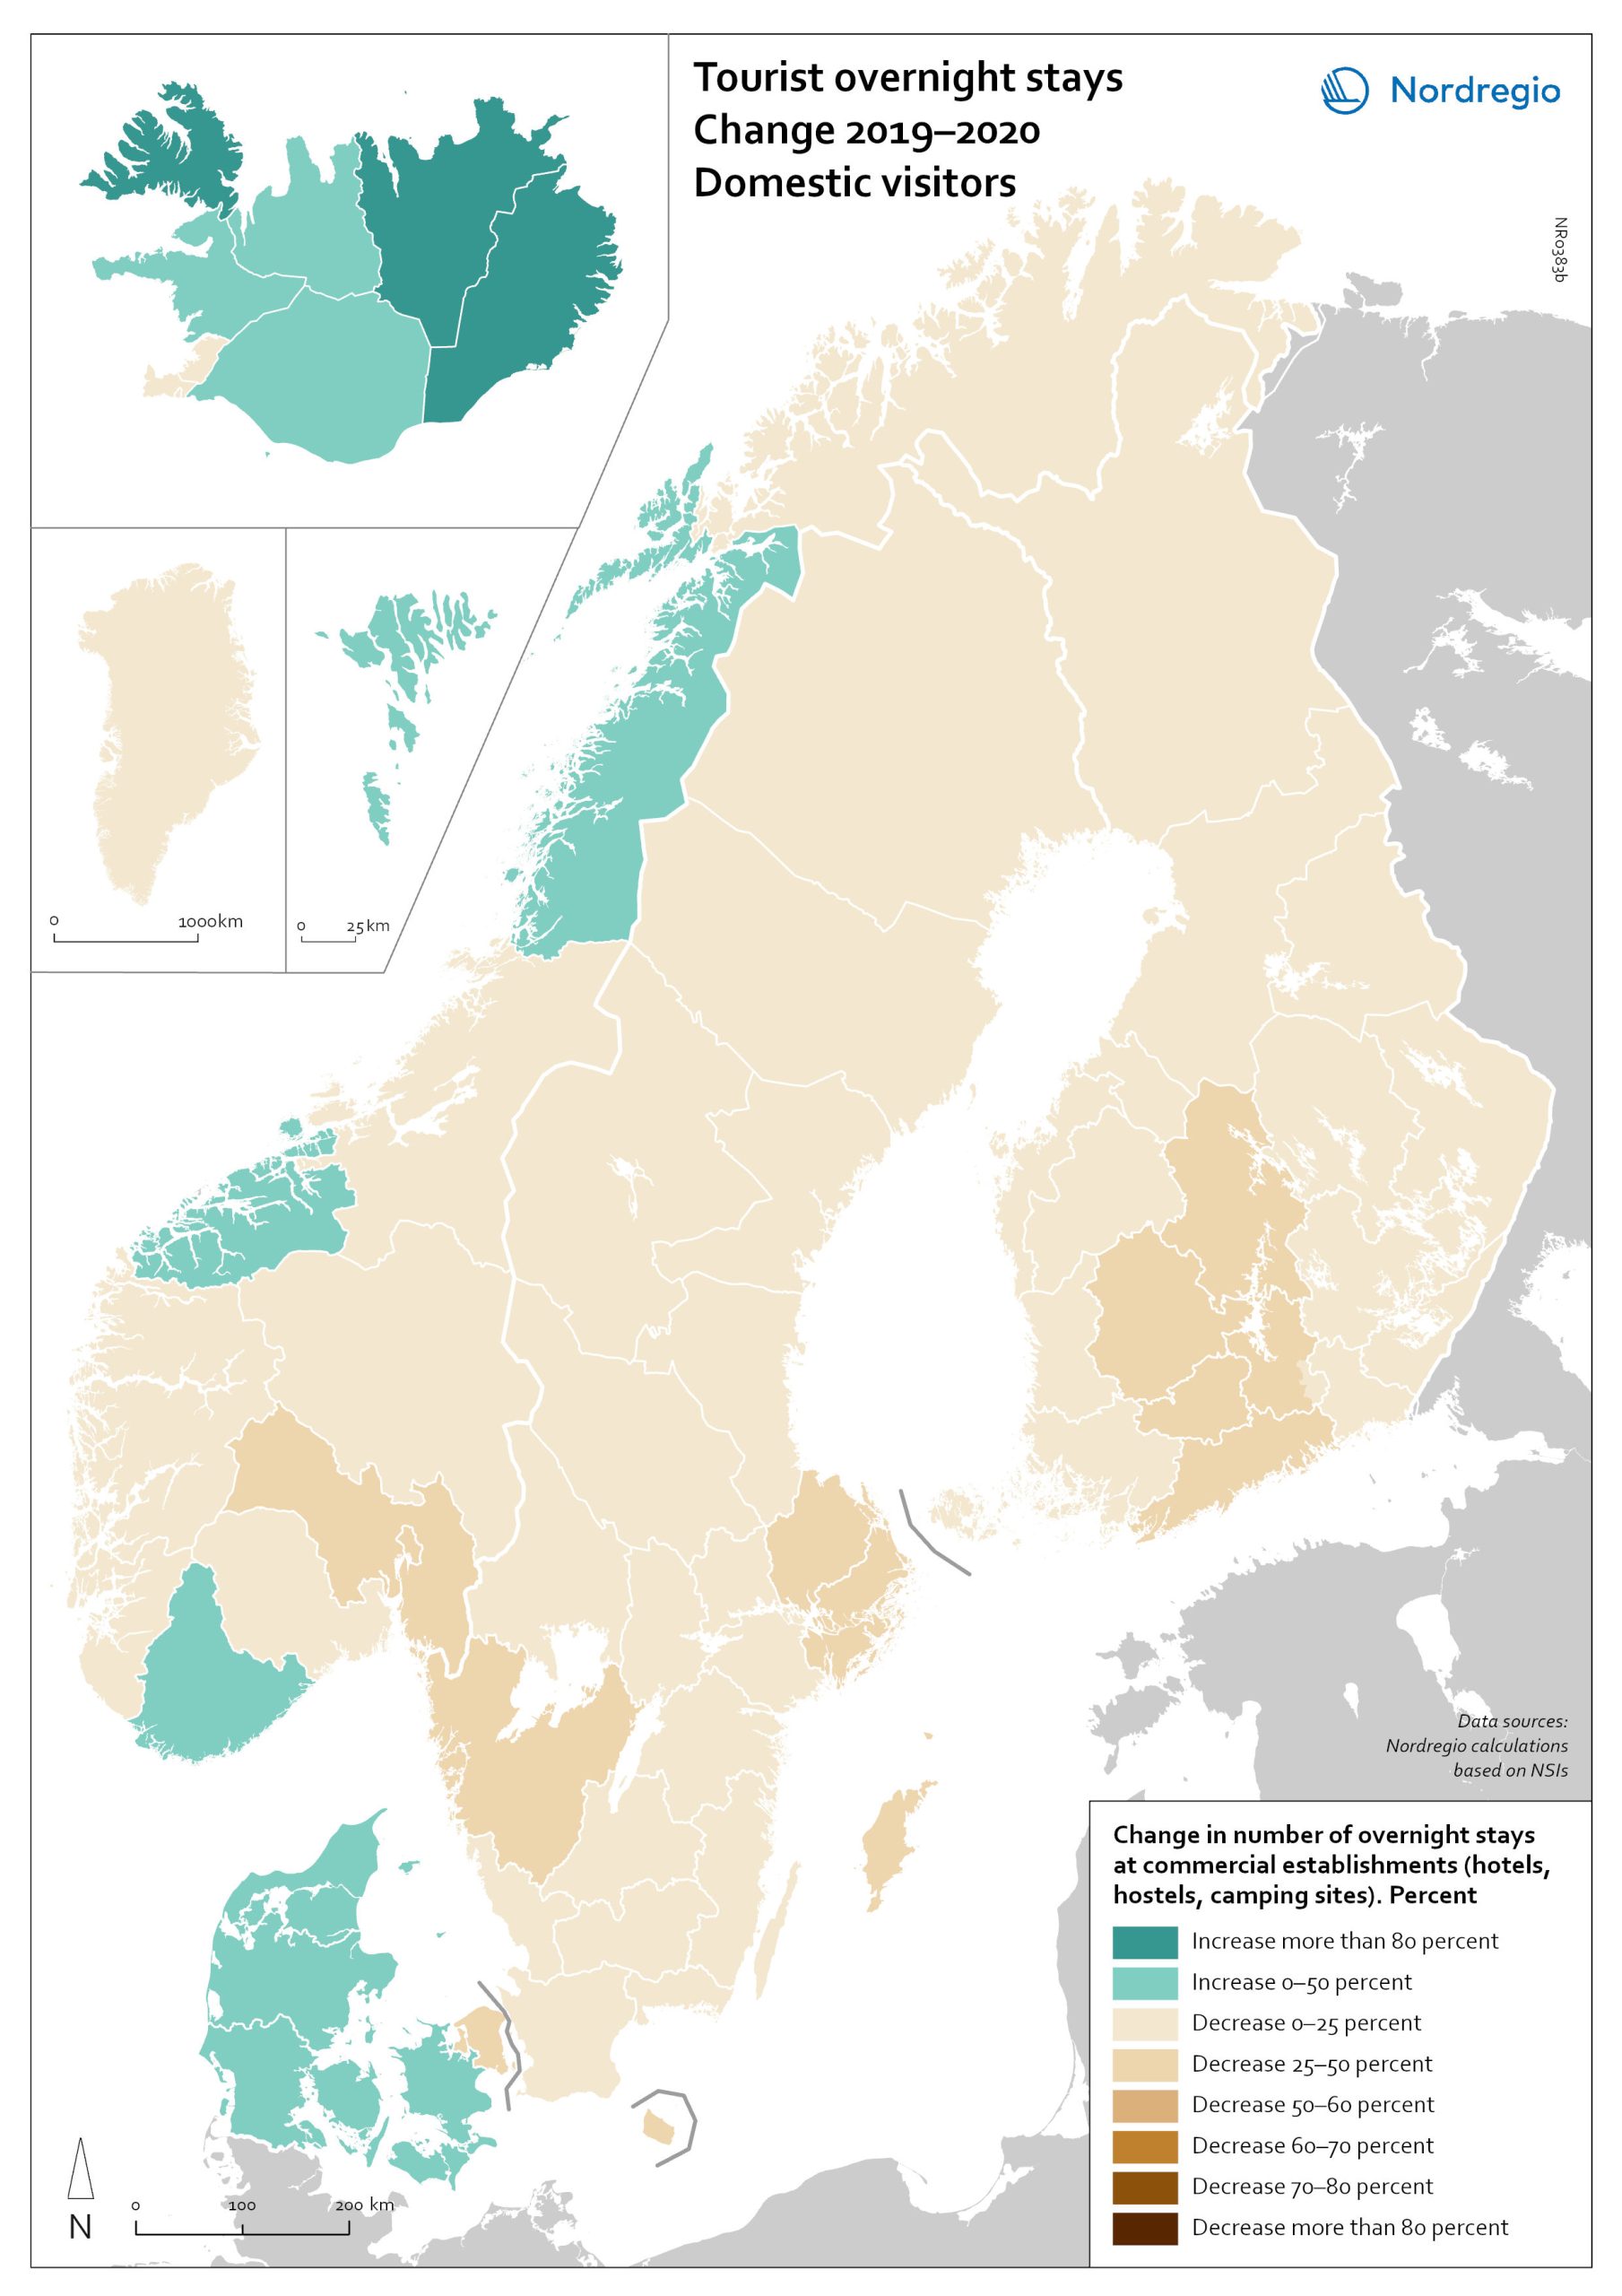
Change in overnight stays for domestic visitors 2019–2020
The map shows the relative change in the number of overnight stays at the regional level between 2019 and 2020 for domestic visitors. This map is related to the same map showing change in overnight stays for foreign visitors 2019–2020. The sharpest fall in visitors from abroad was in destinations where foreign tourists usually make up a high proportion of the total visitors. This is particularly relevant to islands like Åland (89% decrease on foreign visitors, from early 2019 to mid-2020) and to Iceland (66-77% drop depending on region). Lofoten and Nordland County in Norway, as well as Western Norway with Møre and Romsdal, which also have a high proportion of international tourists during the summer season due to their scenic landscape, also recorded sharp falls of 77-79% on foreign visitors during the same period. In Finland, the lake district (South Savo) and Southern Karelia, as well as the coastal Central Ostrobothnia (major cities Vasa and Karleby), recorded a 75-77% drop in the number of visitors from abroad. The fall here was mainly due to the lack of tourists from Russia. Even Finnish Lapland suffered a major fall in international visits during the winter peak period. For many local businesses that rely heavily on winter holidaymakers, the 2021/22 winter was a make-or-break season. In Sweden, the regions of Kalmar, Västra Götaland, Värmland and Örebro lost 77–79% of visitors from abroad, probably due to much fewer visitors from neighbouring Norway and from Denmark. In Denmark, the number of overnight stays by visitors from abroad to the Capital Region was down by 73%, whereas the number of domestic visitors declined by 27%. No region lost as many overnight visitors, both from abroad and domestic, as the capital cities and larger urban areas in the Nordic countries. Copenhagen, Oslo, Stockholm, Helsinki and Reykjavik…
- 2022 March
- Nordic Region
- Tourism
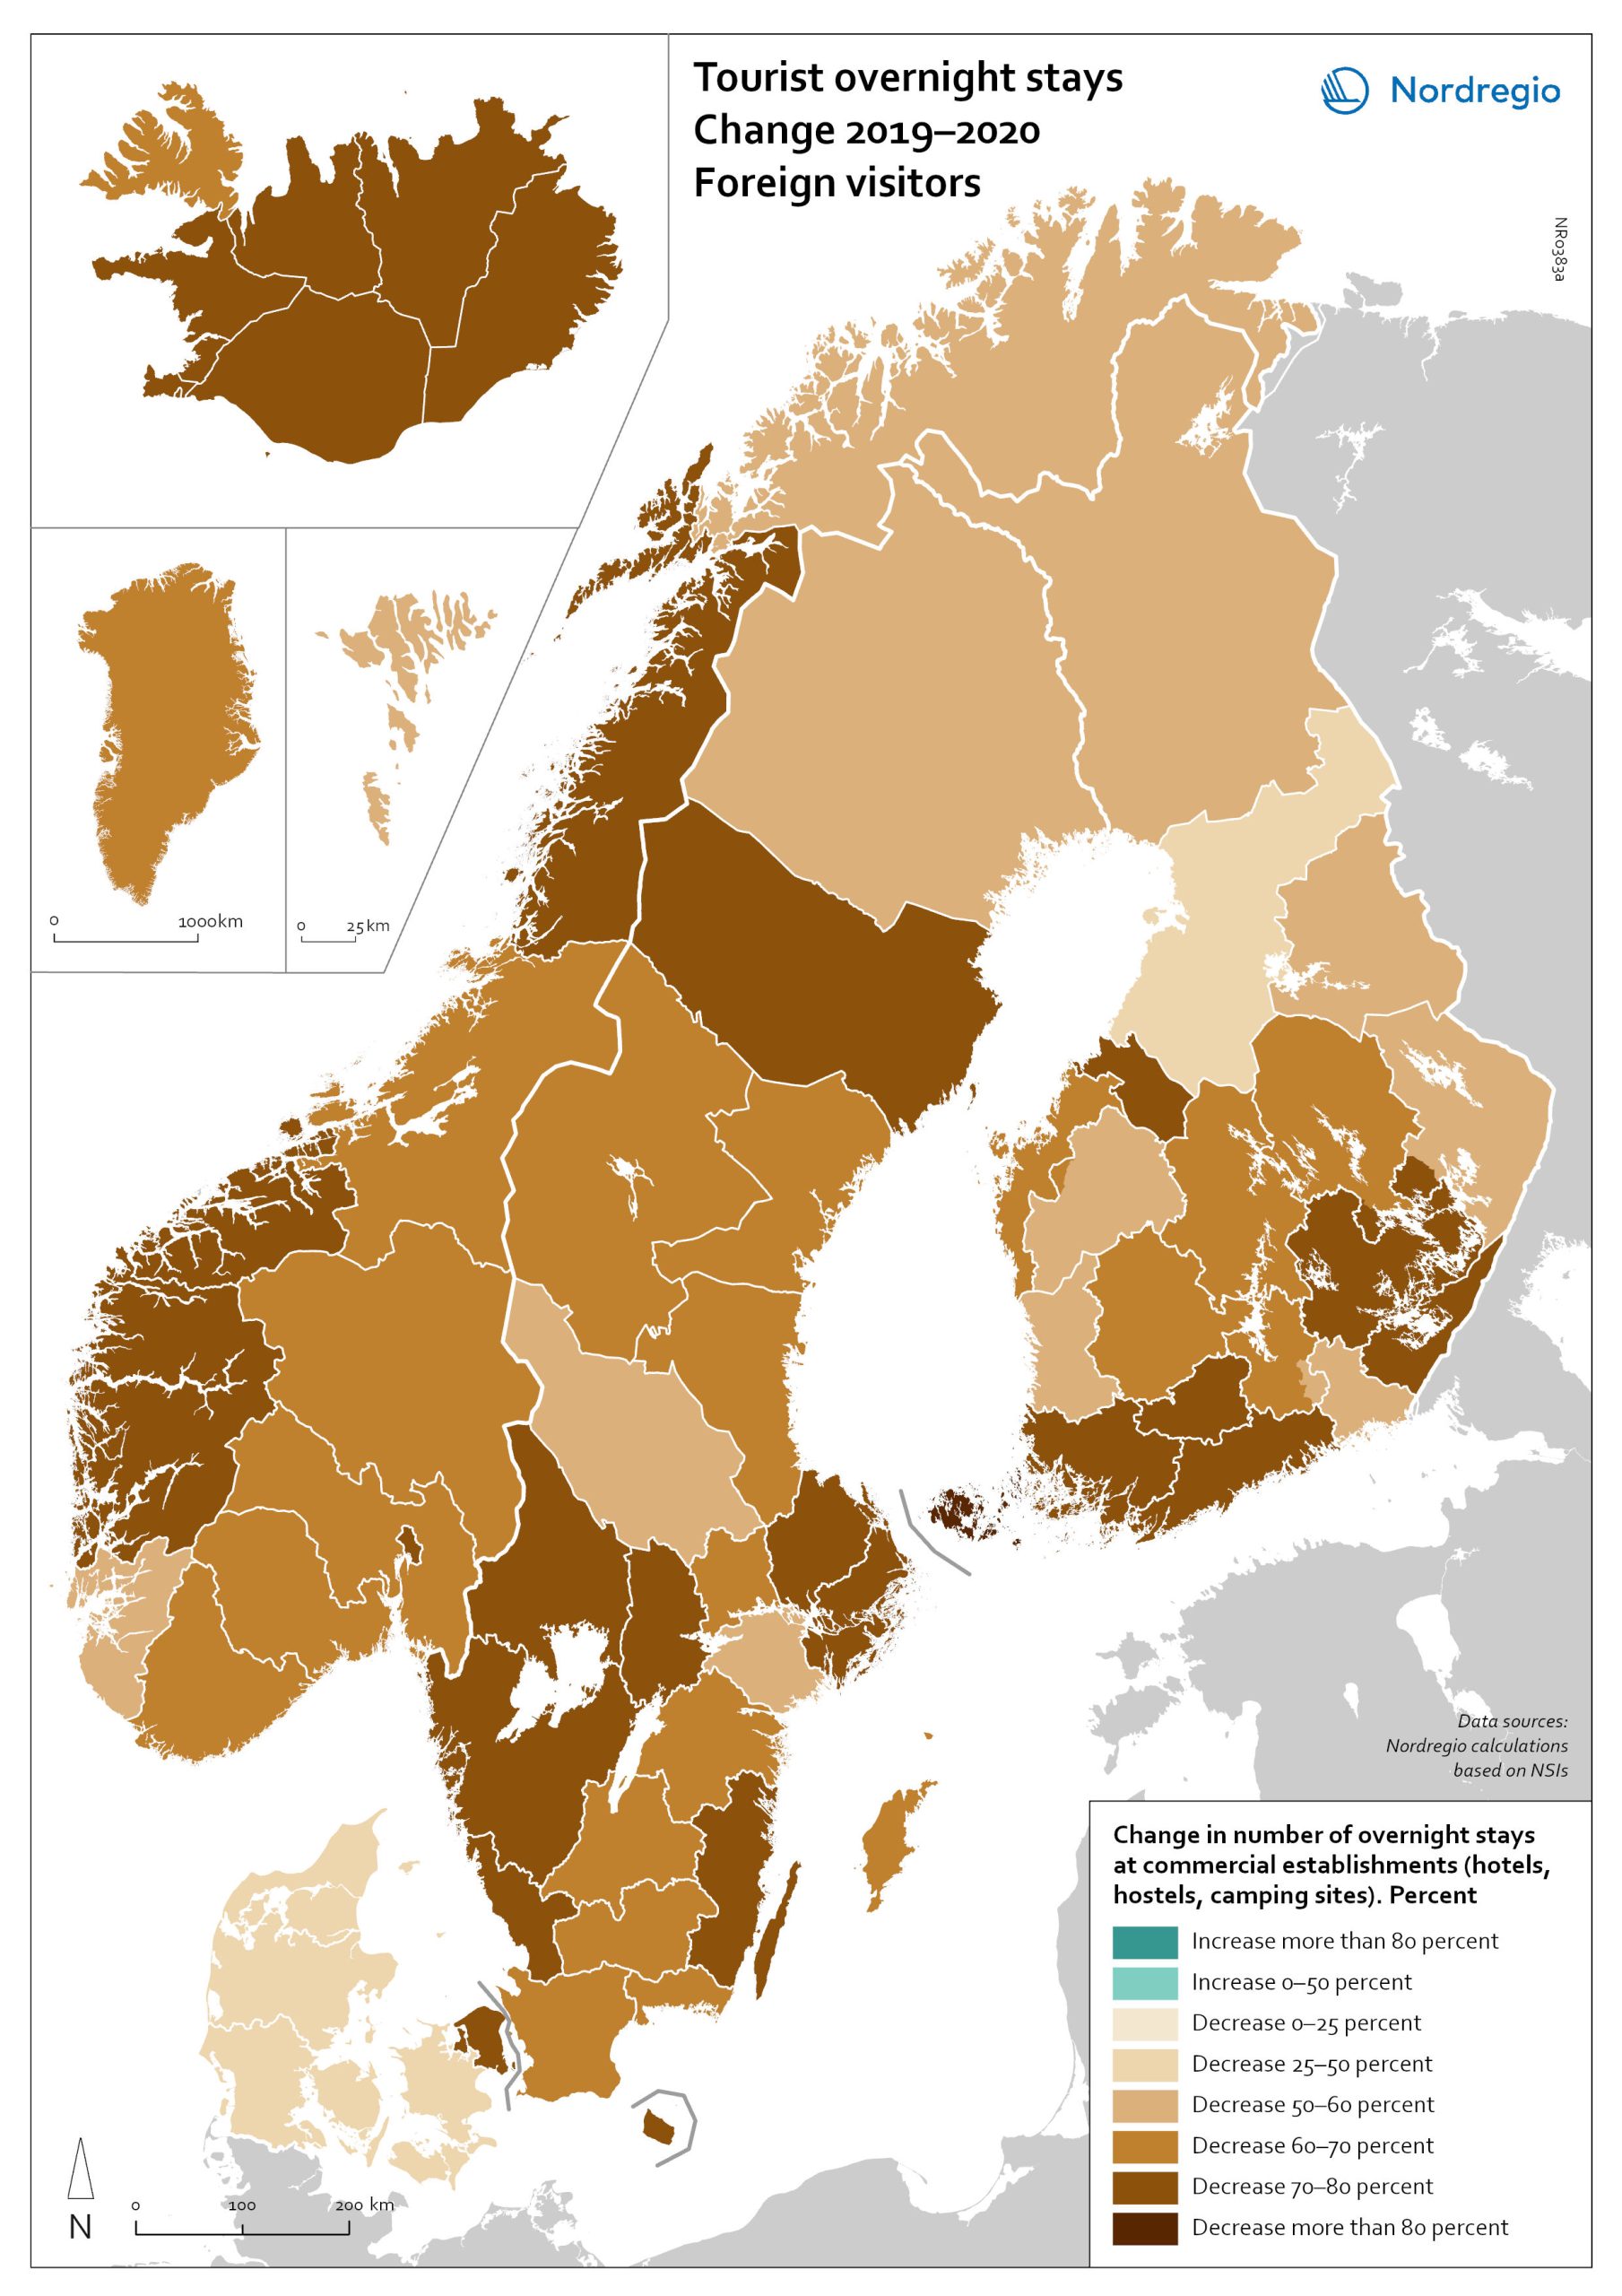
Change in overnight stays for foreign visitors 2019–2020
The map shows the relative change in the number of overnight stays at the regional level between 2019 and 2020 for foreign visitors. This map is related to the same map showing change in overnight stays for domestic visitors 2019–2020. The sharpest fall in visitors from abroad was in destinations where foreign tourists usually make up a high proportion of the total visitors. This is particularly relevant to islands like Åland (89% decrease on foreign visitors, from early 2019 to mid-2020) and to Iceland (66-77% drop depending on region). Lofoten and Nordland County in Norway, as well as Western Norway with Møre and Romsdal, which also have a high proportion of international tourists during the summer season due to their scenic landscape, also recorded sharp falls of 77-79% on foreign visitors during the same period. In Finland, the lake district (South Savo) and Southern Karelia, as well as the coastal Central Ostrobothnia (major cities Vasa and Karleby), recorded a 75-77% drop in the number of visitors from abroad. The fall here was mainly due to the lack of tourists from Russia. Even Finnish Lapland suffered a major fall in international visits during the winter peak period. For many local businesses that rely heavily on winter holidaymakers, the 2021/22 winter was a make-or-break season. In Sweden, the regions of Kalmar, Västra Götaland, Värmland and Örebro lost 77–79% of visitors from abroad, probably due to much fewer visitors from neighbouring Norway and from Denmark. In Denmark, the number of overnight stays by visitors from abroad to the Capital Region was down by 73%, whereas the number of domestic visitors declined by 27%. No region lost as many overnight visitors, both from abroad and domestic, as the capital cities and larger urban areas in the Nordic countries. Copenhagen, Oslo, Stockholm, Helsinki and Reykjavik…
- 2022 March
- Nordic Region
- Tourism
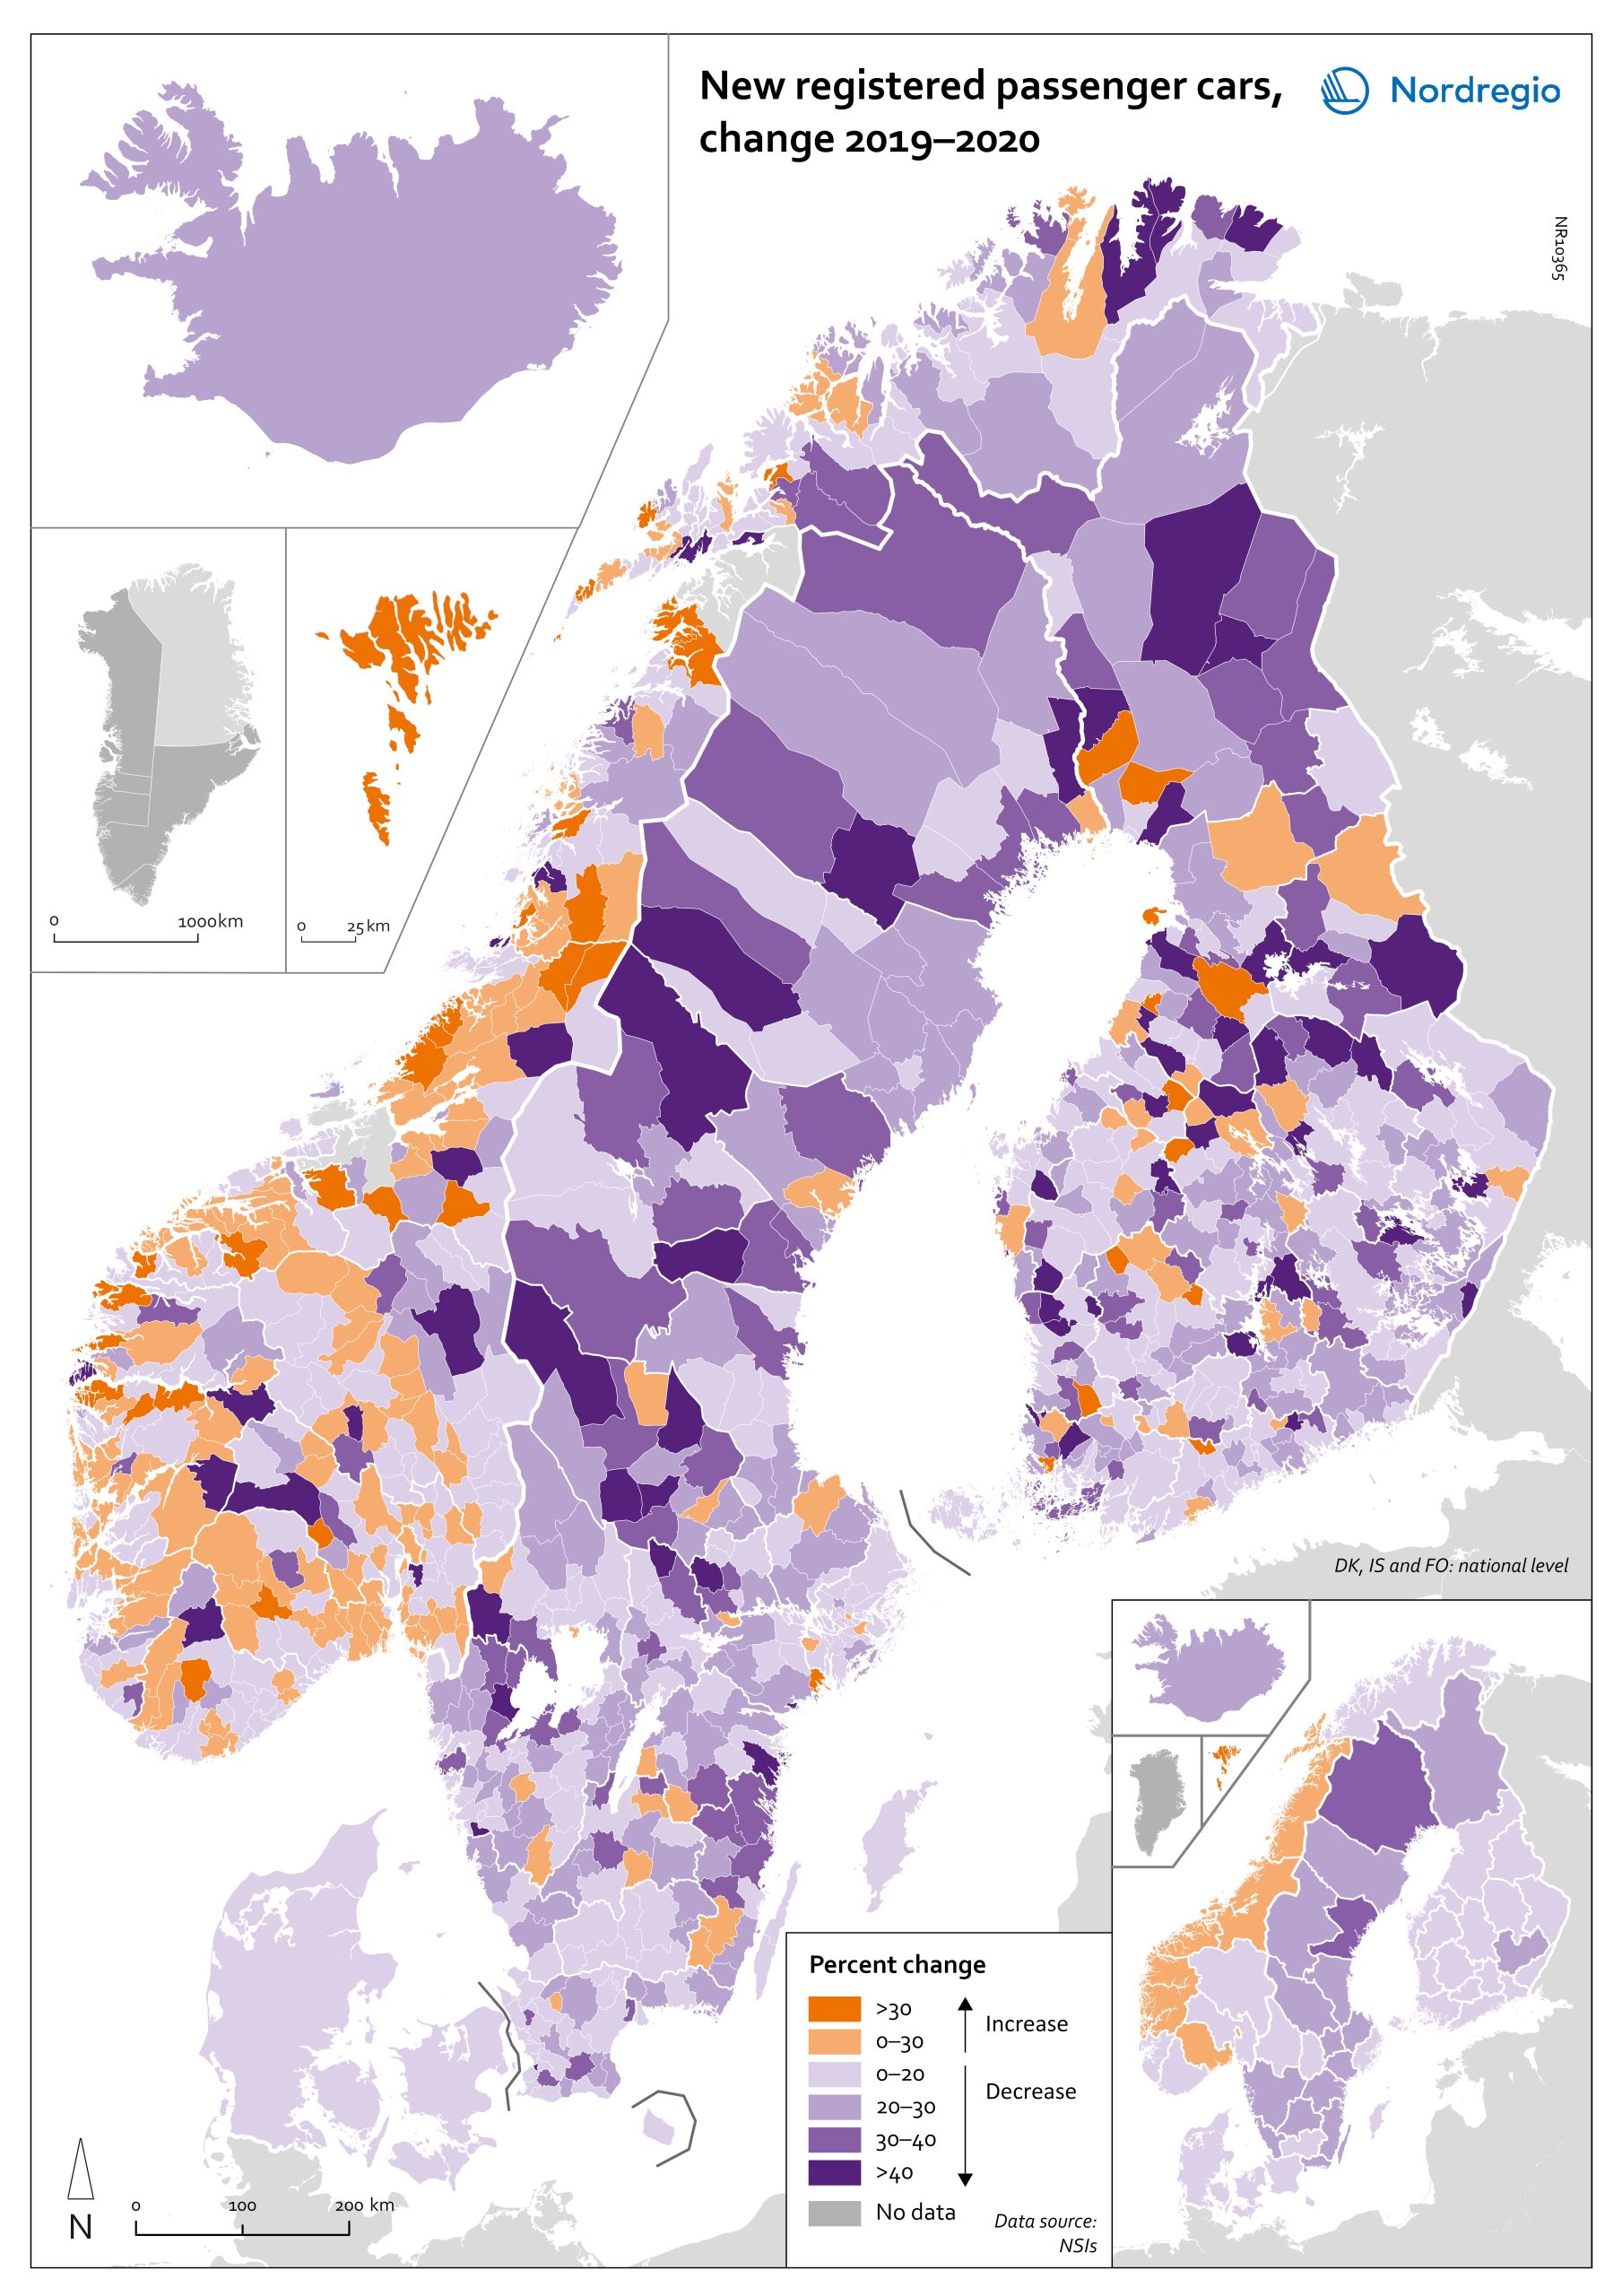
Change in new registered cars 2019-2020
The map shows the change in new registered passenger cars from 2019 to 2020. In most countries, the number of car registrations fell in 2020 compared to 2019. On a global scale, it is estimated that sales of motor vehicles fell by 14%. In the EU, passenger car registrations during the first three quarters of 2020 dropped by 28.8%. The recovery of consumption during Q4 2020 brought the total contraction for the year down to 23.7%, or 3 million fewer cars sold than in 2019. In the Nordic countries, consumer behaviour was consistent overall with the EU and the rest of the world. However, Iceland, Sweden, Finland, Åland, and Denmark recorded falls of 22%–11% – a far more severe decline than Norway, where the market only fell by 2.0%. The Faroe Islands was the only Nordic country to record more car registrations, up 15.8% in 2020 compared to 2019. In Finland, Iceland, Norway, and Sweden, there were differences in car registrations in different parts of the country. In Sweden and Finland, the position was more or less the same in the whole of the country, with only a few municipalities sticking out. In Finland and Sweden, net increases in car registrations were concentrated in rural areas, while in major urban areas, such as Uusimaa-Nyland in Finland and Västra Götaland and Stockholm in Sweden, car sales fell between 10%–22%. Net increases in Norway were recorded in many municipalities throughout the whole country in 2020 compared to 2019.
- 2022 March
- Economy
- Nordic Region
- Transport
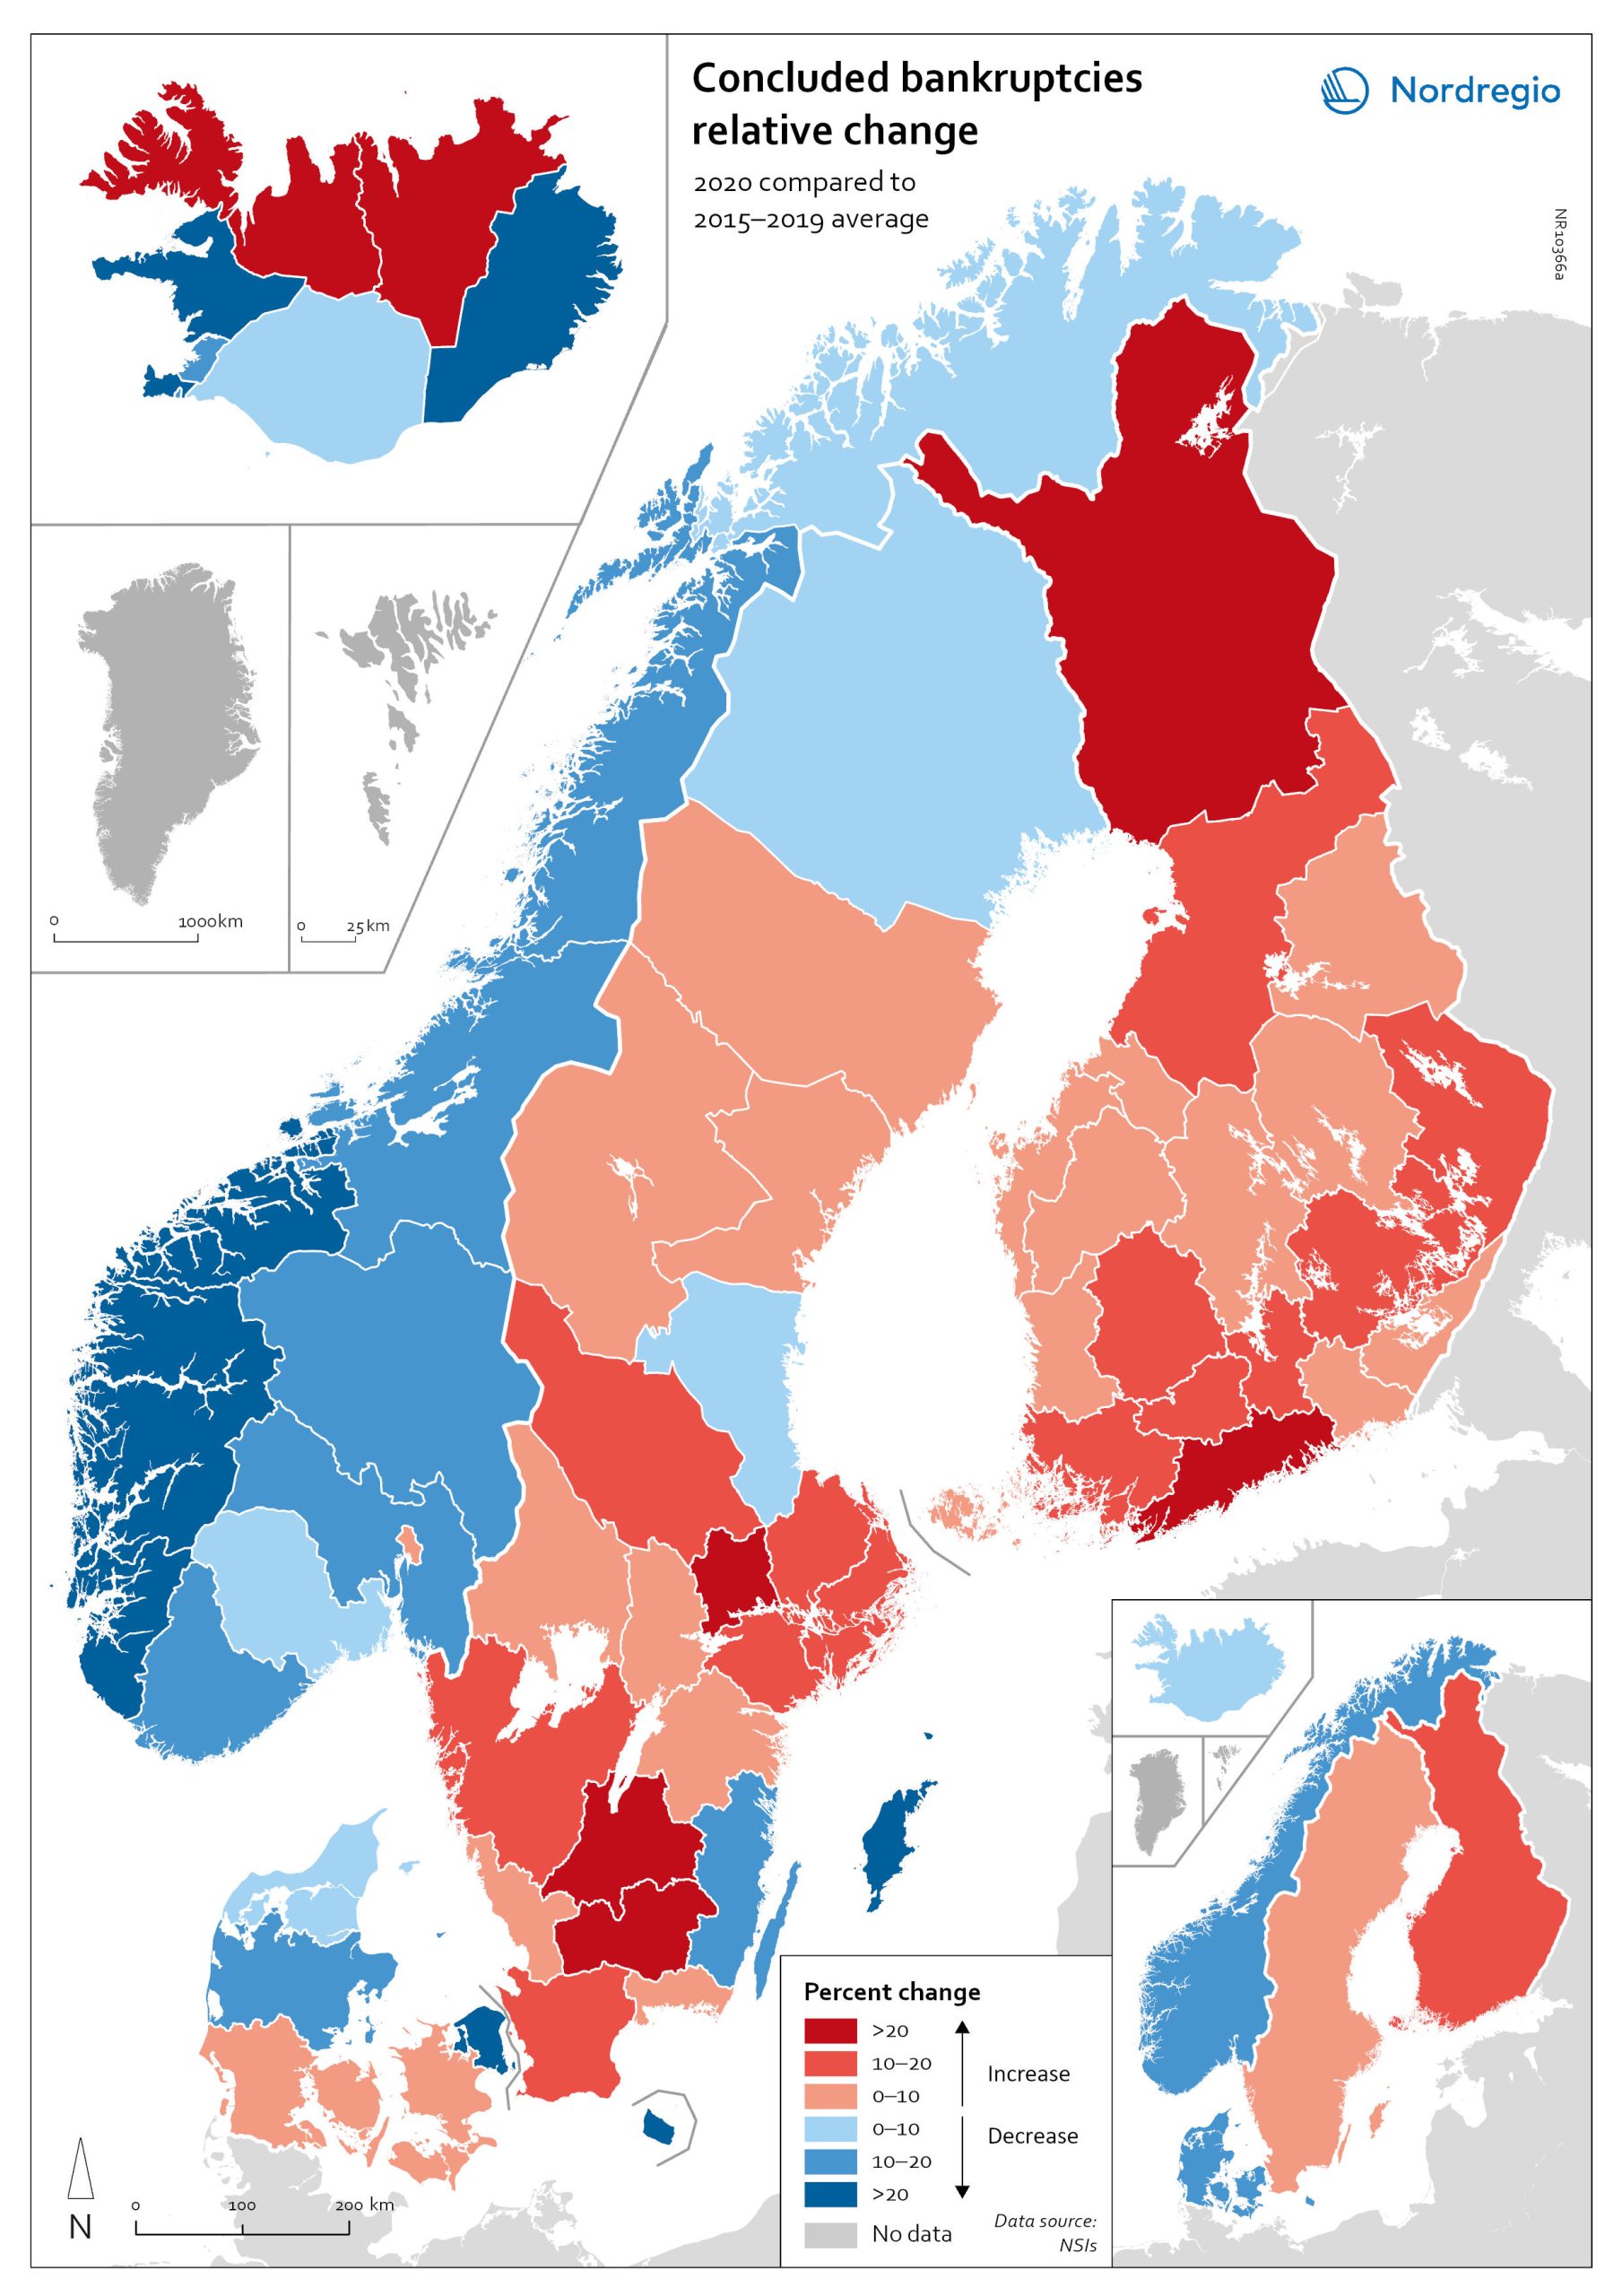
Relative change in the number of business bankruptcies
The map shows the relative change in the number of concluded business bankruptcies by region, 2015–2019 average compared to 2020. At sub-national levels, the distribution of business bankruptcies does not show a clear territorial pattern. In Iceland and Denmark, businesses in the most urbanised areas, including the capital regions, seem to have been those that benefited most from the economic mitigation measures (-23.9% in Höfuðborgarsvæðið and -24.4% in Region Hovedstaden). By contrast, Oslo is the only Norwegian region where there were more business bankruptcies in 2020 compared to the 2015–2019 baseline (1.9% increase). Most Norwegian regions did, in fact, have fewer bankruptcies in 2020, particularly in the western regions. One plausible explanation for this could be that the number of business failures during the baseline period was especially high in western Norway due to the fall in oil prices in 2014–2015. In Sweden the situation is even more mixed. Here, businesses in urban areas seem to have been more exposed to the distress caused by the Covid-19 pandemic. The most urbanised regions in the Stockholm-Gothenburg-Malmö corridor registered a greater increase in liquidations (Jönköping, Kronoberg and Södermanland regions saw surges of around 20%). However, predominantly rural regions in Sweden, such as Västerbotten and Jämtland, also recorded higher numbers of bankruptcies than average (9.8% and 8.8% increase, respectively). In Finland, the impact was greater in Lapland (26.9%) and around Helsinki (Uusimaa, 25.9%) than in the central parts of the country. Åland also experienced a moderate rise in business bankruptcies in 2020 (4.0%), mostly related to the tourism sector.
- 2022 March
- Economy
- Nordic Region
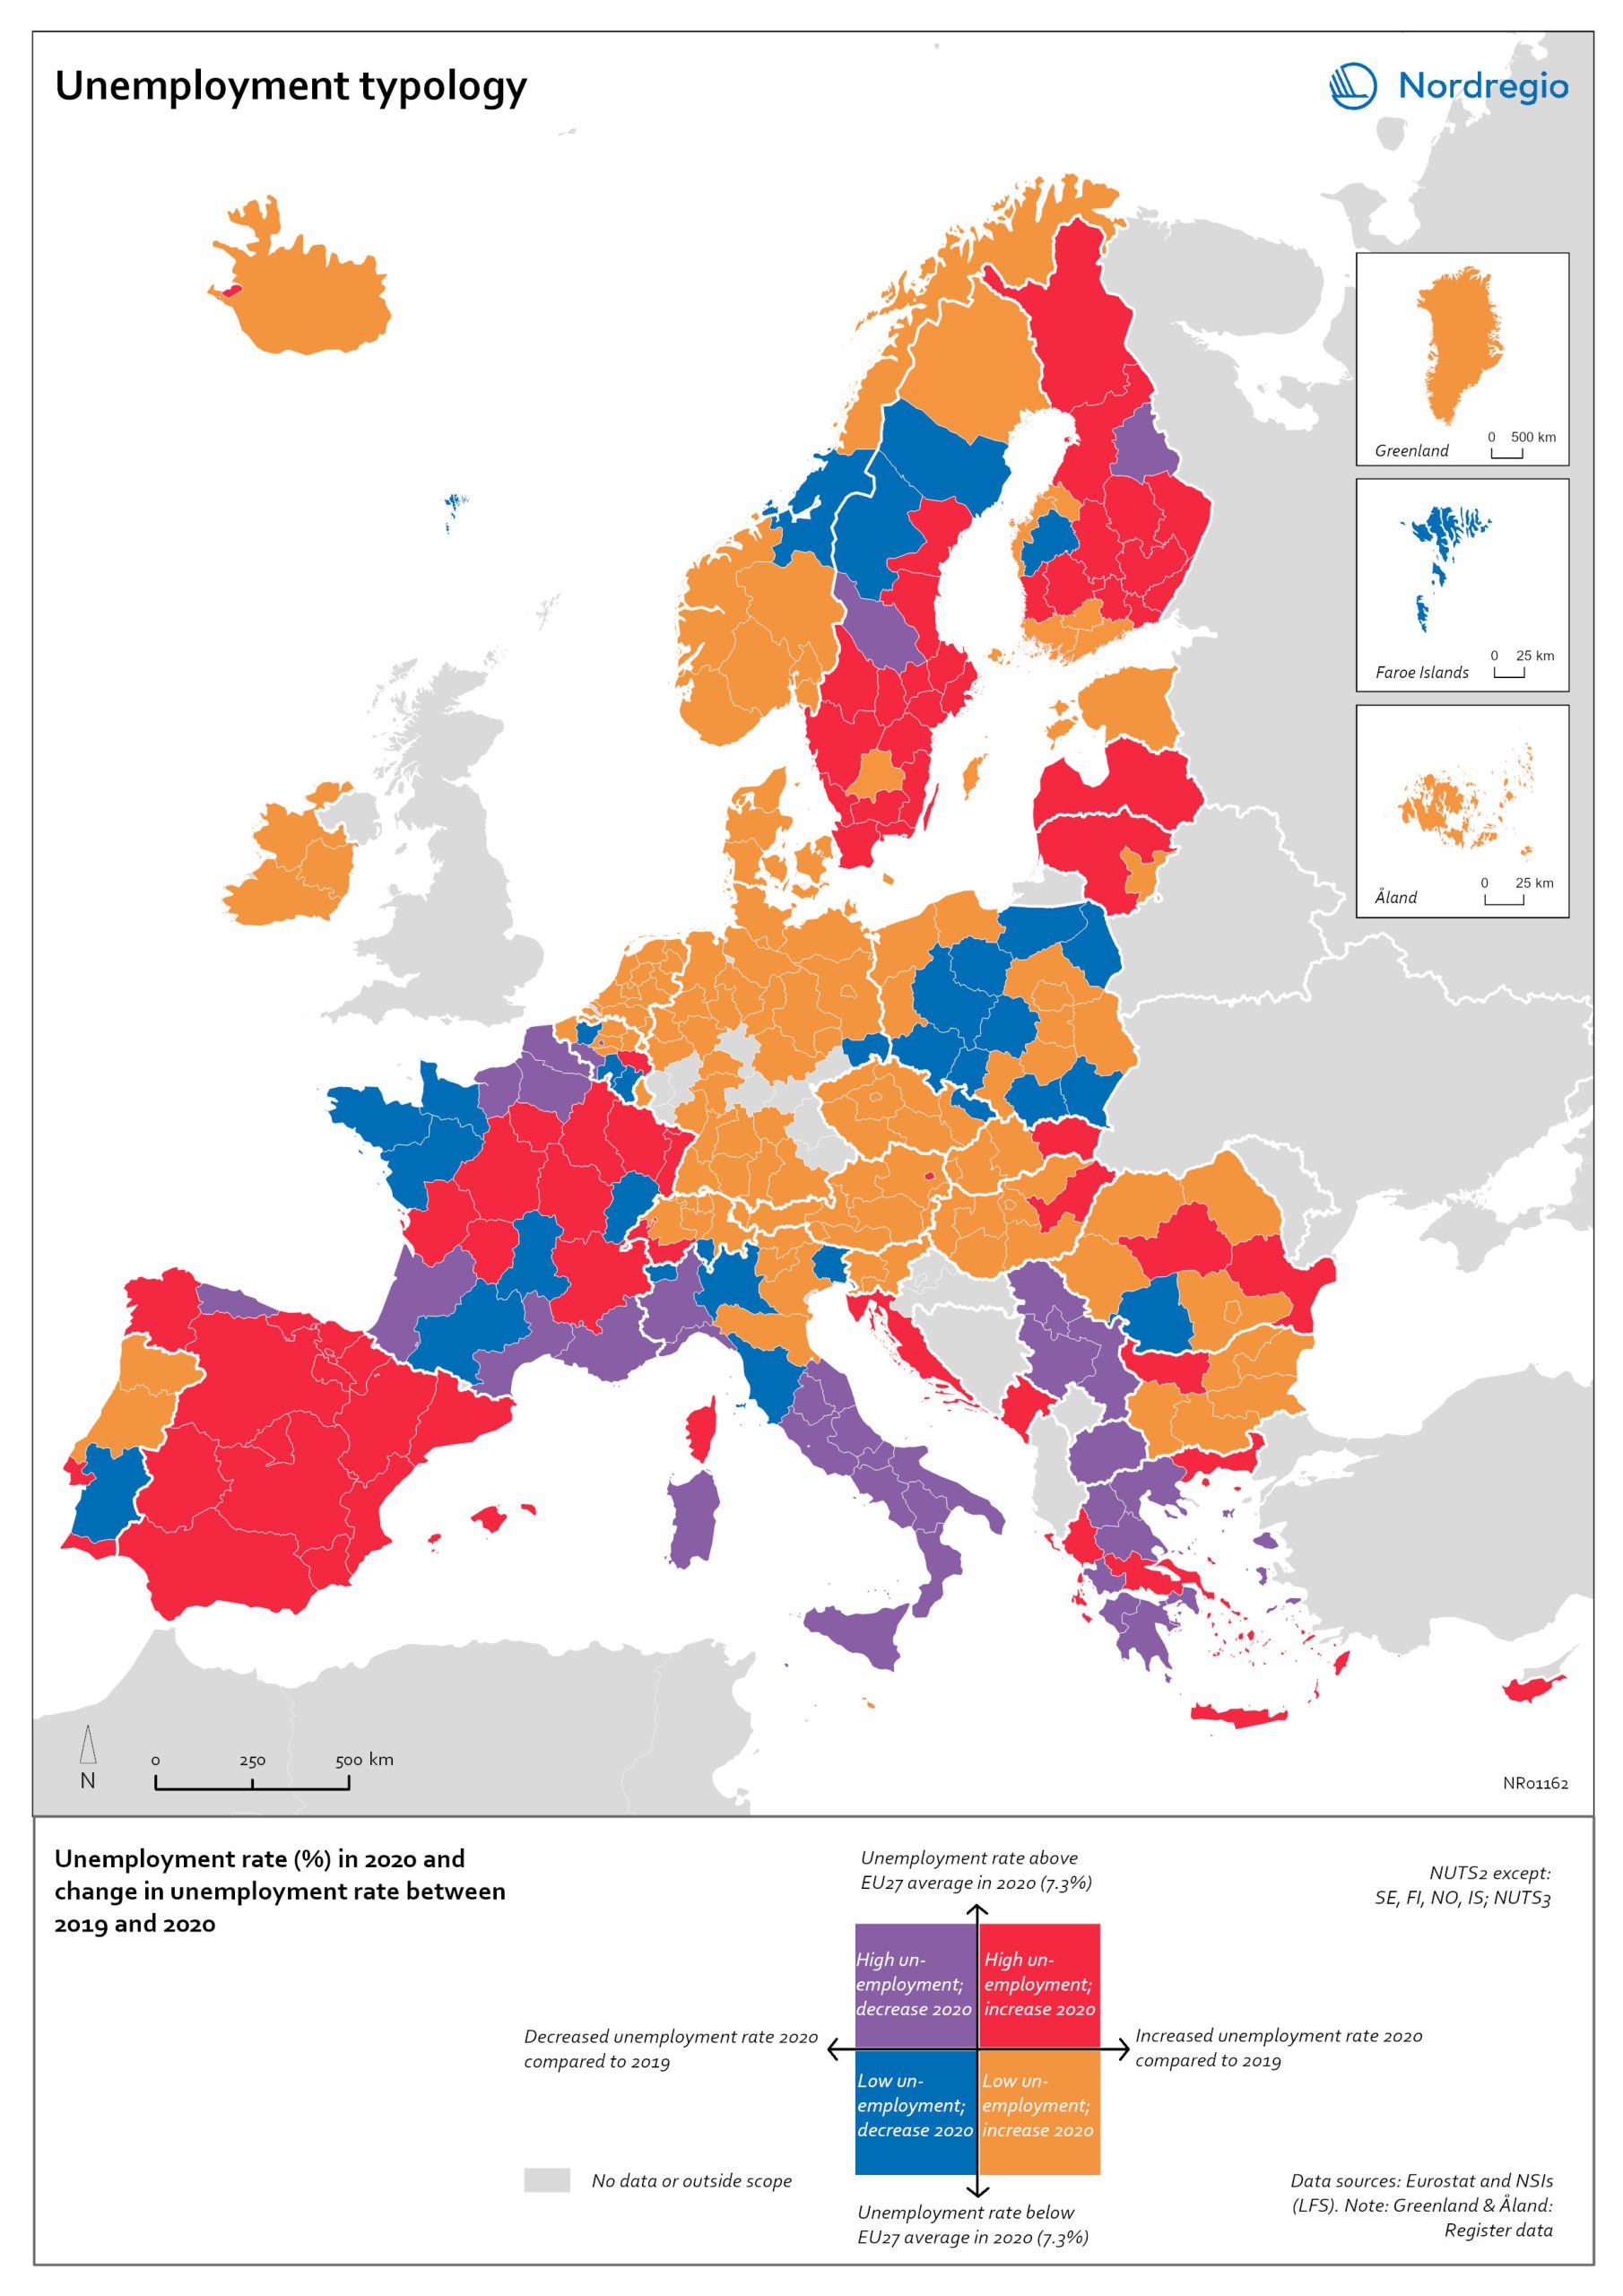
Unemployment typology
The map shows a typology of European regions by combining information on pre-pandemic unemployment rates with unemployment rates in 2020, based on the annual Labour Force Survey (LFS) that is measured in November. On one axis, the typology considers the extent of the change in the unemployment rate between 2019 and 2020. On the other axis, it considers whether the unemployment rate in 2020 was above or below the EU average of 7.3%. Regions are divided into four types based on whether the unemployment rate decreased or increased and how it relates to the EU average. Regions falling into the first type, shown in red on the map, had an increase in the unemployment rate in 2020 as well as an above-average unemployment rate in general in 2020. These regions were most affected by the pandemic. They are mainly found in northern and central parts of Finland, southern and eastern Sweden, the capital area of Iceland, Latvia, Lithuania, Spain and central parts of France. Regions falling into the second type, shown in orange on the map, had an increase in the unemployment rate in 2020 but a below-average unemployment rate in general in 2020. These regions had low pre-pandemic unemployment rates and so were not as badly affected as the red regions, despite the rising unemployment rates. They are located in Denmark, Iceland, Norway, Åland, southern and western Finland, Sweden (Gotland, Jönköping, and Norrbotten), Estonia, Ireland, northern Portugal and central and eastern parts of Europe.
- 2022 March
- Europe
- Labour force
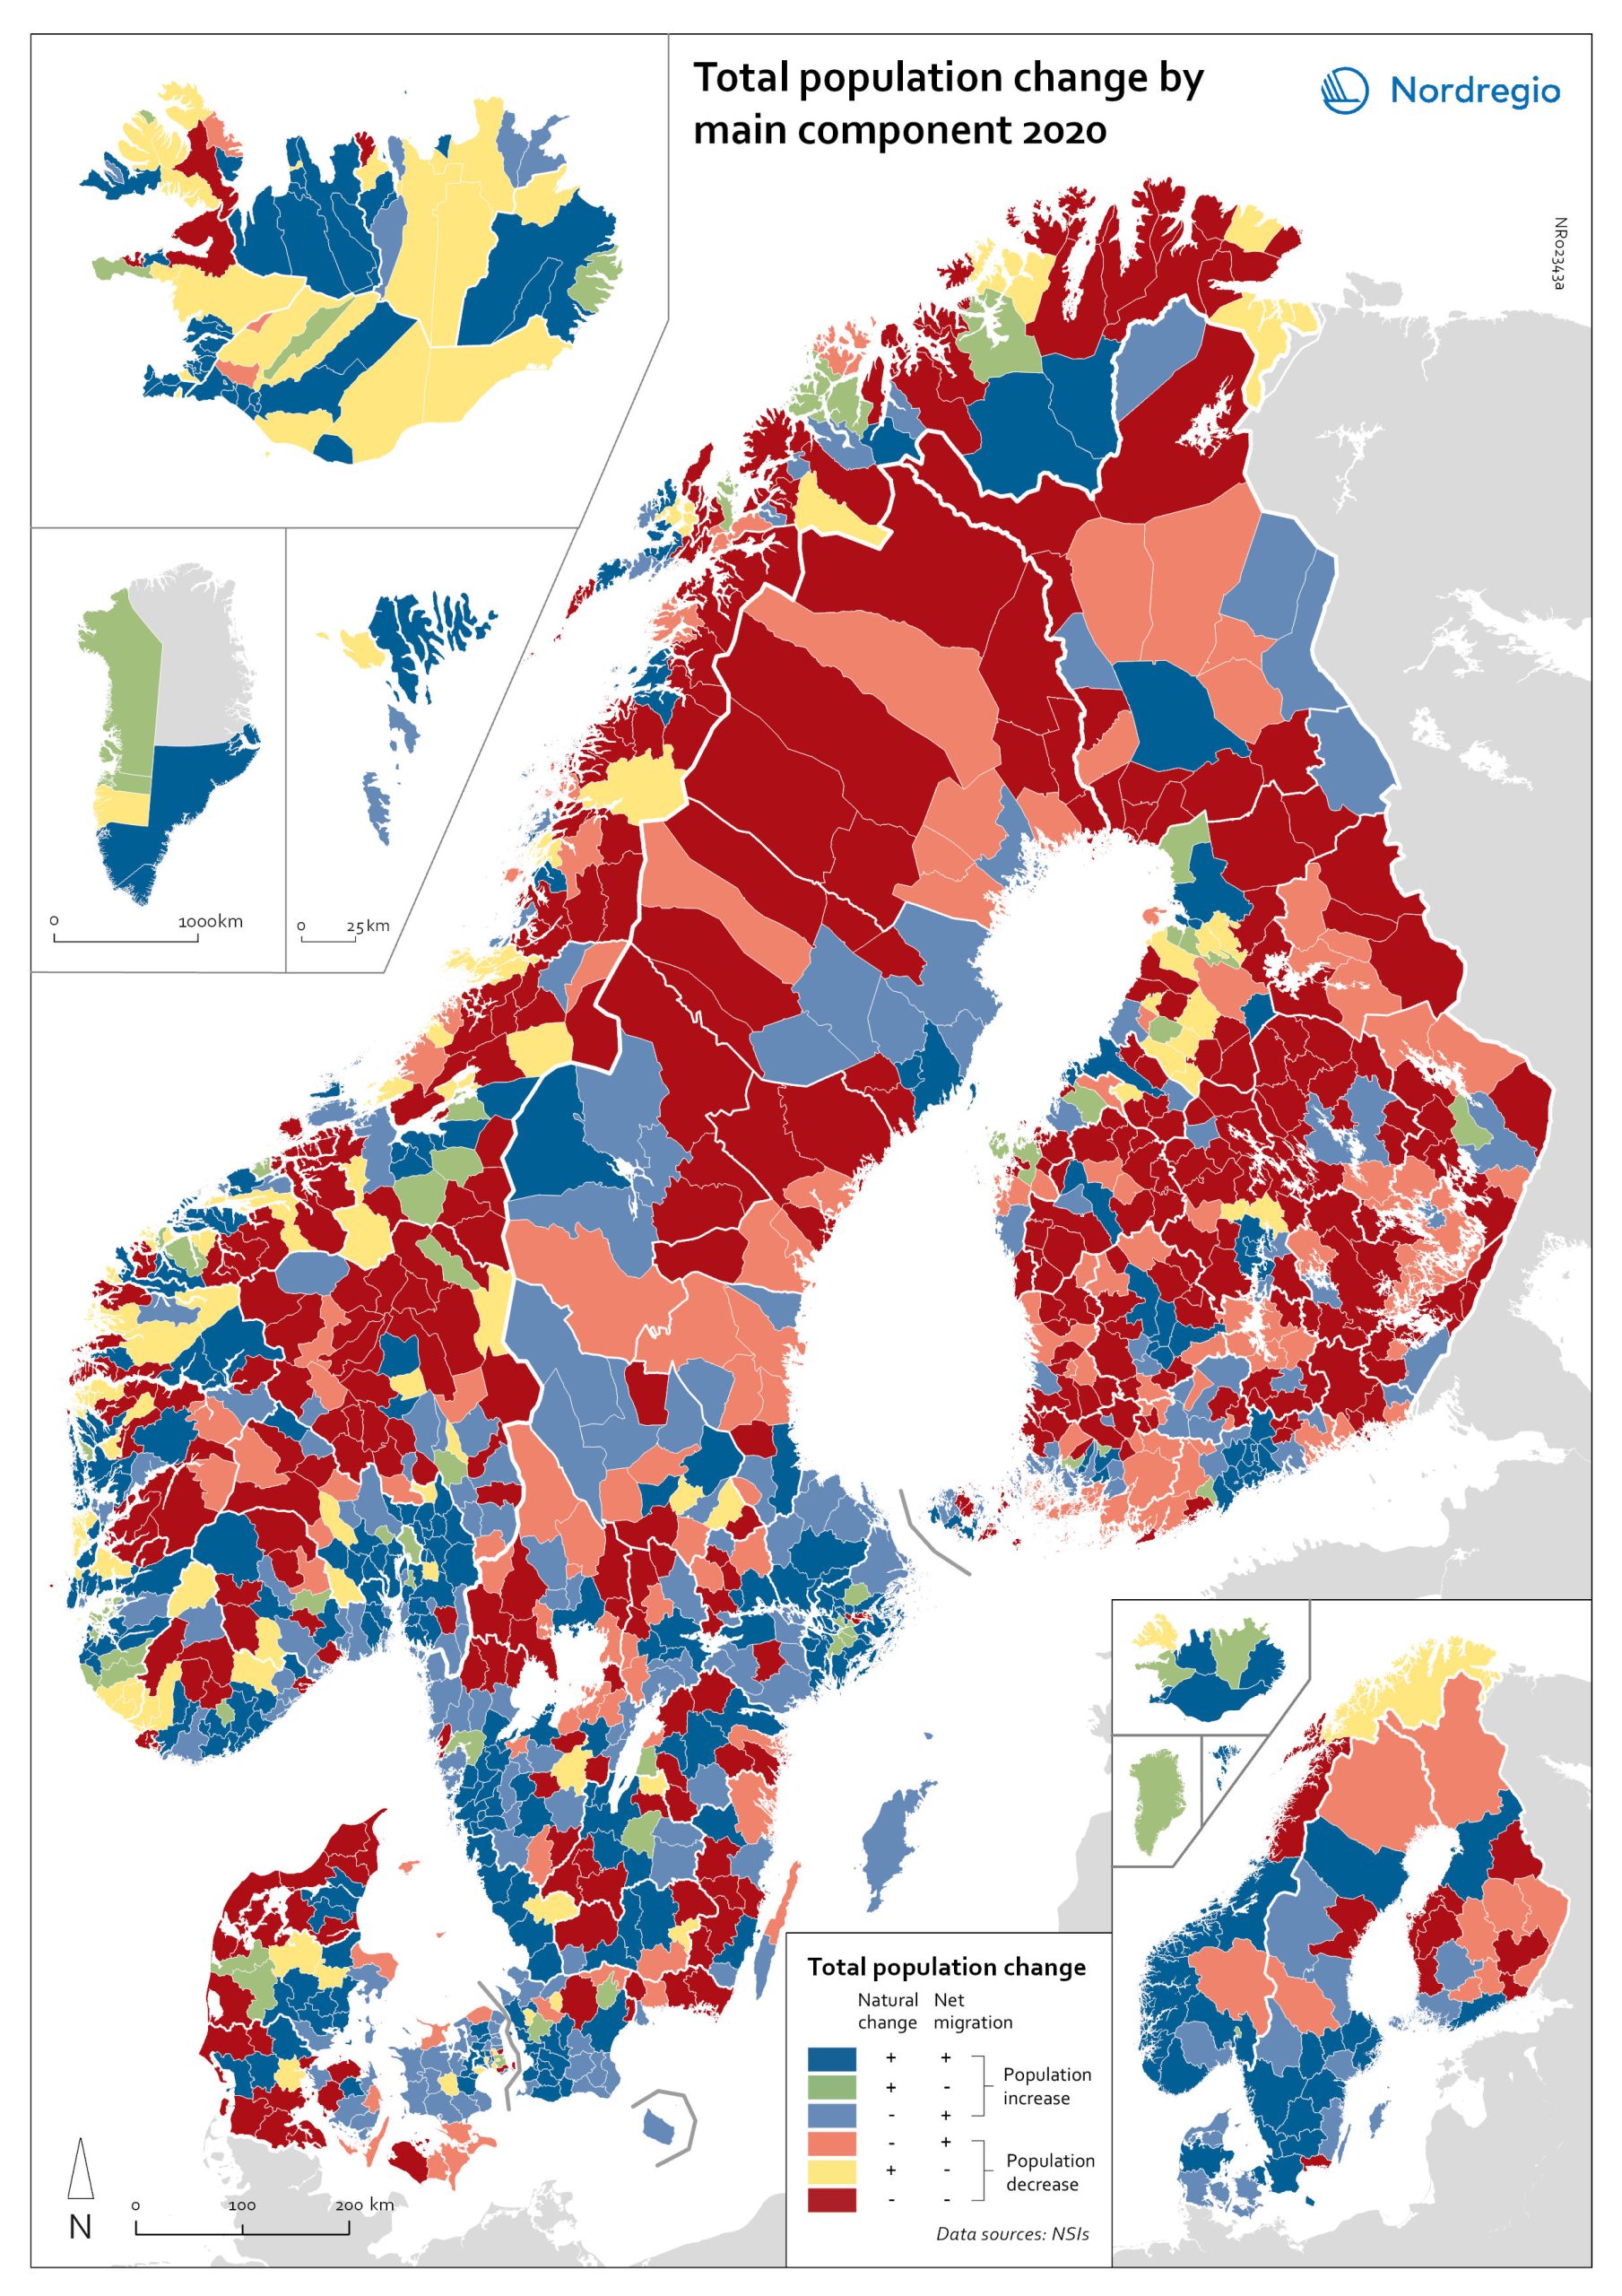
Population change by component 2020
The map shows the population change by component 2020. The map is related to the same map showing regional and municipal patterns in population change by component in 2010-2019. Regions are divided into six classes of population change. Those in shades of blue or green are where the population has increased, and those in shades of red or yellow are where the population has declined. At the regional level (see small inset map), all in Denmark, all in the Faroes, most in southern Norway, southern Sweden, all but one in Iceland, all of Greenland, and a few around the capital in Helsinki had population increases in 2010-2019. Most regions in the north of Norway, Sweden, and Finland had population declines in 2010-2019. Many other regions in southern and eastern Finland also had population declines in 2010-2019, mainly because the country had more deaths than births, a trend that pre-dated the pandemic. In 2020, there were many more regions in red where populations were declining due to both natural decrease and net out-migration. At the municipal level, a more varied pattern emerges, with municipalities having quite different trends than the regions of which they form part. Many regions in western Denmark are declining because of negative natural change and outmigration. Many smaller municipalities in Norway and Sweden saw population decline from both negative natural increase and out-migration despite their regions increasing their populations. Many smaller municipalities in Finland outside the three big cities of Helsinki, Turku, and Tampere also saw population decline from both components. A similar pattern took place at the municipal level in 2020 of there being many more regions in red than in the previous decade.
- 2022 March
- Demography
- Migration
- Nordic Region
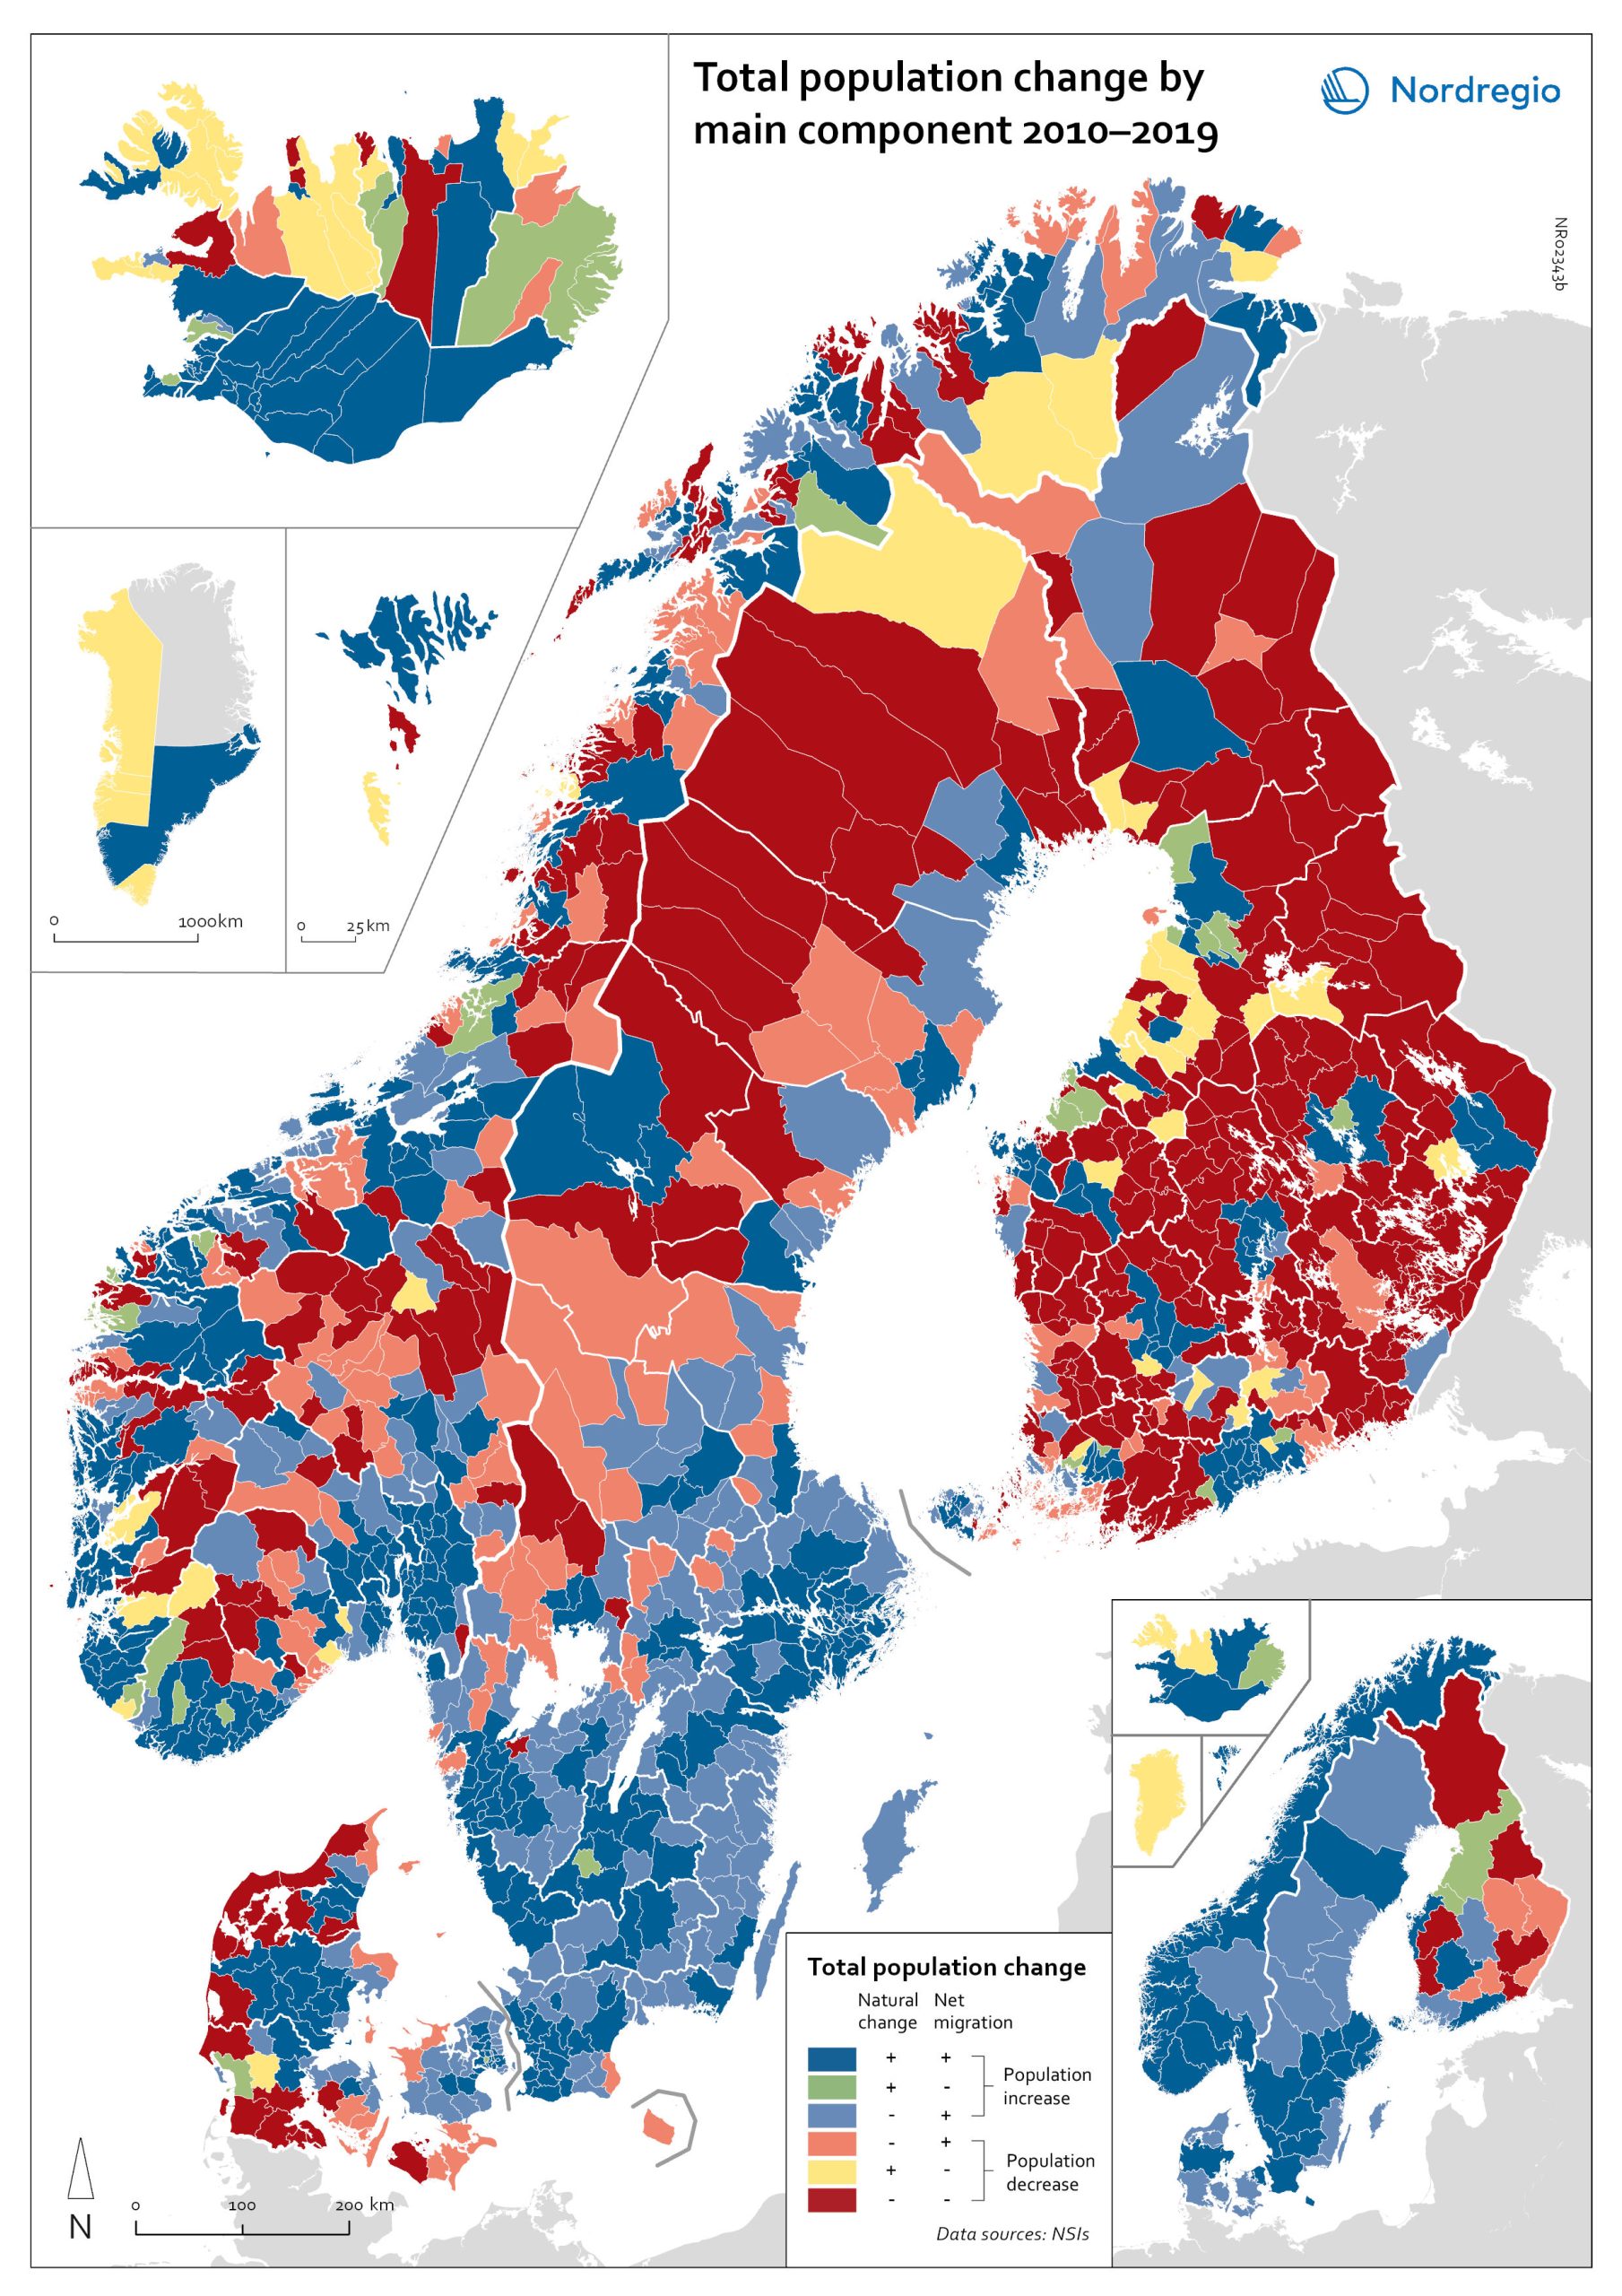
Population change by component 2010-2019
The map shows the population change by component 2010-2019. The map is related to the same map showing regional and municipal patterns in population change by component in 2020. Regions are divided into six classes of population change. Those in shades of blue or green are where the population has increased, and those in shades of red or yellow are where the population has declined. At the regional level (see small inset map), all in Denmark, all in the Faroes, most in southern Norway, southern Sweden, all but one in Iceland, all of Greenland, and a few around the capital in Helsinki had population increases in 2010-2019. Most regions in the north of Norway, Sweden, and Finland had population declines in 2010-2019. Many other regions in southern and eastern Finland also had population declines in 2010-2019, mainly because the country had more deaths than births, a trend that pre-dated the pandemic. In 2020, there were many more regions in red where populations were declining due to both natural decrease and net out-migration. At the municipal level, a more varied pattern emerges, with municipalities having quite different trends than the regions of which they form part. Many regions in western Denmark are declining because of negative natural change and outmigration. Many smaller municipalities in Norway and Sweden saw population decline from both negative natural increase and out-migration despite their regions increasing their populations. Many smaller municipalities in Finland outside the three big cities of Helsinki, Turku, and Tampere also saw population decline from both components. A similar pattern took place at the municipal level in 2020 of there being many more regions in red than in the previous decade.
- 2022 March
- Demography
- Migration
- Nordic Region
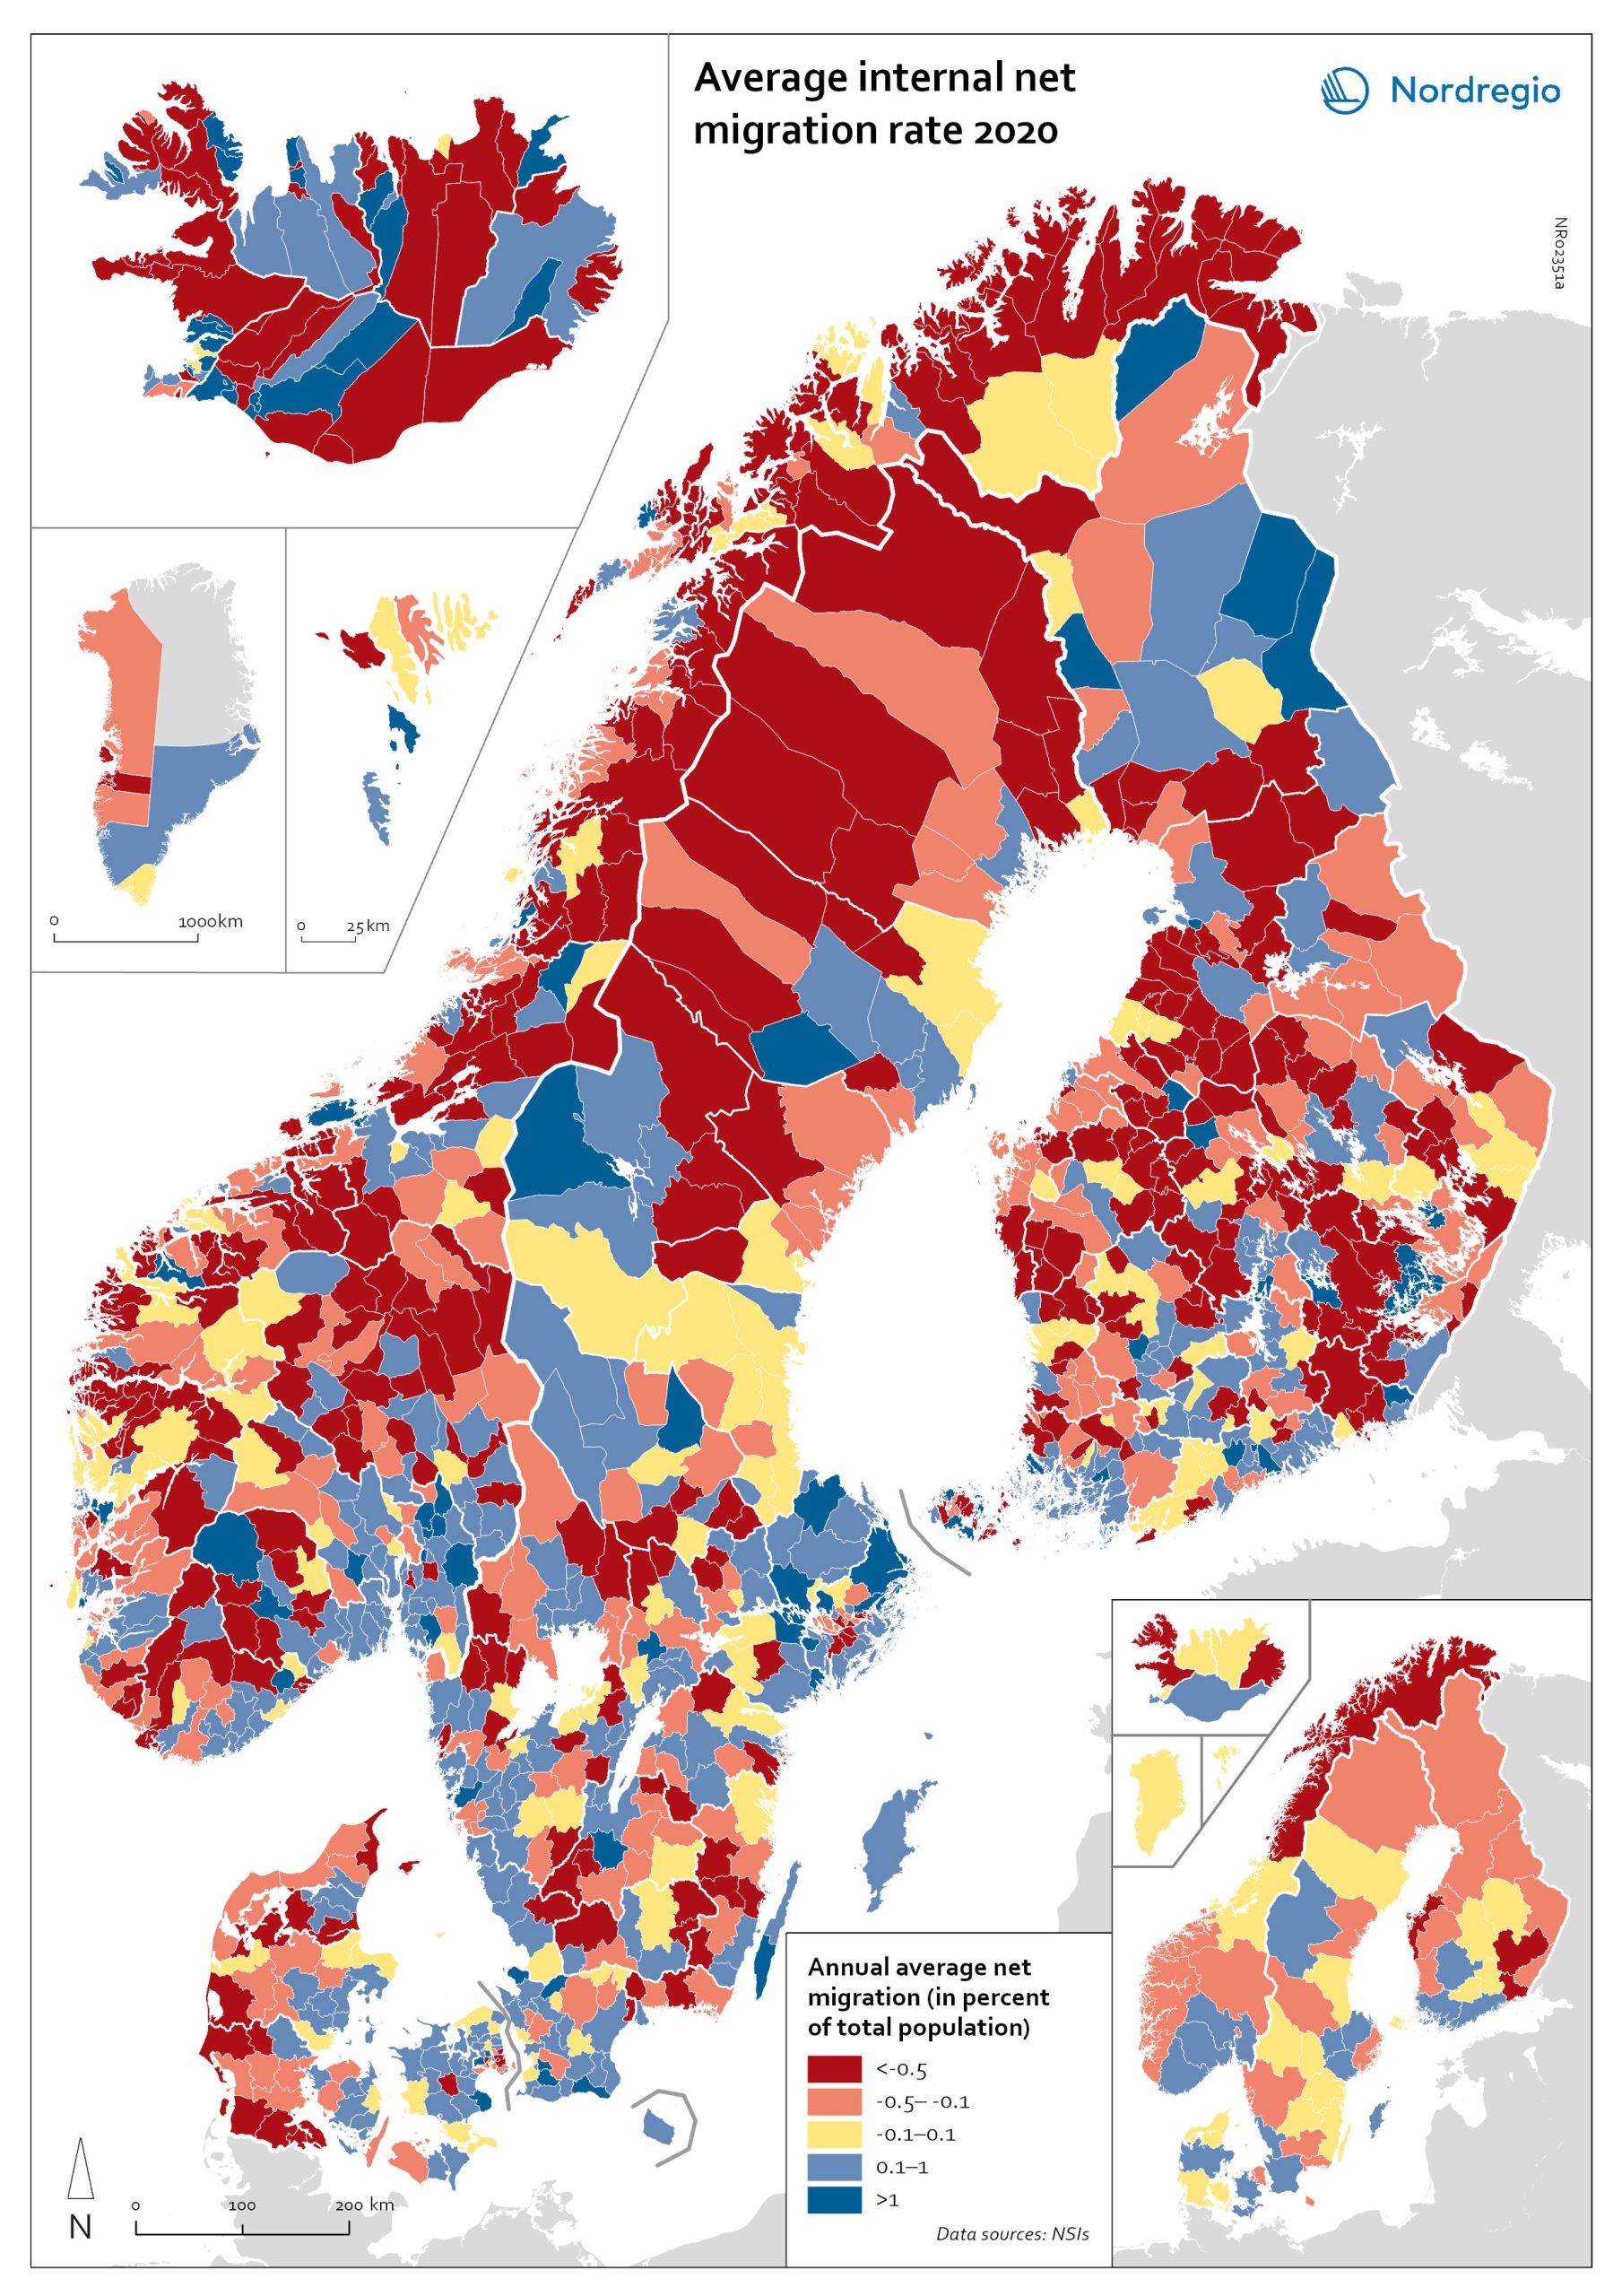
Net internal migration rate 2020
The map shows the internal net migration in 2020. The map is related to the same map showing net internal migration in 2010-2019. The maps show several interesting patterns, suggesting that there may be an increasing trend towards urban-to-rural countermigration in all the five Nordic countries because of the pandemic. In other words, there are several rural municipalities – both in sparsely populated areas and areas close to major cities – that have experienced considerable increases in internal net migration. In Finland, for instance, there are several municipalities in Lapland that attracted return migrants to a considerable degree in 2020 (e.g., Kolari, Salla, and Savukoski). Swedish municipalities with increasing internal net migration include municipalities in both remote rural regions (e.g., Åre) and municipalities in the vicinity of major cities (e.g., Trosa, Upplands-Bro, Lekeberg, and Österåker). In Iceland, there are several remote municipalities that have experienced a rapid transformation from a strong outflow to an inflow of internal migration (e.g., Ásahreppur, Tálknafjarðarhreppurand, and Fljótsdalshreppur). In Denmark and Norway, there are also several rural municipalities with increasing internal net migration (e.g., Christiansø in Denmark), even if the patterns are somewhat more restrained compared to the other Nordic countries. Interestingly, several municipalities in capital regions are experiencing a steep decrease in internal migration (e.g., Helsinki, Espoo, Copenhagen and Stockholm). At regional level, such decreases are noted in the capital regions of Copenhagen, Reykjavík and Stockholm. At the same time, the rural regions of Jämtland, Kalmar, Sjælland, Nordjylland, Norðurland vestra, Norðurland eystra and Kainuu recorded increases in internal net migration. While some of the evolving patterns of counterurbanisation were noted before 2020 for the 30–40 age group, these trends seem to have been strengthened by the pandemic. In addition to return migration, there may be a larger share of young adults who decide to…
- 2022 March
- Demography
- Migration
- Nordic Region
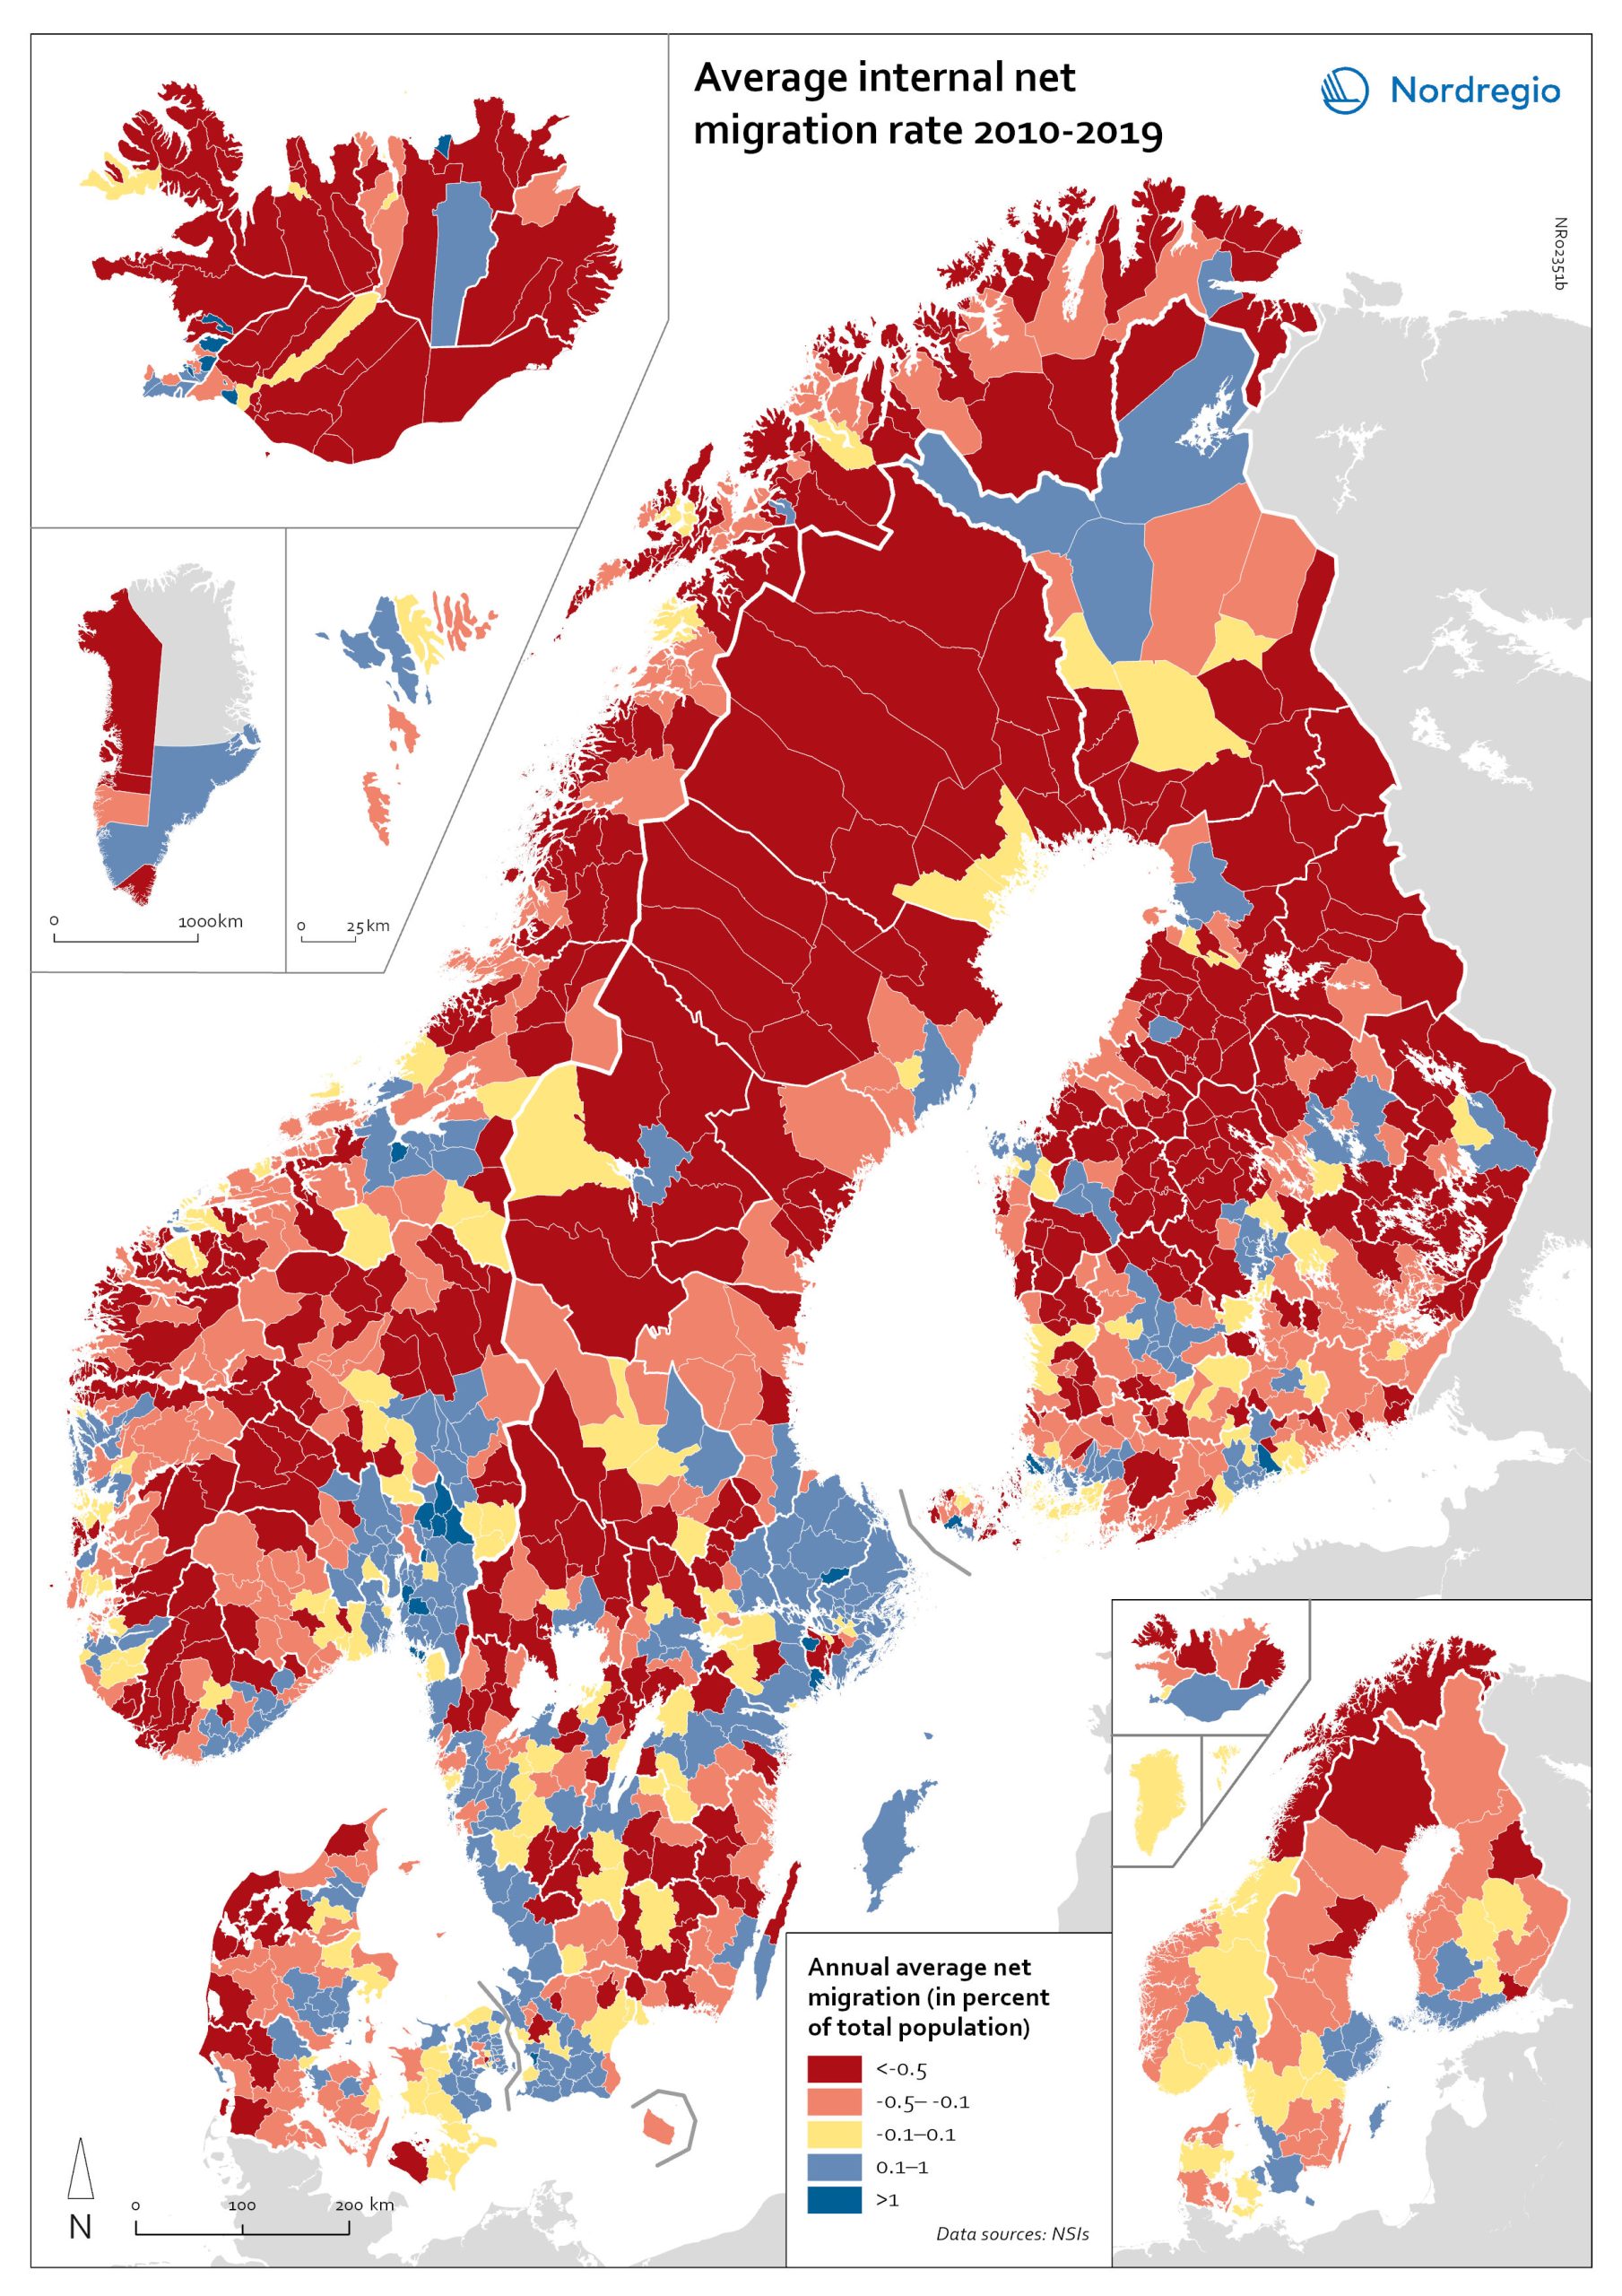
Net internal migration rate, 2010-2019
The map shows the annual average internal net migration in 2010-2019. The map is related to the same map showing net internal migration in 2020. The maps show several interesting patterns, suggesting that there may be an increasing trend towards urban-to-rural countermigration in all the five Nordic countries because of the pandemic. In other words, there are several rural municipalities – both in sparsely populated areas and areas close to major cities – that have experienced considerable increases in internal net migration. In Finland, for instance, there are several municipalities in Lapland that attracted return migrants to a considerable degree in 2020 (e.g., Kolari, Salla, and Savukoski). Swedish municipalities with increasing internal net migration include municipalities in both remote rural regions (e.g., Åre) and municipalities in the vicinity of major cities (e.g., Trosa, Upplands-Bro, Lekeberg, and Österåker). In Iceland, there are several remote municipalities that have experienced a rapid transformation from a strong outflow to an inflow of internal migration (e.g., Ásahreppur, Tálknafjarðarhreppurand, and Fljótsdalshreppur). In Denmark and Norway, there are also several rural municipalities with increasing internal net migration (e.g., Christiansø in Denmark), even if the patterns are somewhat more restrained compared to the other Nordic countries. Interestingly, several municipalities in capital regions are experiencing a steep decrease in internal migration (e.g., Helsinki, Espoo, Copenhagen and Stockholm). At regional level, such decreases are noted in the capital regions of Copenhagen, Reykjavík and Stockholm. At the same time, the rural regions of Jämtland, Kalmar, Sjælland, Nordjylland, Norðurland vestra, Norðurland eystra and Kainuu recorded increases in internal net migration. While some of the evolving patterns of counterurbanisation were noted before 2020 for the 30–40 age group, these trends seem to have been strengthened by the pandemic. In addition to return migration, there may be a larger share of young adults who…
- 2022 March
- Demography
- Migration
- Nordic Region
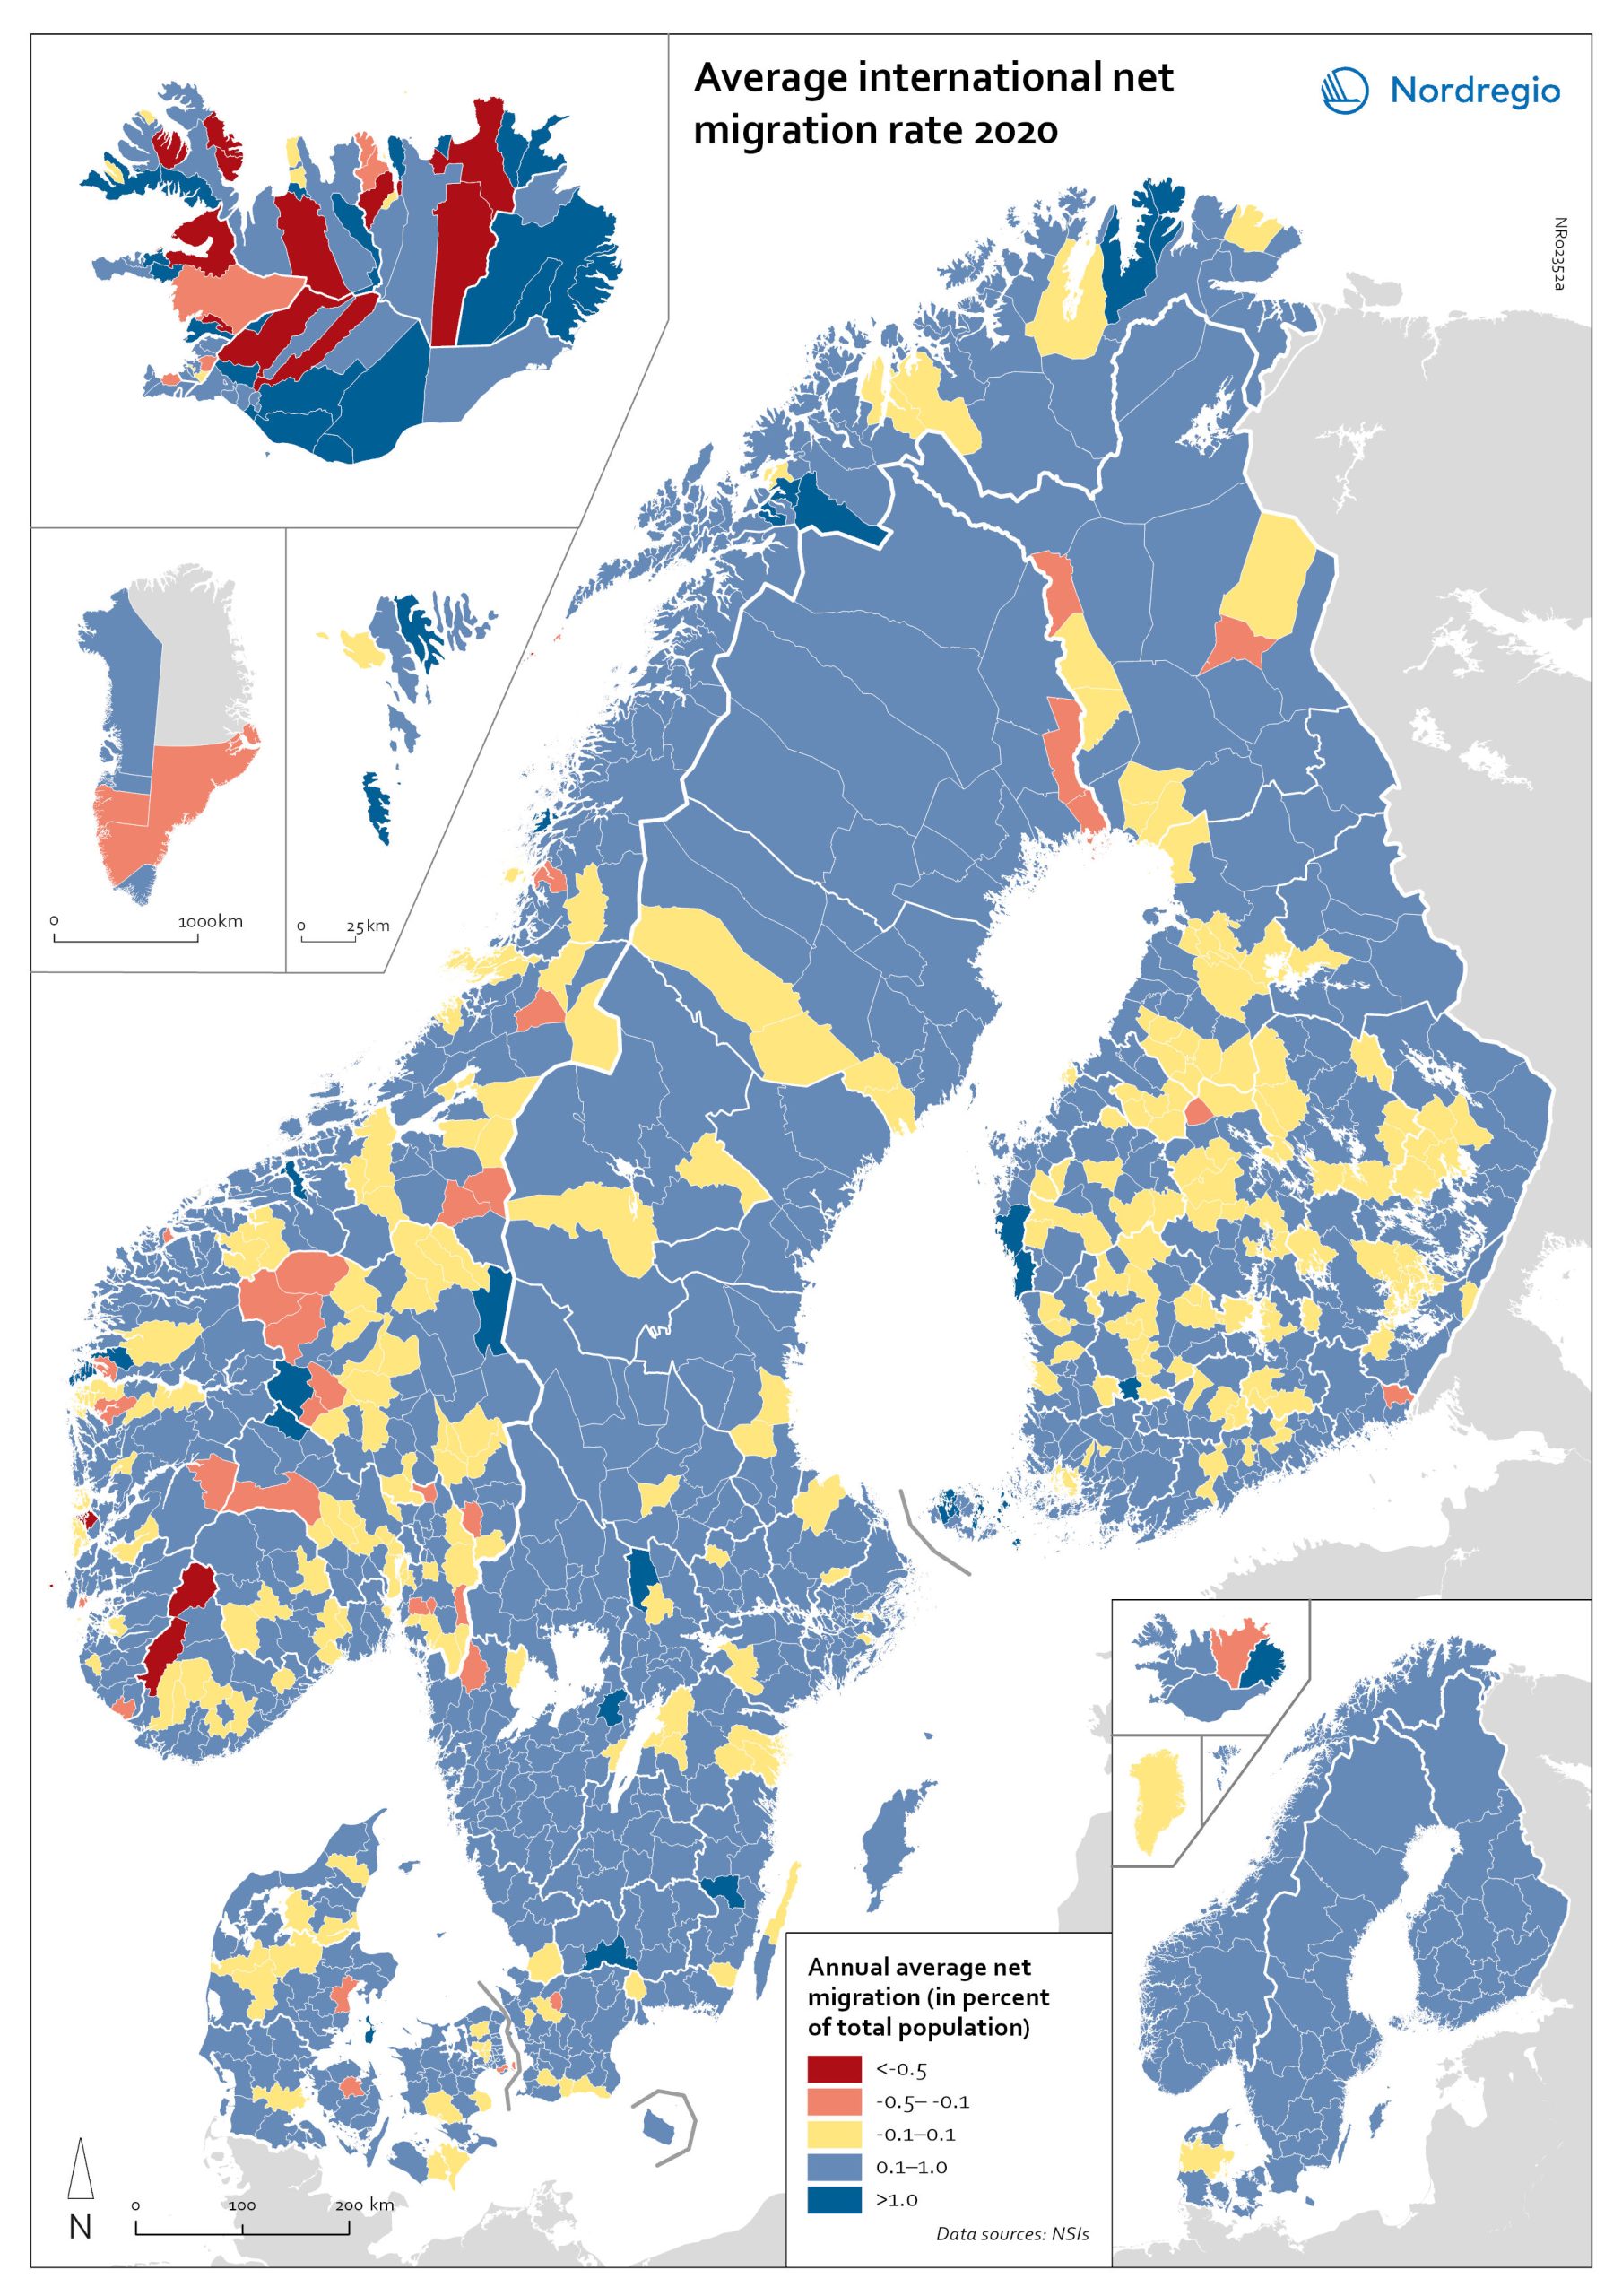
Net international migration rate, 2020
The map shows the international net migration in 2020. The map is related to the same map showing net migration in 2010-2019. At regional level, there are only minor changes between the net migration in 2010-2019 and 2020. All regions of Norway, all regions of Sweden except Gotland and Uppsala, and the regions of Österbotten in Finland, Midtjylland in Denmark and Norðurland eystra in Iceland experienced a slight decrease in international net migration I 2020 compared to 2010-2019. There is a more marked increase in net migration in the Faroe Islands, Greenland and the region of Norðurland vestra in Iceland, and a slight increase in the region of Austurland in Iceland. At municipal level, the maps show more changing patterns. In Denmark, Norway and Sweden, several municipalities – both in the capital, intermediate, and rural regions – had lower levels of international net migration in 2020 compared to 2010-2019. In Iceland and Finland, the picture is more balanced, with some municipalities showing a decrease, others an increase. In the Faroe Islands and Greenland, several municipalities/regions had an increase in international net migration.
- 2022 March
- Demography
- Migration
- Nordic Region
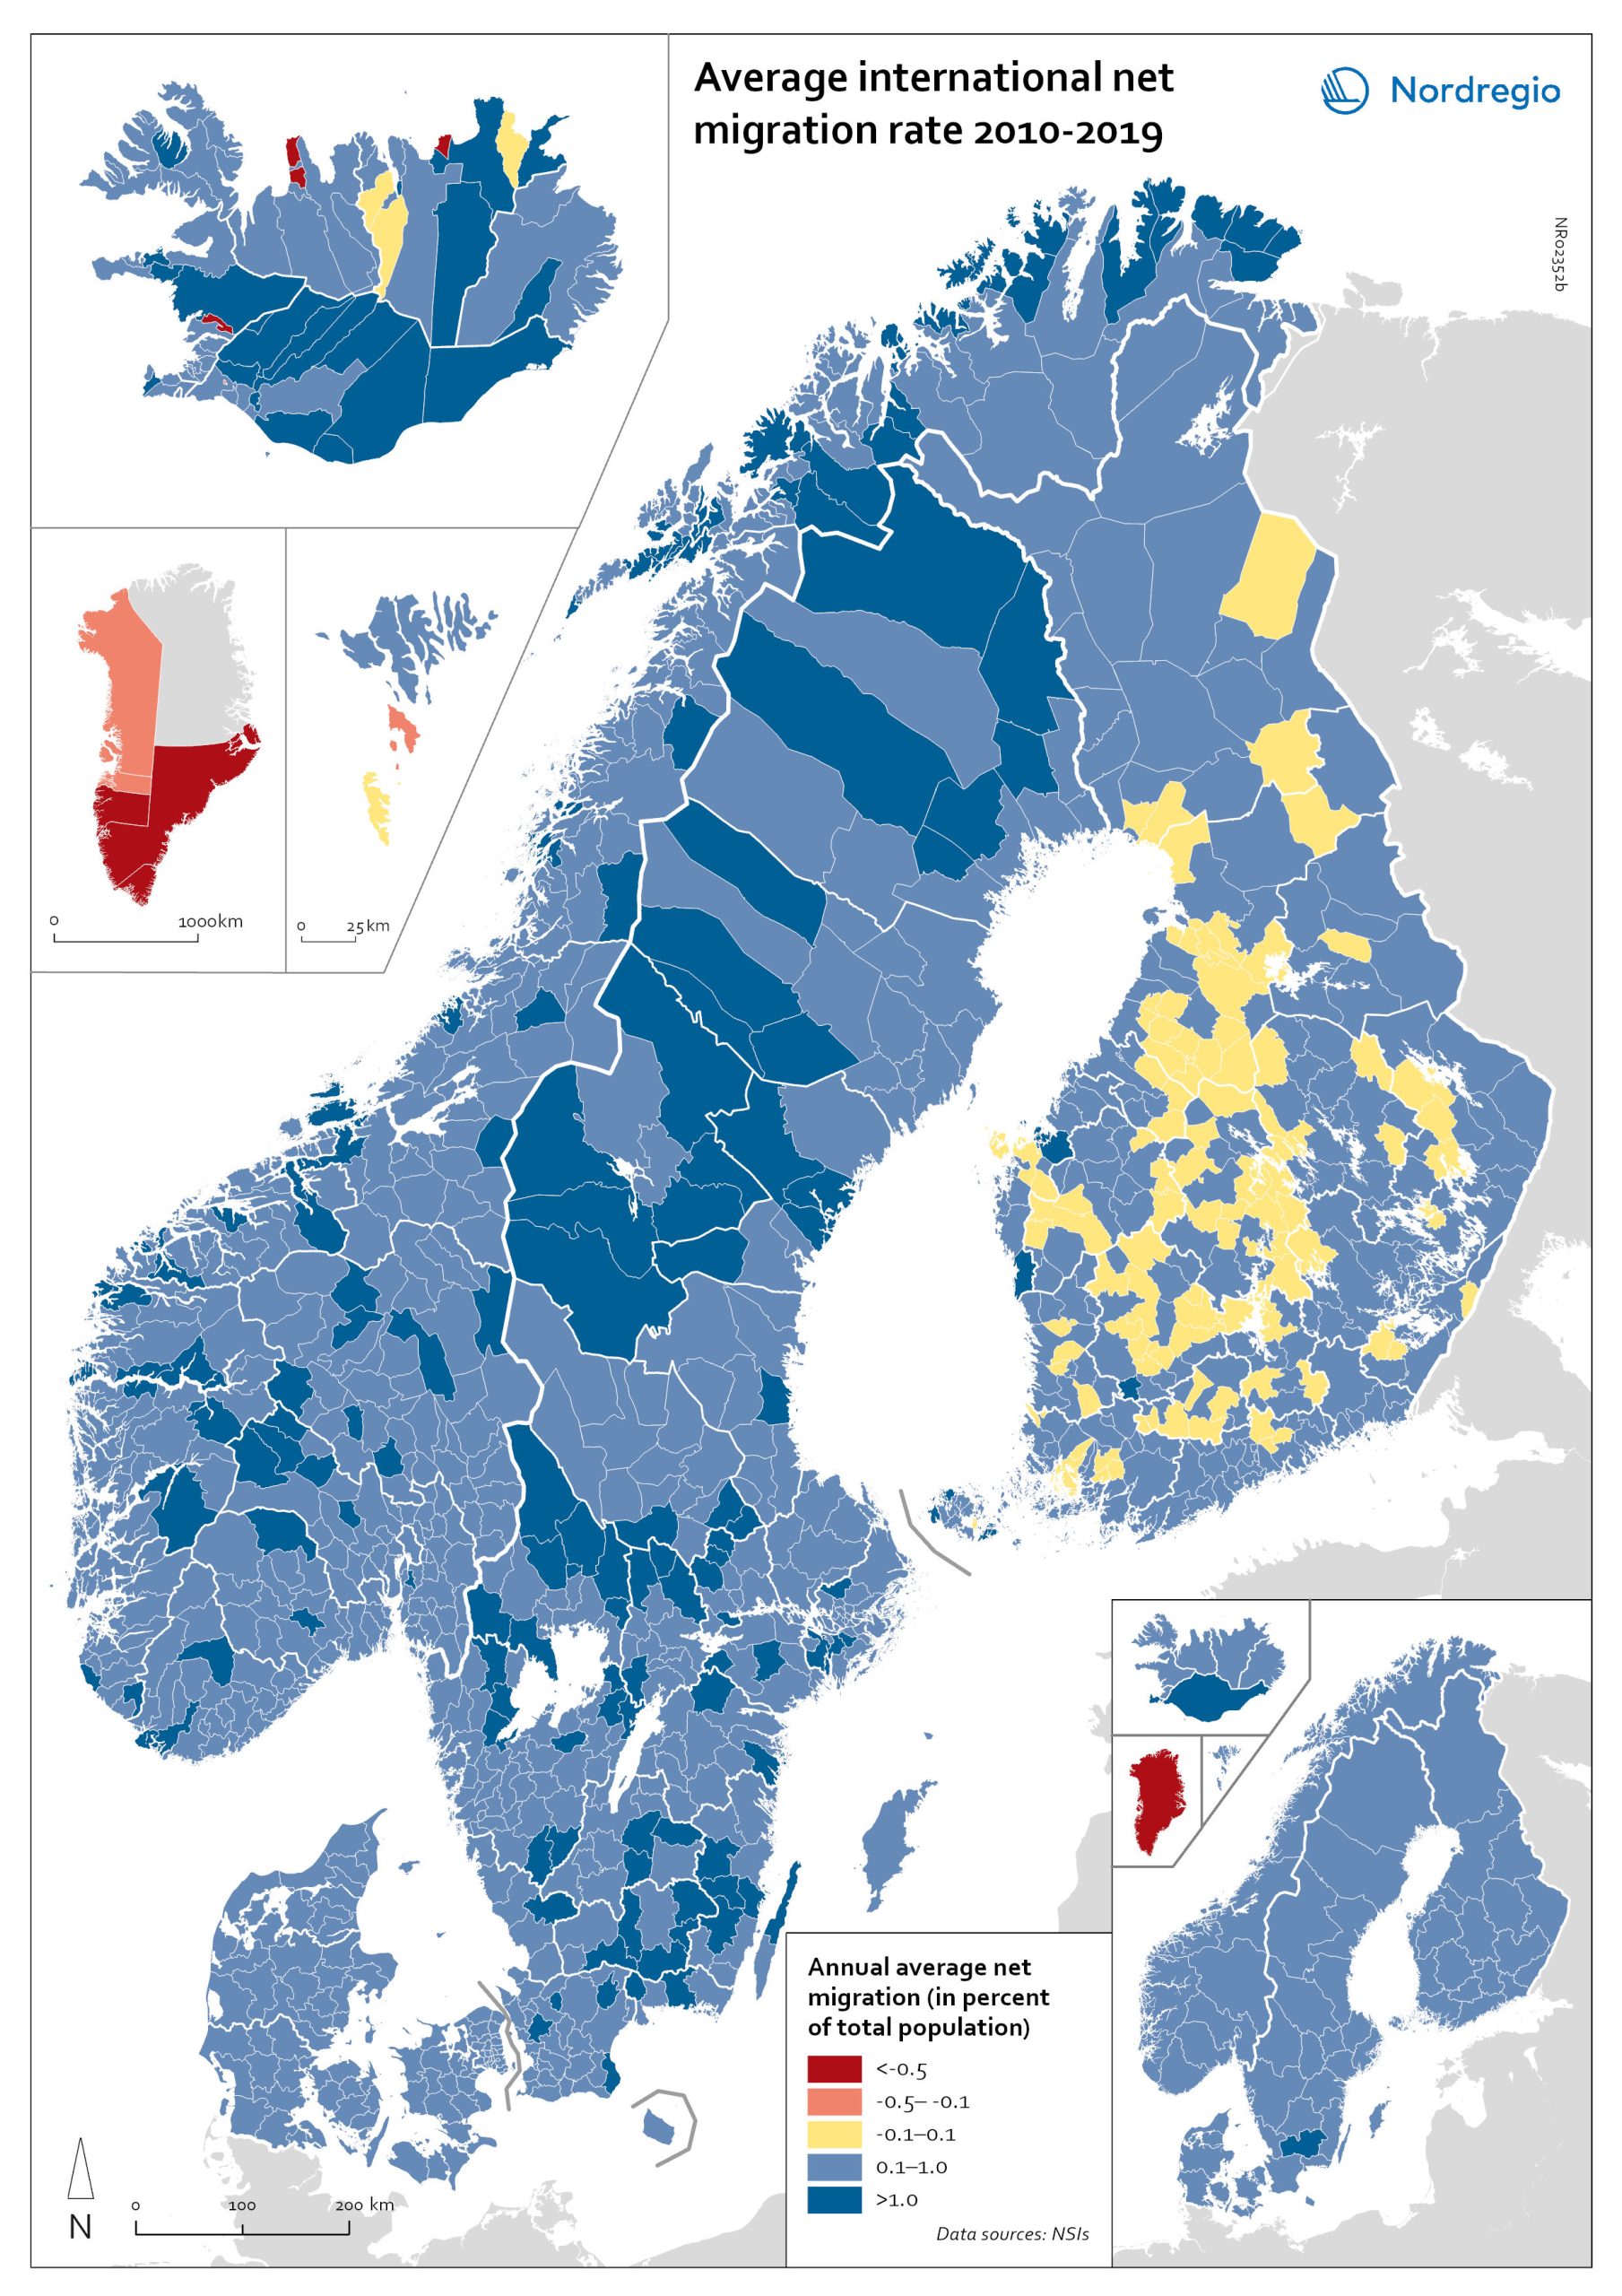
Net international migration rate, 2010–2019
The map shows the annual average international net migration from 2010 to 2019. The map is related to the same map showing net migration in 2020. At regional level, there are only minor changes between the net migration in 2010-2019 and 2020. All regions of Norway, all regions of Sweden except Gotland and Uppsala, and the regions of Österbotten in Finland, Midtjylland in Denmark and Norðurland eystra in Iceland experienced a slight decrease in international net migration I 2020 compared to 2010-2019. There is a more marked increase in net migration in the Faroe Islands, Greenland and the region of Norðurland vestra in Iceland, and a slight increase in the region of Austurland in Iceland. At municipal level, the maps show more changing patterns. In Denmark, Norway and Sweden, several municipalities – both in the capital, intermediate, and rural regions – had lower levels of international net migration in 2020 compared to 2010-2019. In Iceland and Finland, the picture is more balanced, with some municipalities showing a decrease, others an increase. In the Faroe Islands and Greenland, several municipalities/regions had an increase in international net migration.
- 2022 March
- Demography
- Migration
- Nordic Region
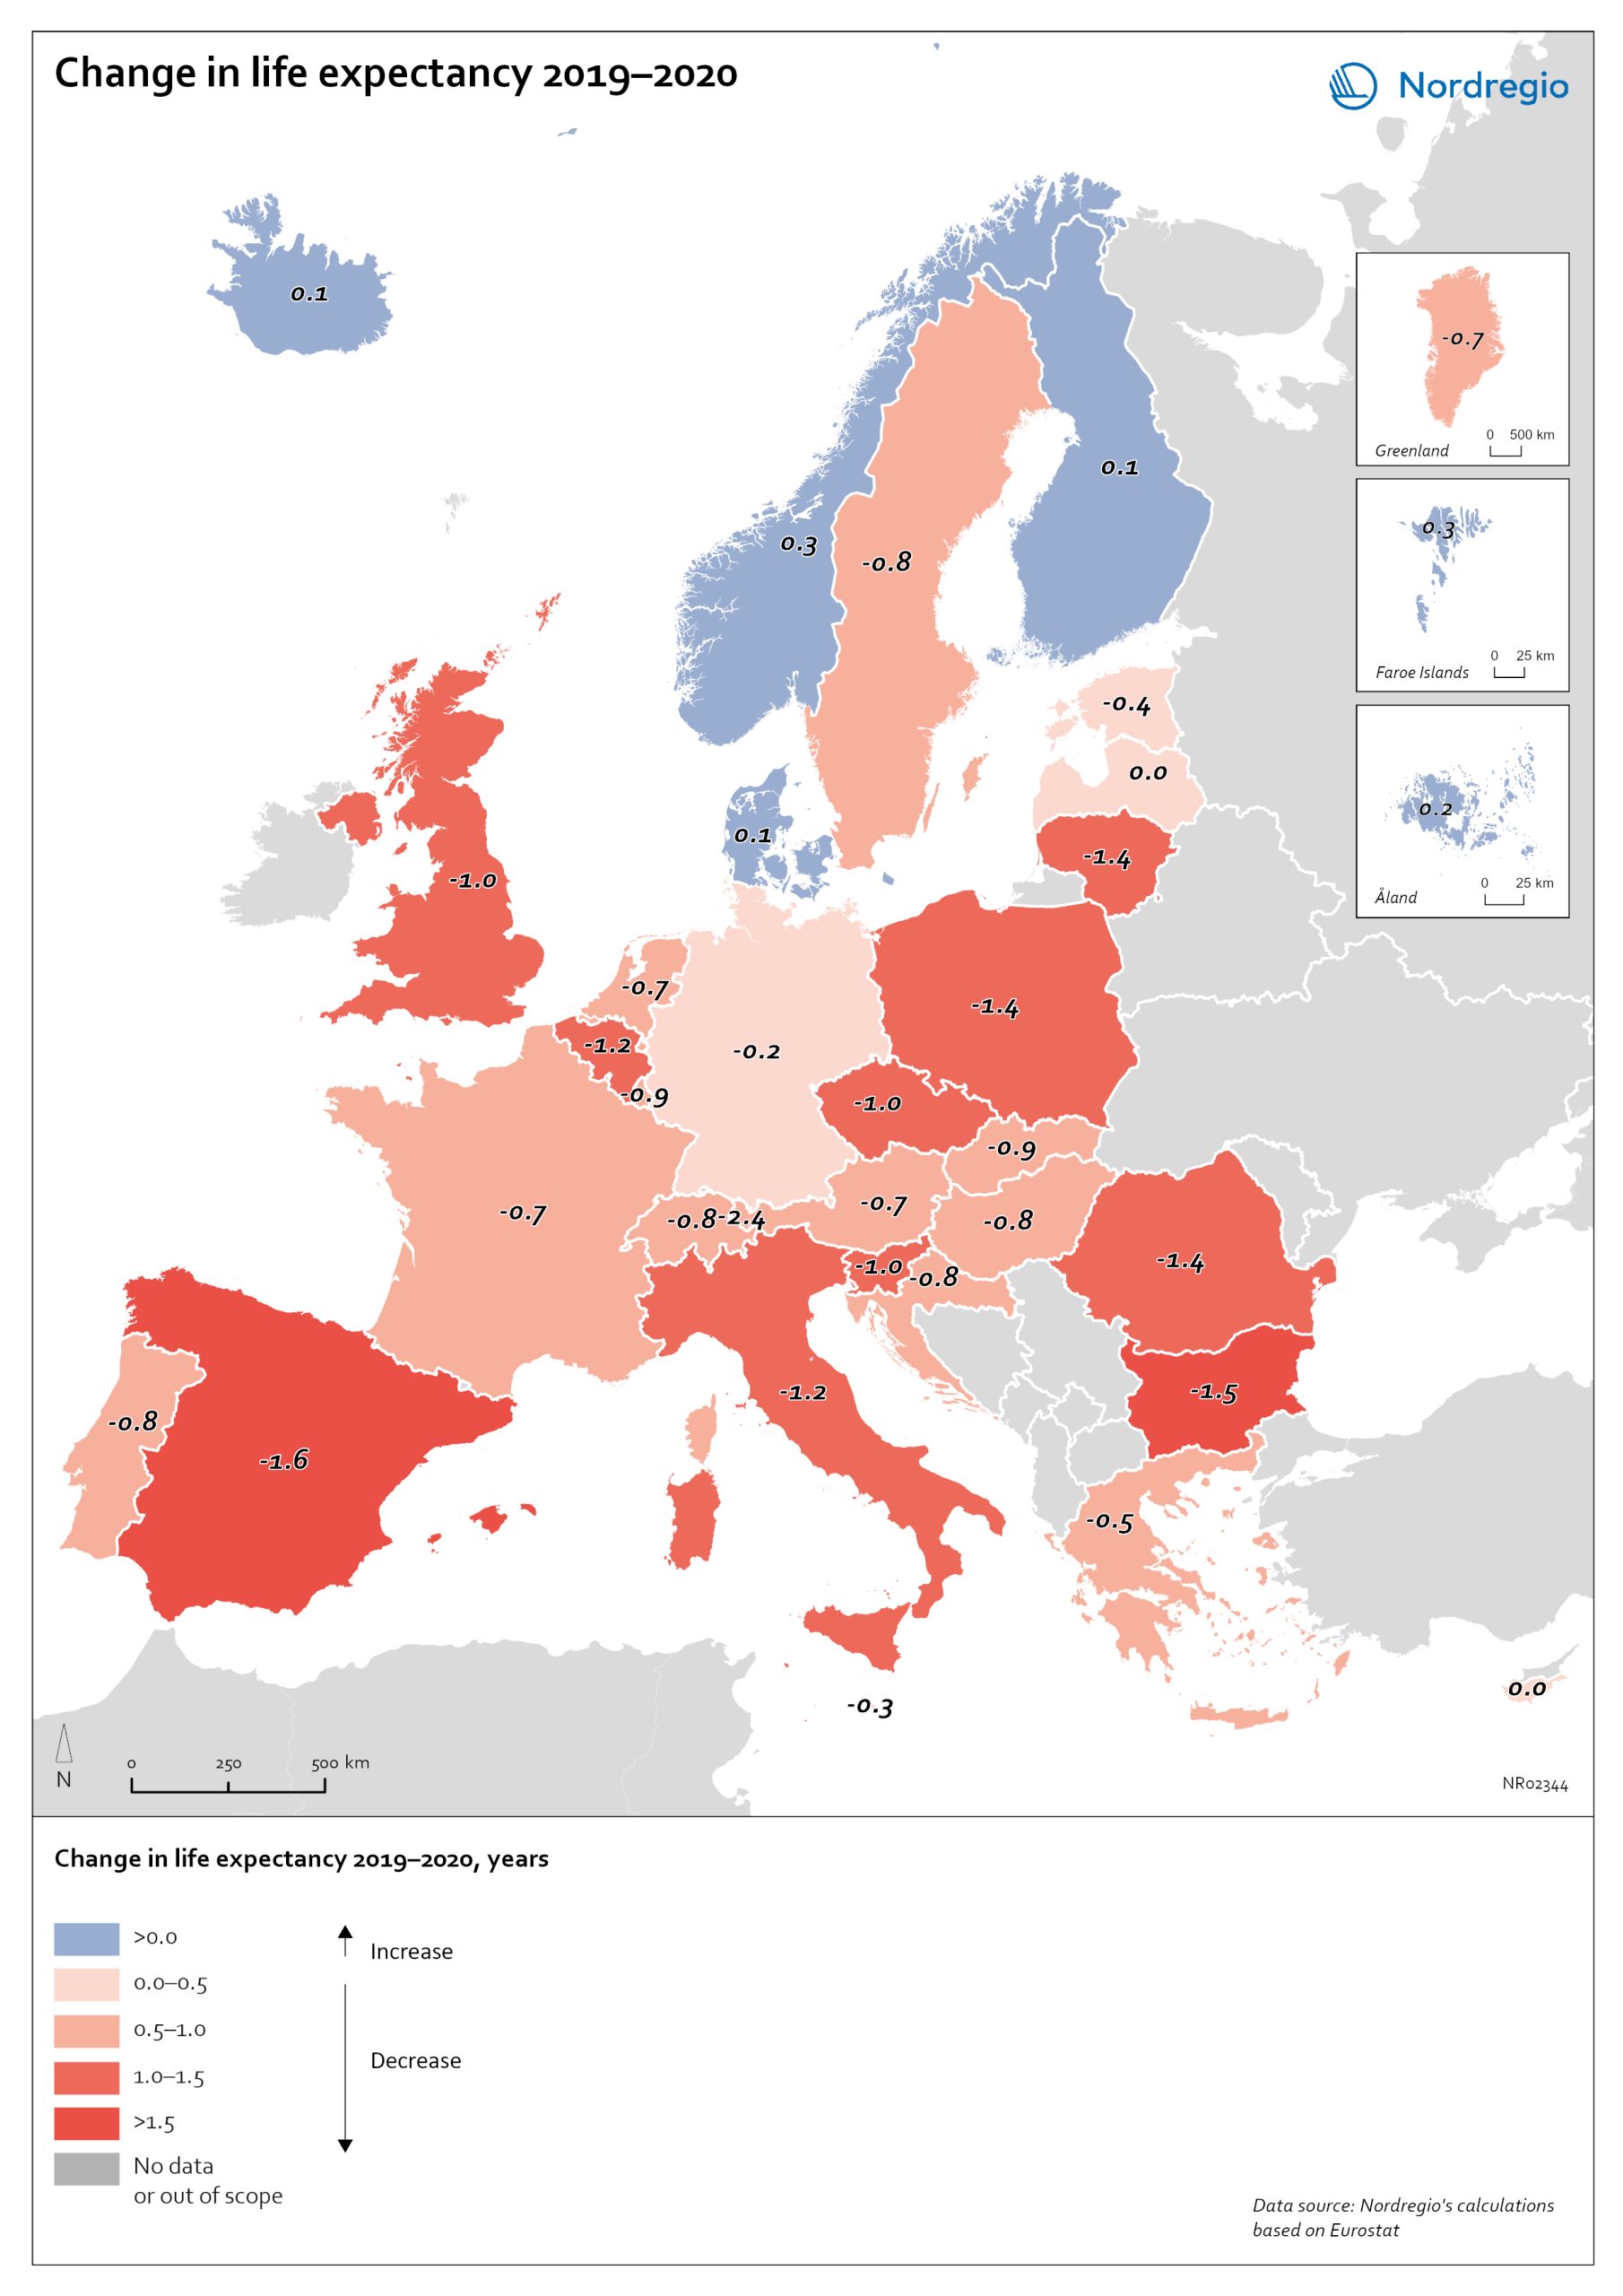
Change in life expectancy 2019–2020 by country in Europe
The excess mortality has affected overall life expectancy at birth across Europe. In 2019, prior to the start of the pandemic, Spain, Switzerland, and Italy had the highest life expectancy in Europe, followed closely by Sweden, Iceland, France, and Norway. Finland and Denmark had slightly lower levels but were still at or above the EU average (Eurostat, 2021). Life expectancy across the EU as a whole and in nearly all other countries has been steadily increasing for decades. Declines in life expectancy are rare, but that is indeed what happened in many countries in Europe during the pandemic in 2020. One study of upper-middle and high-income countries showed that life expectancy declined in 31 of 37 countries in 2020. The only countries where life expectancy did not decline were New Zealand, Taiwan, Iceland, South Korea, Denmark and Norway. The largest falls were in Russia and the United States. The high excess mortality in Sweden in 2020 has had an impact on life expectancy. In Iceland, Norway, Finland, Denmark and the Faroe Islands, life expectancy went up for both sexes in 2020 (data not yet available for Greenland and Åland). In Sweden, life expectancy fell by 0.7 years for males from 81.3 years to 80.6 and for females by 0.4 years from 84.7 to 84.3 years. The steeper decline in life expectancy for males is consistent with the larger number of excess deaths among males. Thus, compared to other Nordic countries, the adverse mortality impact of the pandemic has been greater in Sweden. However, when comparing Sweden to the rest of Europe, it is the Nordic countries, other than Sweden, which are exceptional. The trend among countries in Europe is for a fall in life expectancy in 2020. The largest declines were in countries in southern and eastern Europe. Italy and…
- 2022 March
- Demography
- Europe
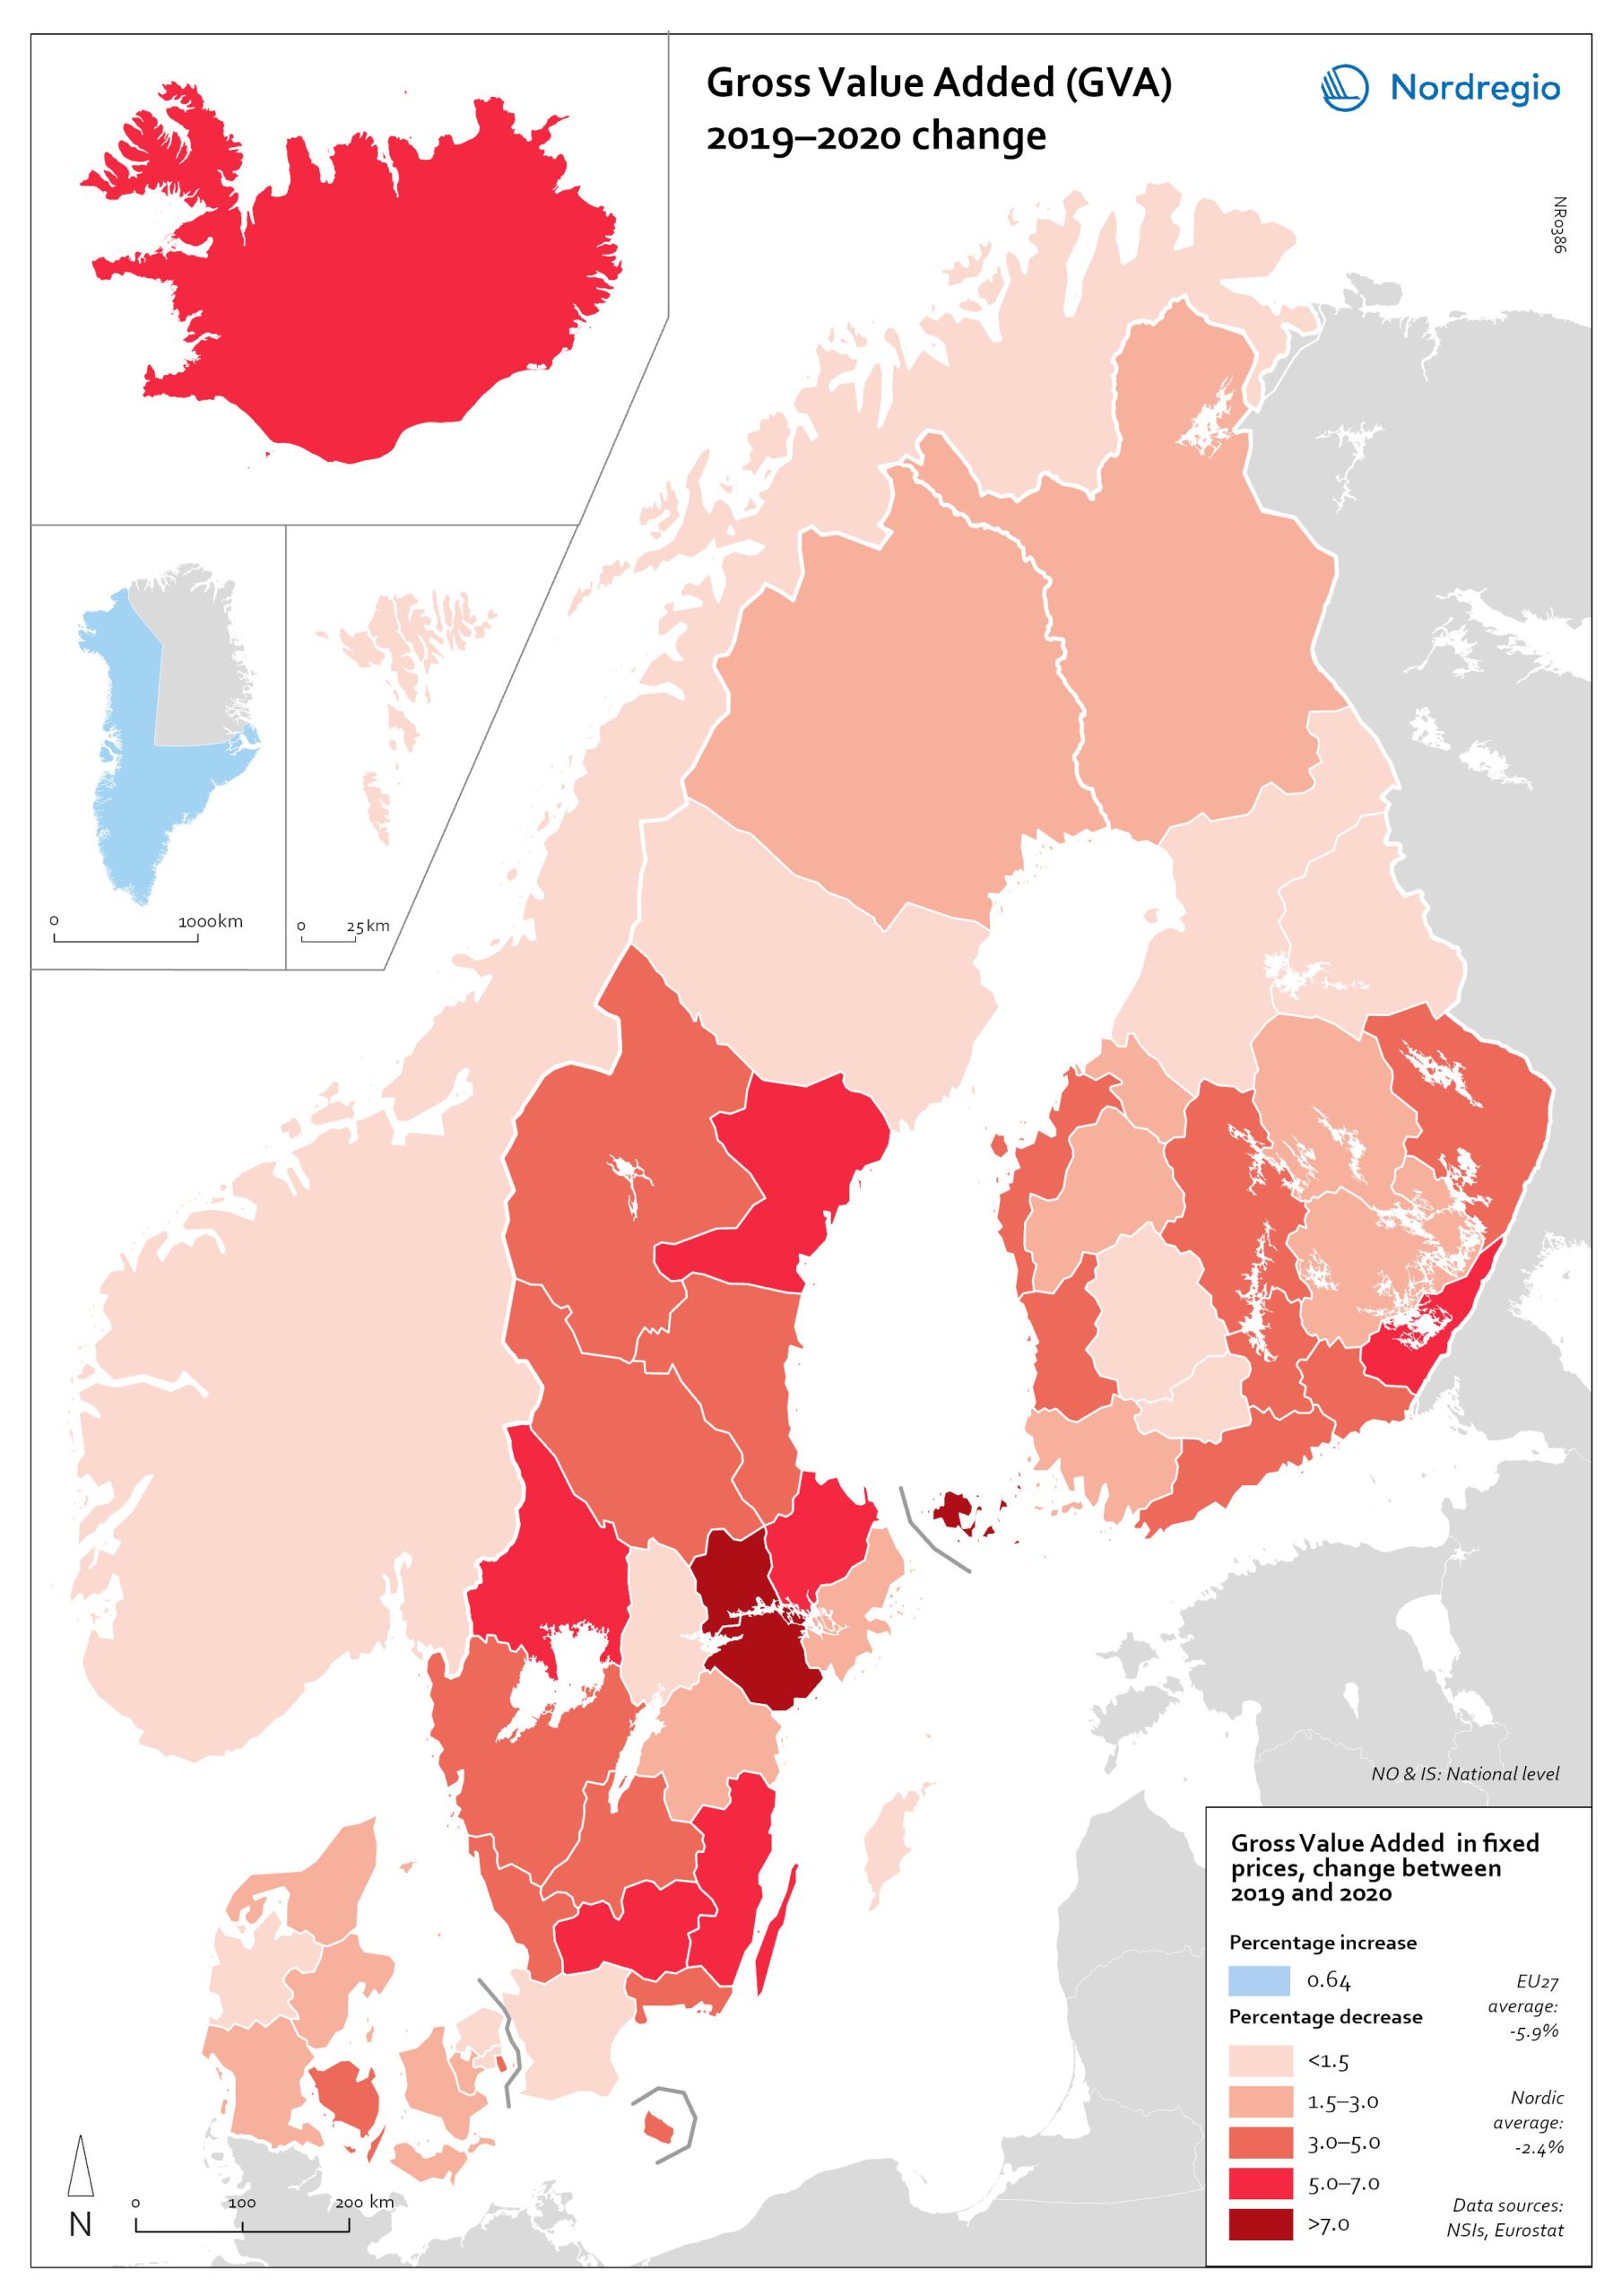
Gross Value Added (GVA) change 2019-2020
The map shows the change in regional Gross Value Added (GVA) from 2019 to 2020 (in fixed prices). As shown in the map, aggregated production levels, in terms of Gross Value Added (GVA), contracted in nearly all of the Nordic regions between 2019 and 2020. In general, the variability was comparatively smaller within each country than it was between countries, even when comparing regions with similar economic profiles from different countries. On average, the impact was greater on regions in Sweden and Finland than those in Denmark. Still, some relevant territorial patterns emerge from the changes to regional GVA shown in the map. The contraction was larger in regions with higher dependence on tourism services and hospitality (Åland and some municipalities in South Karelia, Finland, and Bornholm, Denmark), as well as on mass-market retail and logistics, particularly in the areas surrounding the capital regions (Södermanland and Västmanland in Sweden and Greater Copenhagen in Denmark). In Sweden and Finland, a remarkable regional divide can also be traced between territories specialised in transformation sectors with limited vulnerability to the impact of Covid-19, including forestry and specific types of processing (e.g. pulp, cement), like Nord Ostrobothnia, Kainuu and Pirkanmaa in Finland, and Gotland, Västerbotten and Örebro in Sweden. Aggregated output in these regions fell less than in regions with greater exposure to industrial manufacturing, like Kymenlaakso in Finland and Kronobergs in Sweden. Similarly, the impact on the financial centres in Denmark (Greater Copenhagen) and Sweden (Stockholm) was less than regions with mid-sized cities and diversified urban economies, like Vestjylland (Århus) in Denmark and Upsala in Sweden. Interestingly, the shock to the Finnish economy was greater in the Helsinki metropolitan area (-3.6% Uusimaa) than it was for the Tampere region (-0.5% in Pirkanmaa). This may be due to the relatively higher concentration…
- 2022 March
- Economy
- Nordic Region
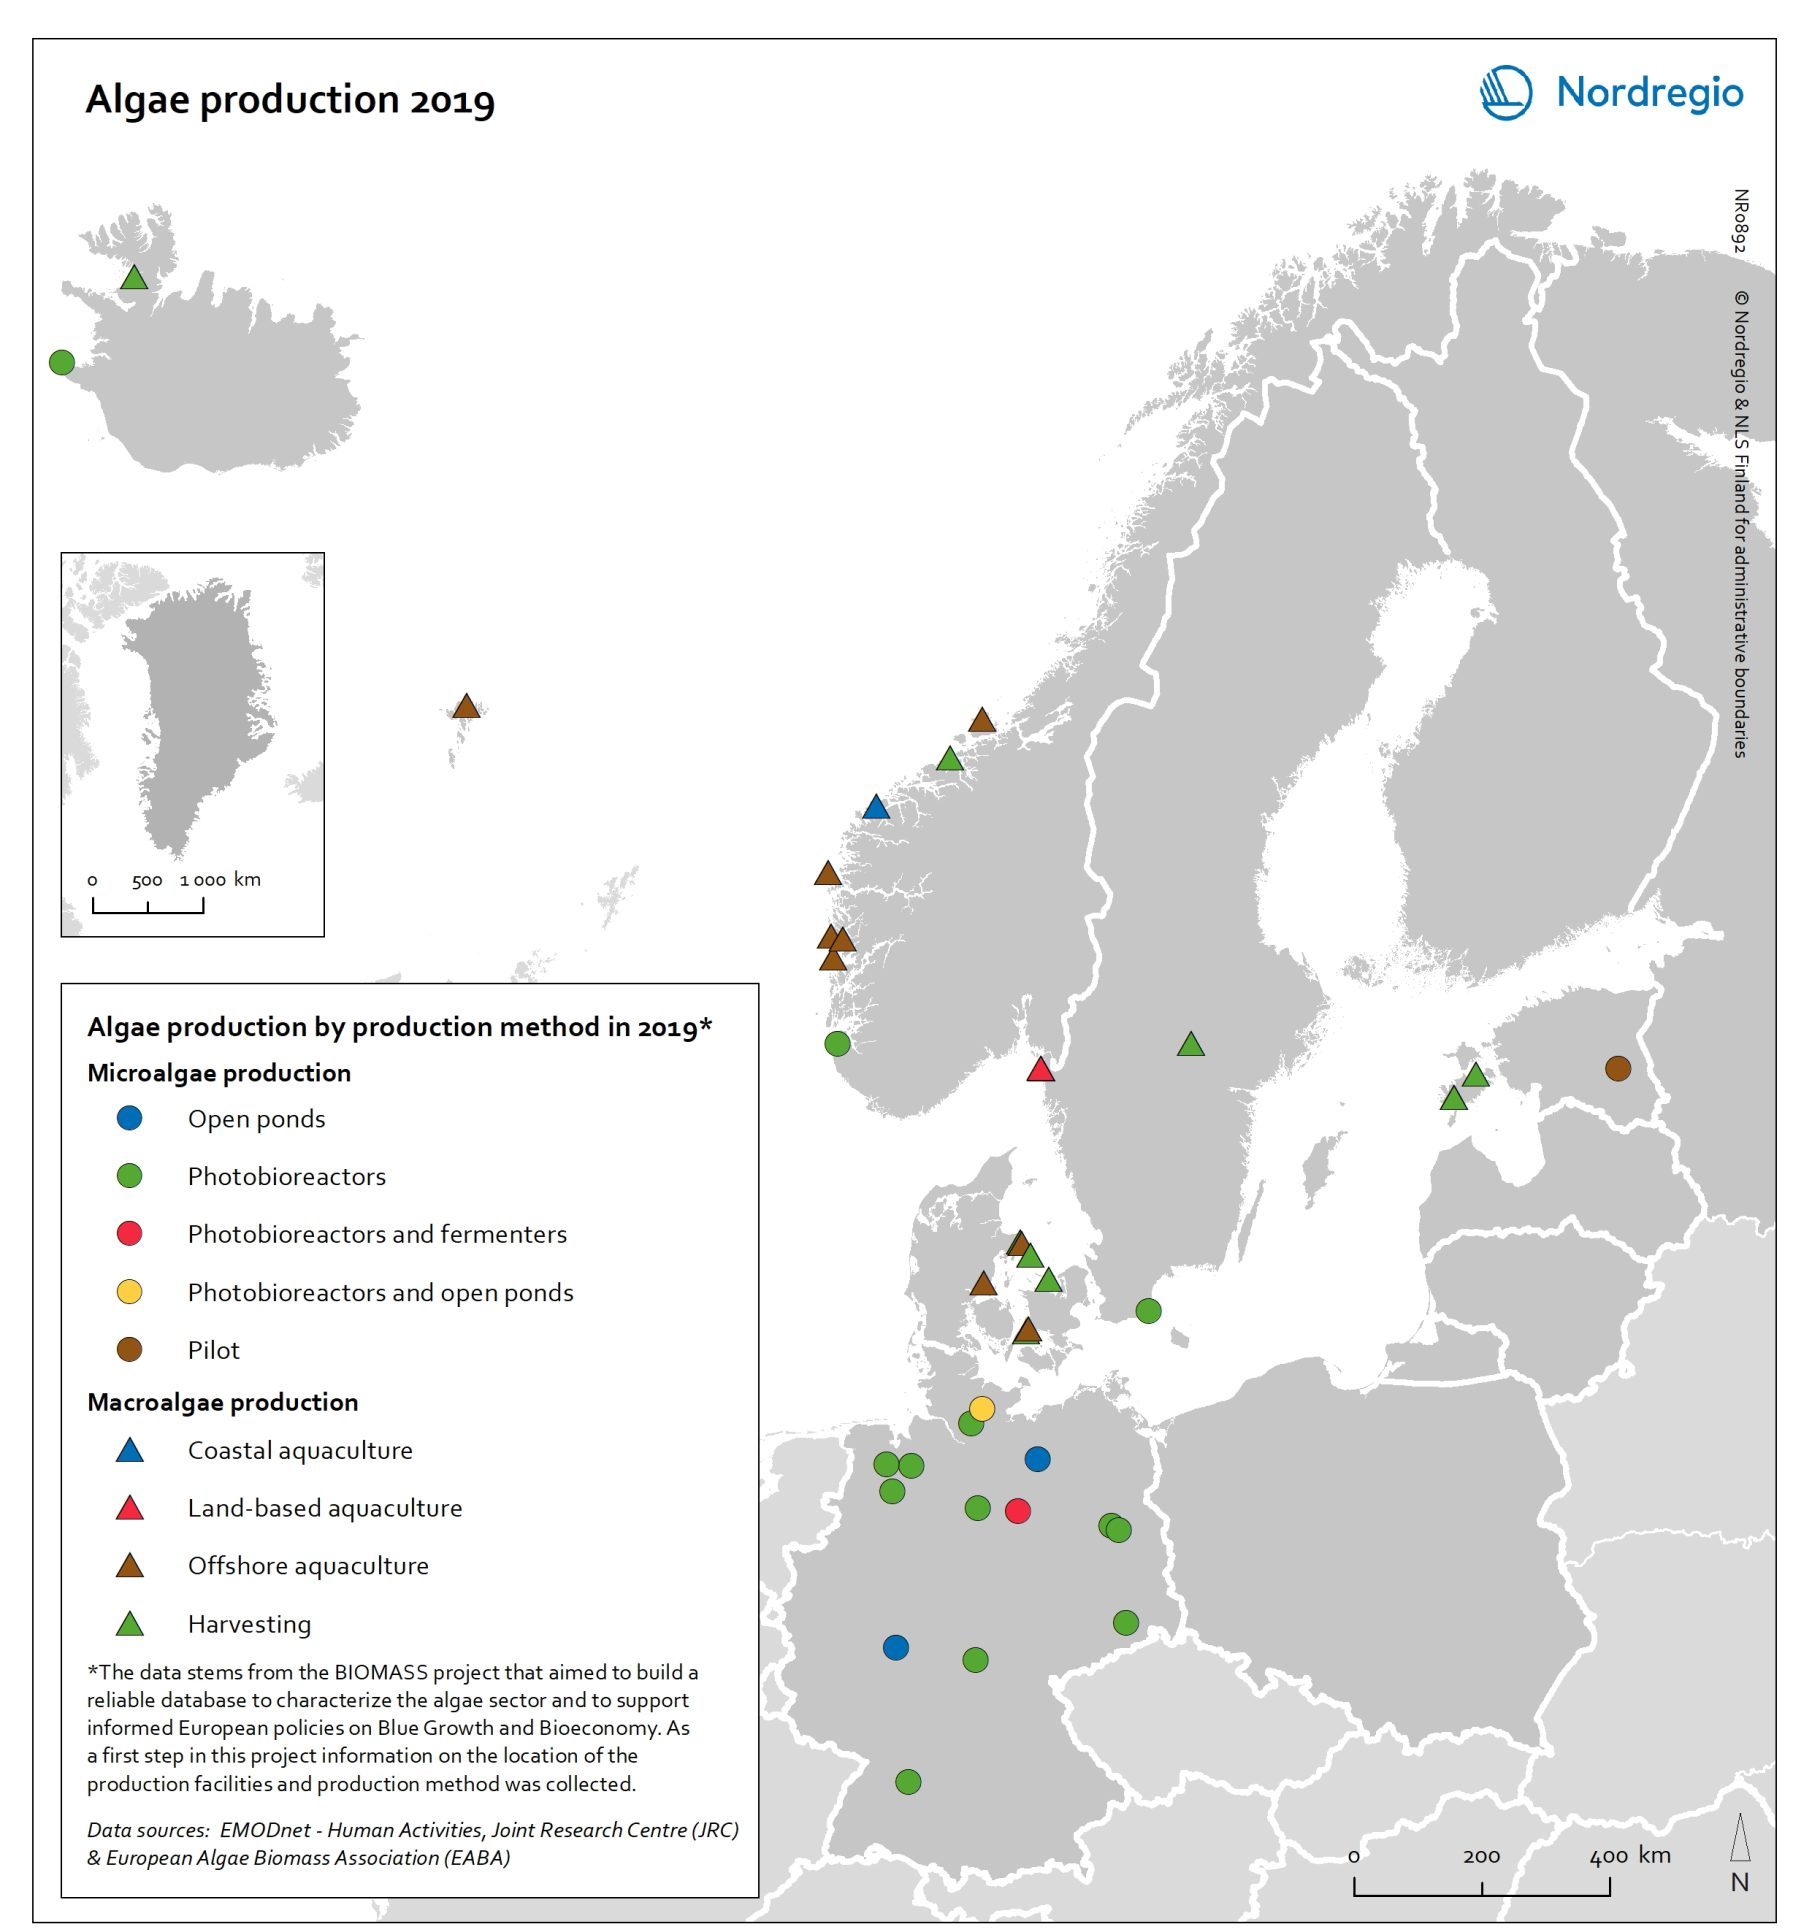
Algae production in 2019
This map shows location of algae production by production method in the Nordic Arctic and Baltic Sea Region in 2019 Algae and seaweeds are gaining attention as useful inputs for industries as diverse as energy and human food production. Aquatic vegetation – both in the seas and in freshwater – can grow at several times the pace of terrestrial plants, and the high natural oil content of some algae makes them ideal for producing a variety of products, from cosmetic oils to biofuels. At the same time, algae farming has added value in potential synergies with farming on land, as algae farms utilise nutrient run-off and reduce eutrophication. In addition, aquatic vegetation is a highly versatile feedstock. Algae and seaweed thrive in challenging and varied conditions and can be transformed into products ranging from fuel, feeds, fertiliser, and chemicals, to third-generation sugar and biomass. These benefits are the basis for seaweed and algae emerging as one of the most important bioeconomy trends in the Nordic Arctic and Baltic Sea region. The production of algae for food and industrial uses has hence significant potential, particularly in terms of environmental impact, but it is still at an early stage. The production of algae (both micro- and macroalgae) can take numerous forms, as shown by this map. At least nine different production methods were identified in the region covered in this analysis. A total of 41 production sites were operating in Denmark, Estonia, the Faroe Islands, Iceland, Norway, Germany, and Sweden. Germany has by far the most sites for microalgae production, whereas Denmark and Norway have the most macroalgae sites.
- 2021 December
- Arctic
- Baltic Sea Region
- Nordic Region
- Others
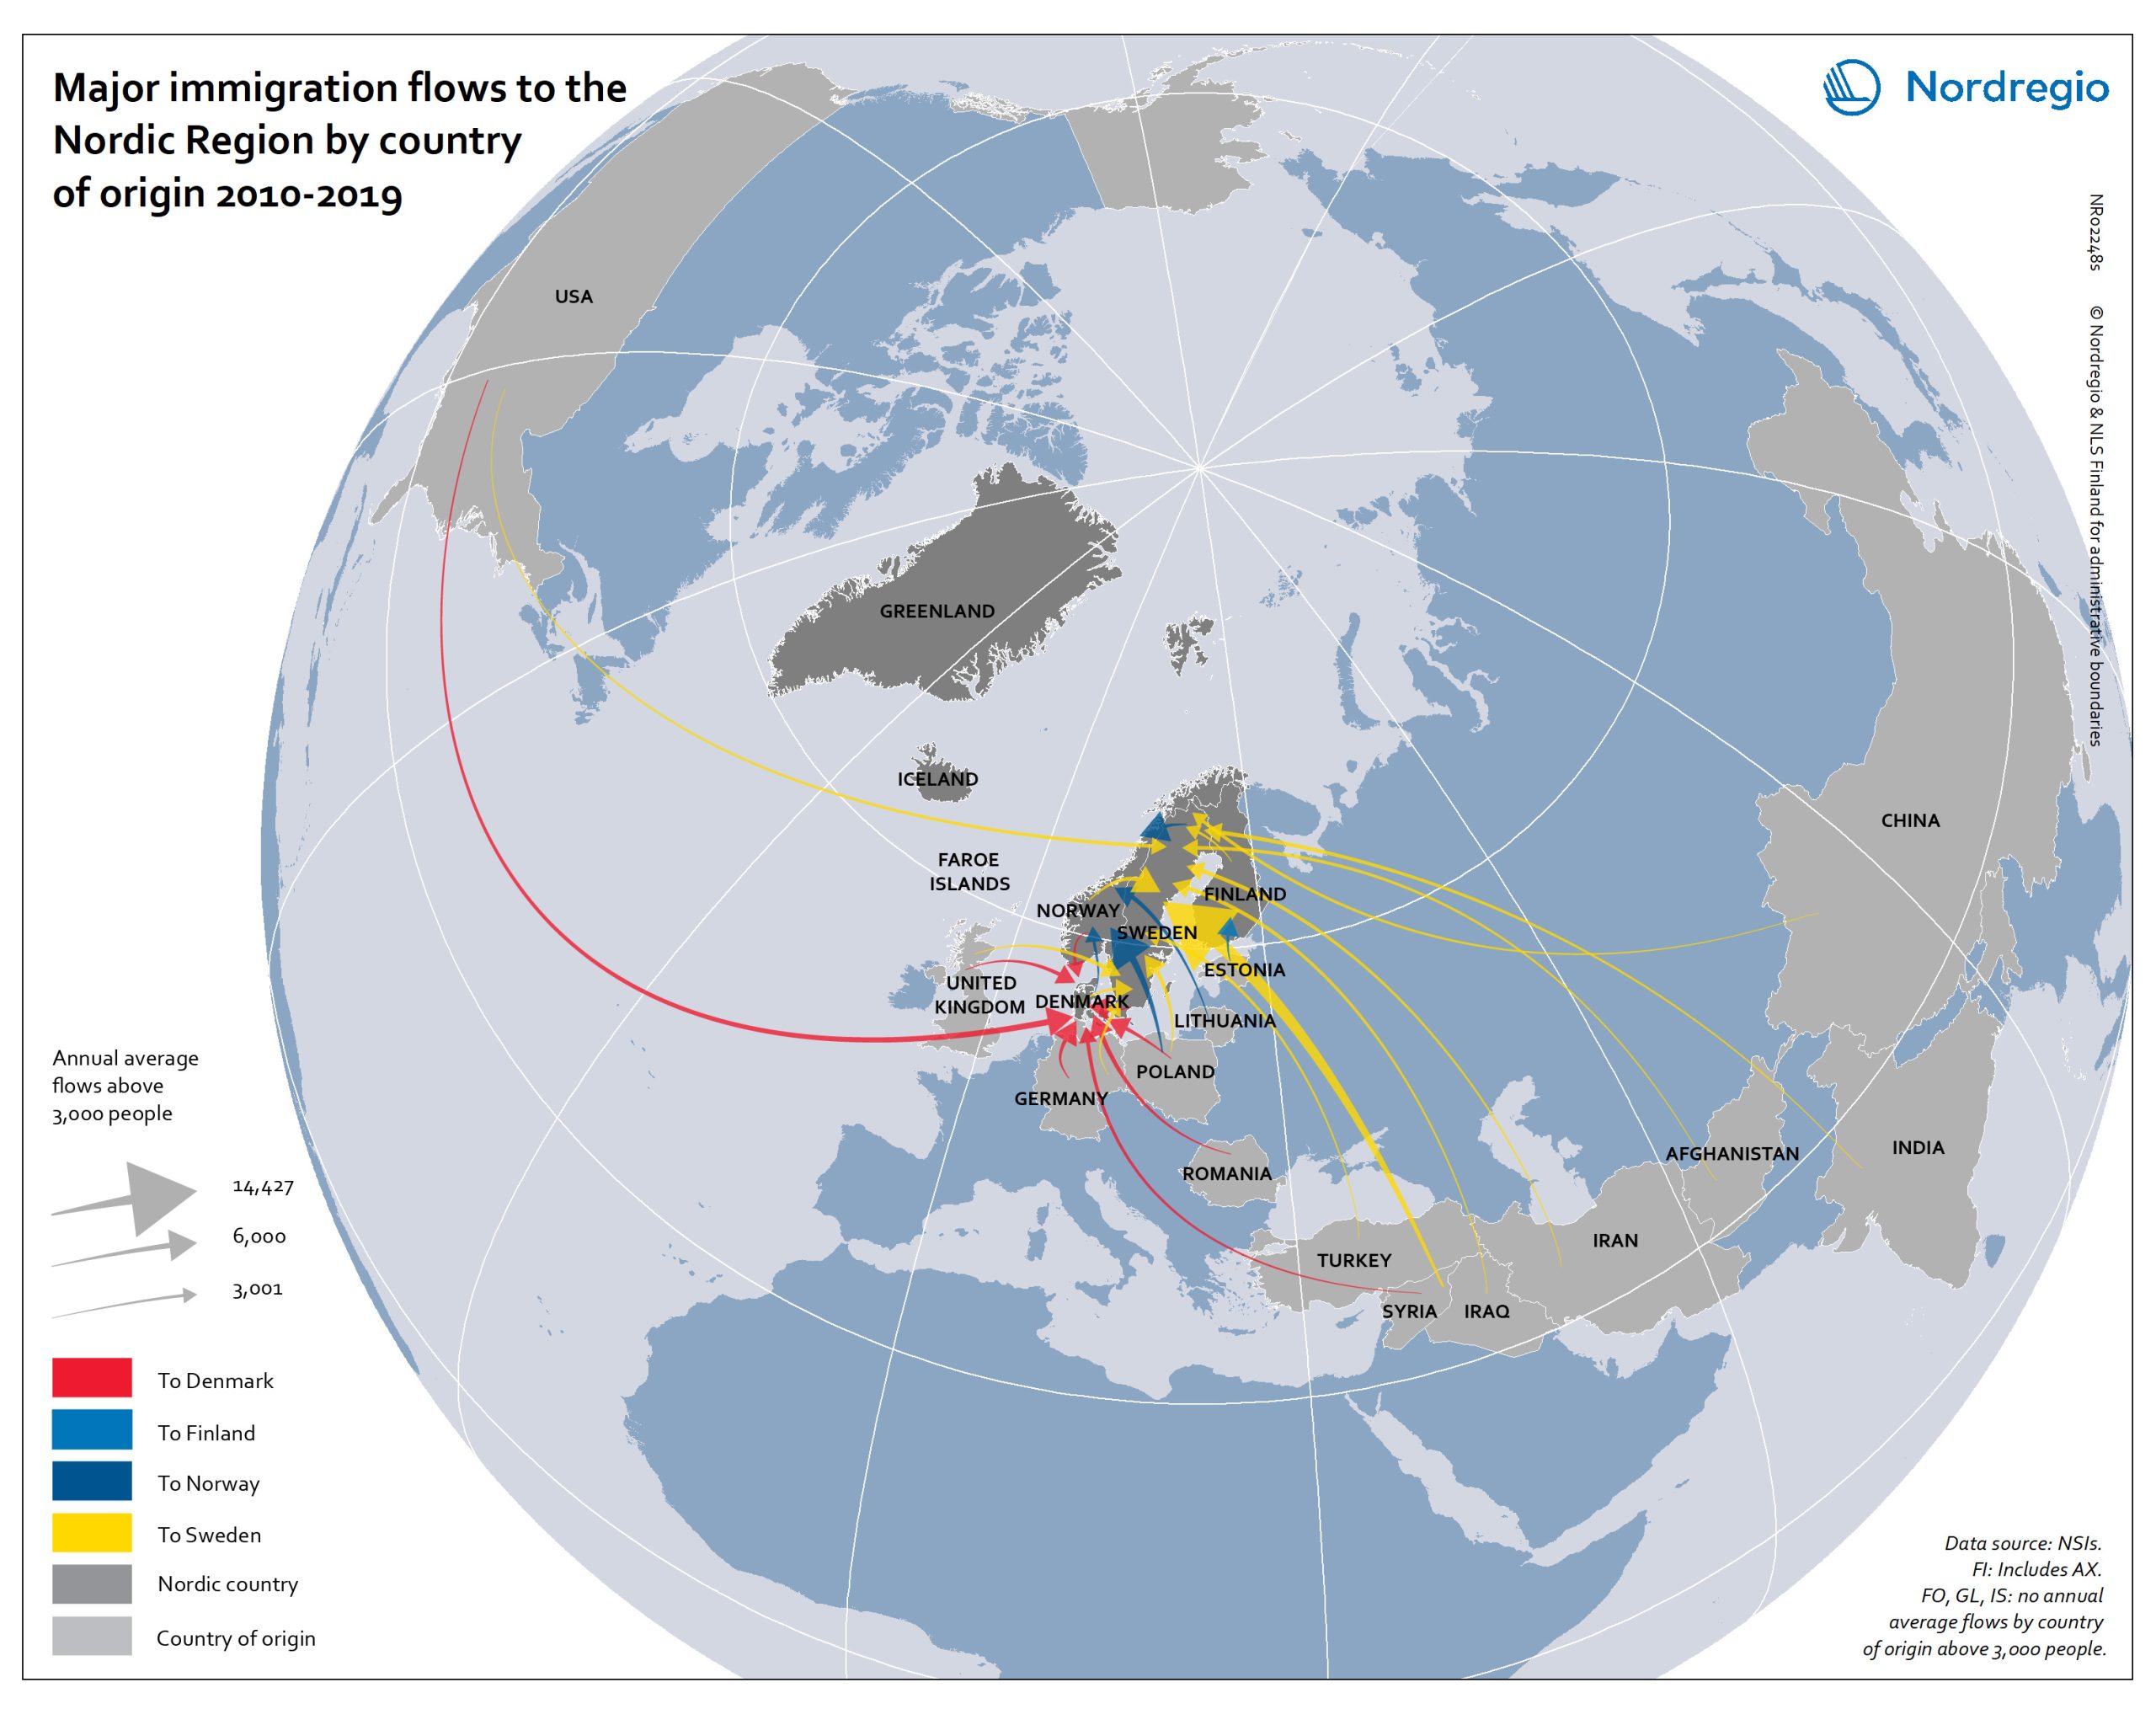
Major immigration flows to the Nordic Region from 2010 to 2019
The map shows annual average immigration flows above 3,000 people, and the growing diversity in their countries of origin Sweden and Denmark, in particular, experienced large inflows from non-Nordic countries during the period 2010-2019, with Sweden standing out as the Nordic country with by far the largest immigrant in-flows. A large portion of these arrivals were from war-torn Syria (an annual average of almost 15,000), followed by Poland (approximately 4,500), United Kingdom, Iraq, India and Iran (around 4,000 each). Denmark experienced a smaller number of inflows above 3,000 people, compared to Sweden. The largest non-Nordic inflows to Denmark were around 5,000 people (per sending country) and included migrants from the U.S., Germany, Romania and Poland. For Norway, large non-Nordic in-flows were limited to Lithuania and Poland. Similarly, Finland had only one major inflow, from Estonia.
- 2021 December
- Migration
- Nordic Region
