25 Maps
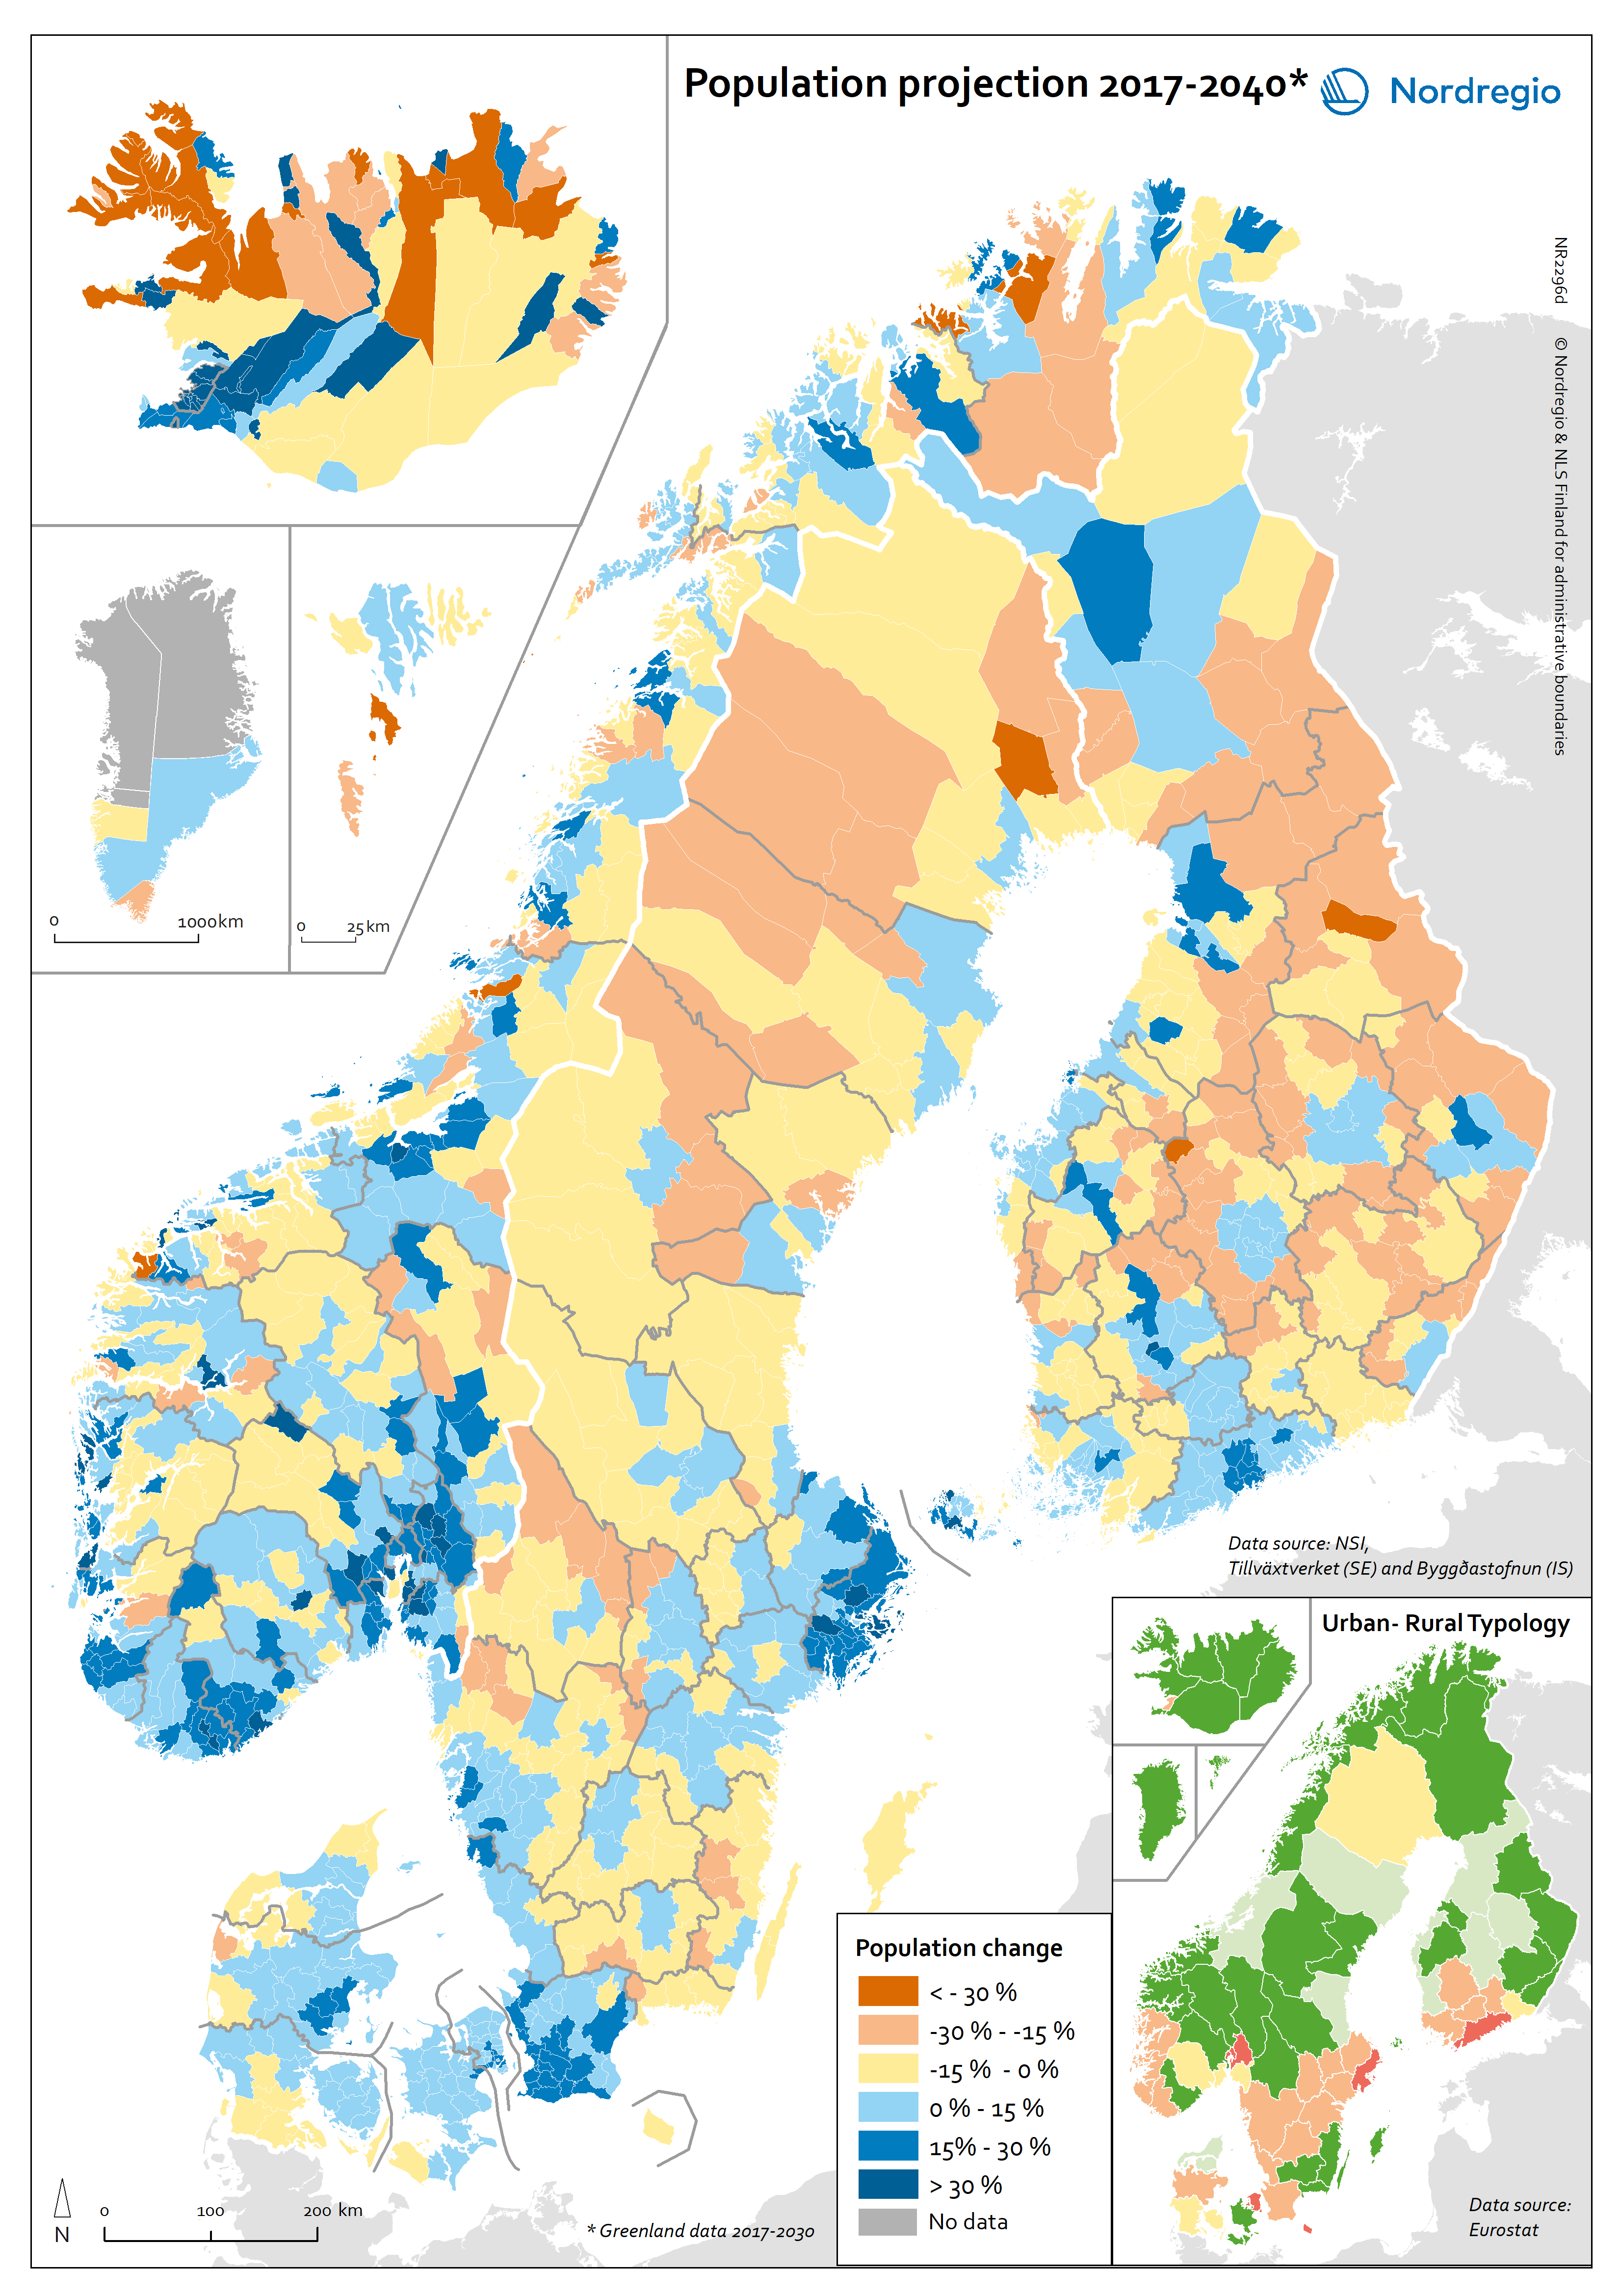
Population projection 2017-2040
This map shows the expected population change in Nordic municipalities by looking at the change between 2017 and 2040. The colours on the main map indicates the percentage of population change at municipal level between 2017 and 2040. Shades of red indicate a population decline, whereas shades of blue indicate a population increase. The colours on the regional map (bottom-right corner) indicates the type of region according to the Eurostat’s urban-rural typology (see: http://nordregio.org/maps/urban-rural-typology-of-nordic-regions/): shades of red indicate predominantly urban regions, yellow for intermediate regions and shades of green for predominantly rural regions. In the two types of regions classified as predominantly rural (“light green” and „dark green“ regions), population growth largely remains concentrated in larger towns and their suburbs. This is particularly the case in Sweden and Finland. For instance, the regional capitals Östersund in Jämtland (SE) and Seinäjoki in South Ostrobothnia (FI) are expected to have larger populations in 2040 than today, while most other municipalities in these regions will decline. In Norway and Iceland, a somewhat more nuanced pattern applies. Here population growth is not only expected in regional capitals and other larger towns, but also in some smaller and more remote municipalities. In Denmark, finally, population growth is expected for large parts of the country until 2040, in more rural and urban areas alike. Population loss is only expected in some of the most remote municipalities at the Northern, Eastern and Southern borders of the country. While the population loss in rural regions is hence expected to continue across the Nordic Region, it appears to be more pronounced in some countries than in others. In the predominantly urban (“red”) regions, the opposite pattern applies: With very few exceptions, municipalities in these regions are expected to experience a growth in population numbers until 2040.
 2020 September
 - Demography
- Nordic Region
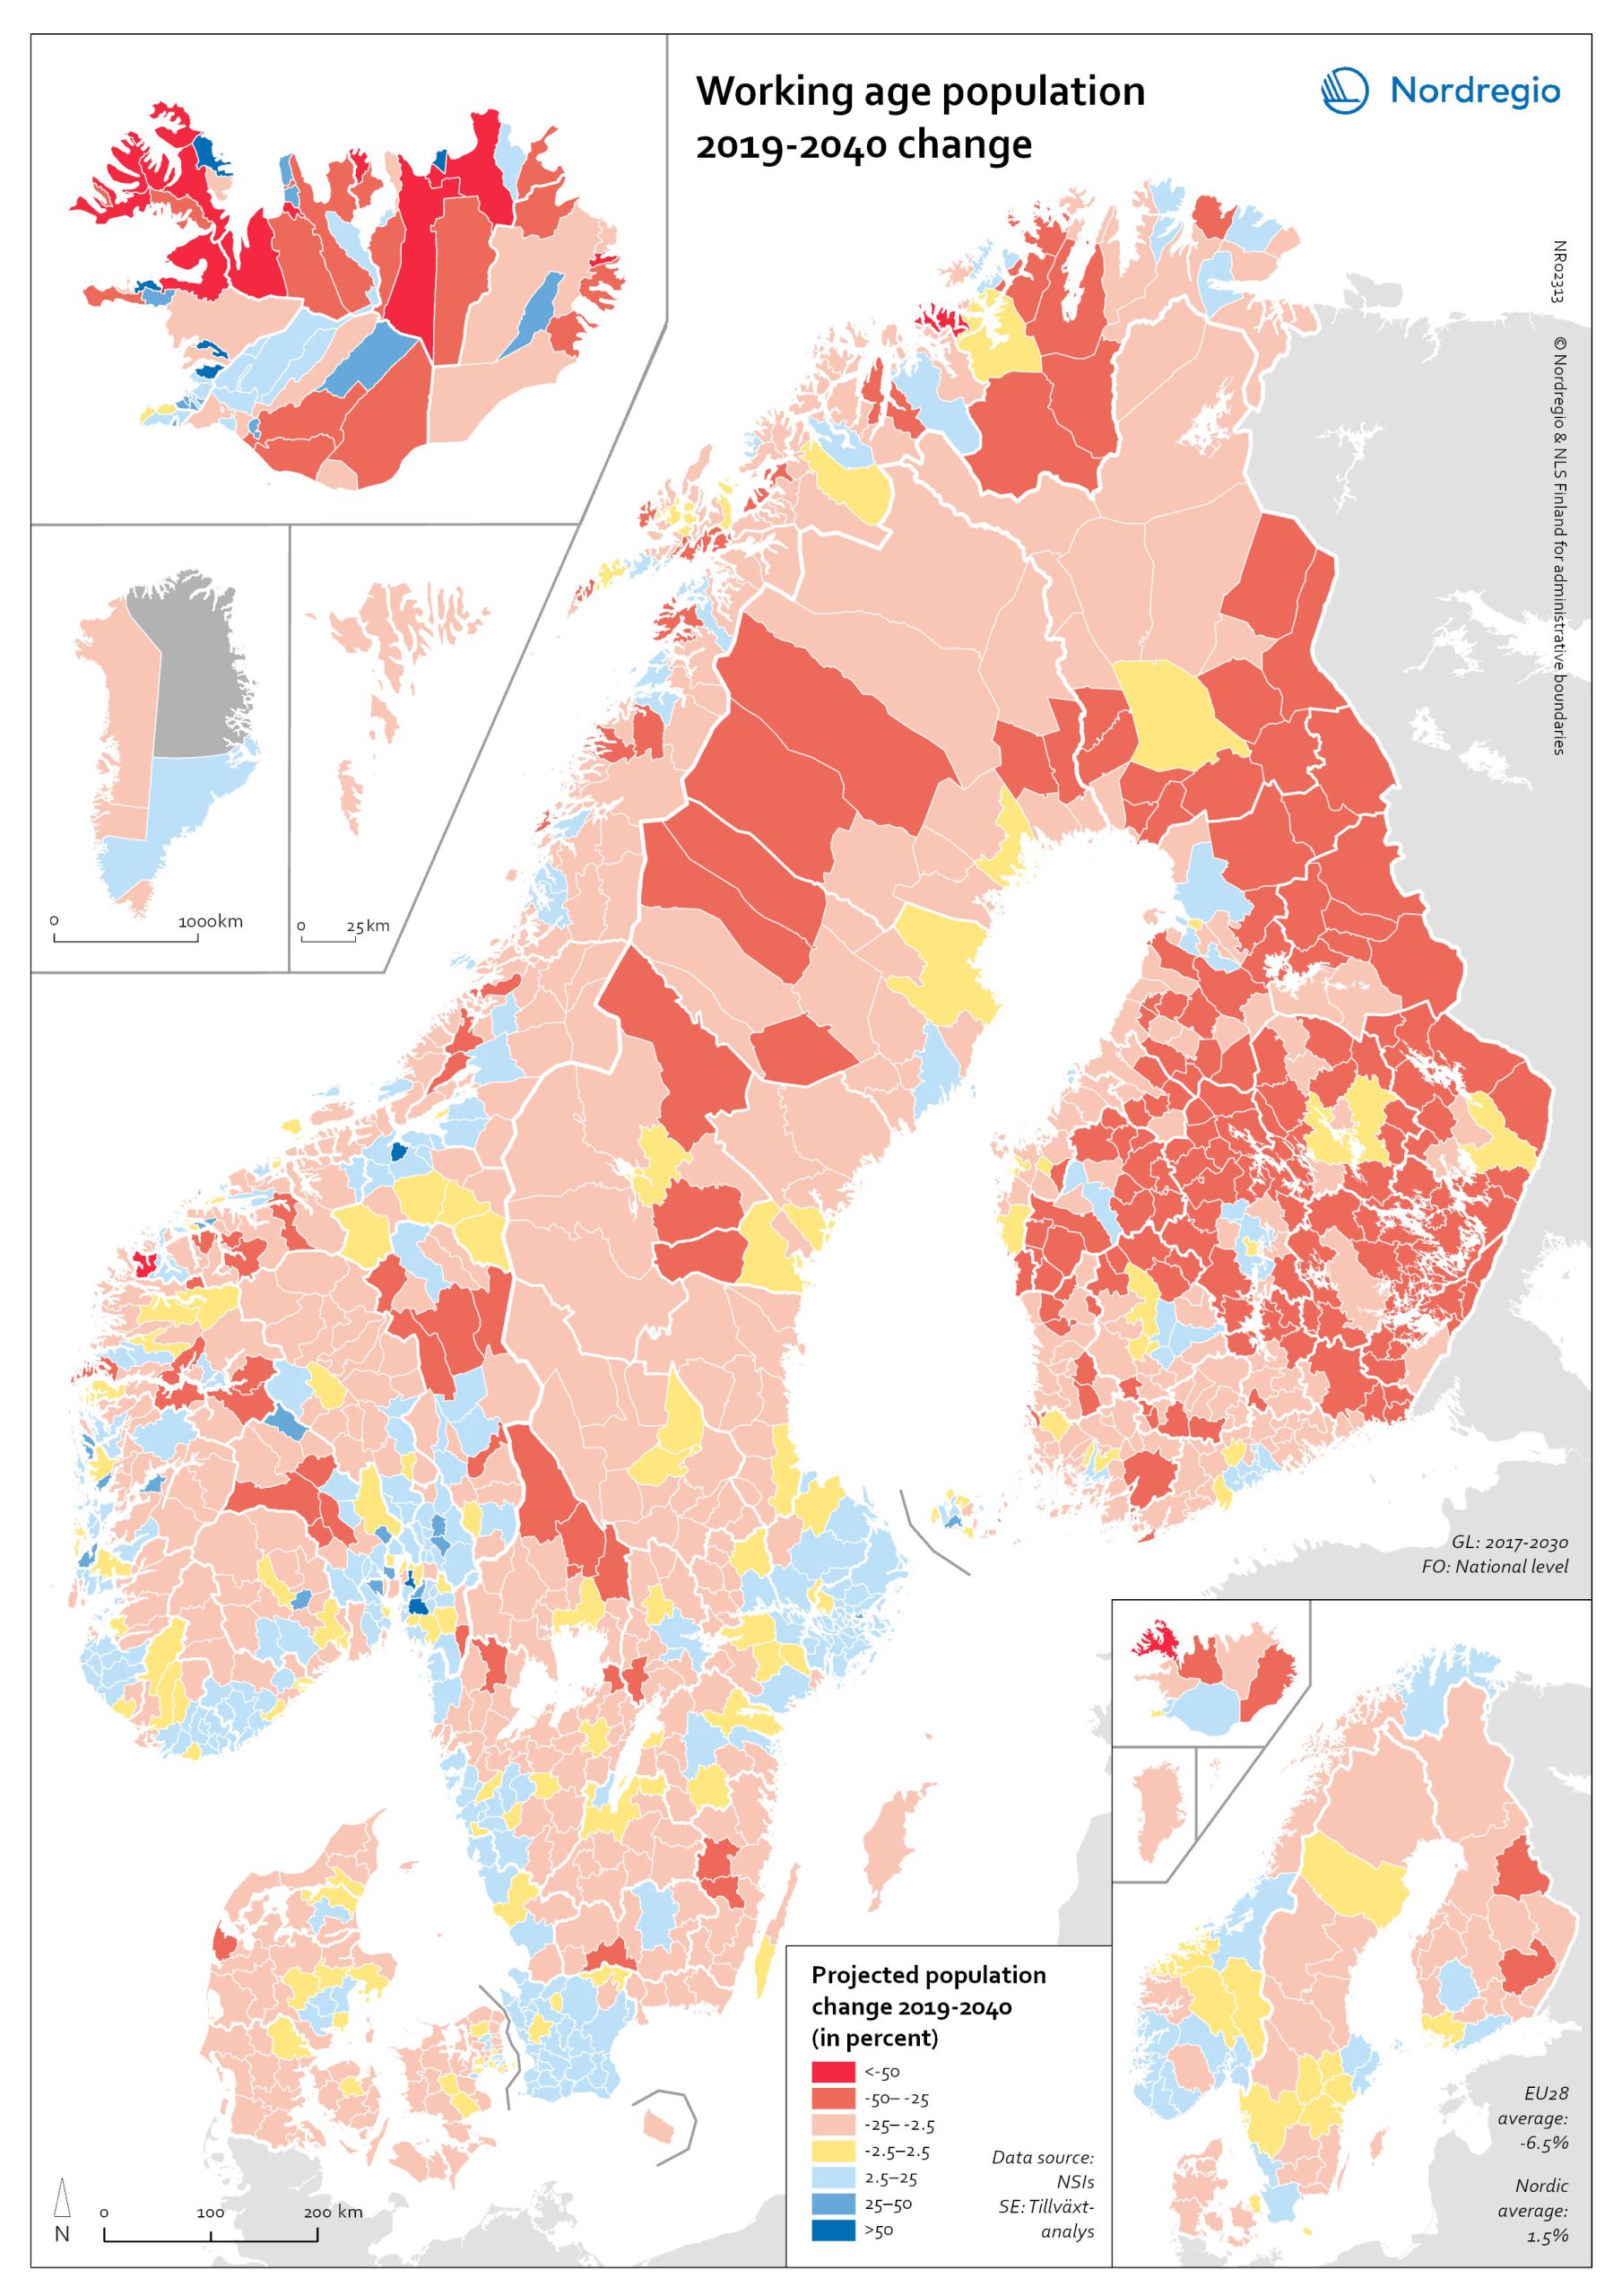
Change in working age population 2019-2040
This map shows the projected working age population change at municipal level during the period 2019-2040 While the total population of the Nordic Region is projected to grow by 8% to 29.5 million by 2040, the growth of the working-age population (15–64 years) is expected to be more modest at 1.5%. The working-age population also referred to as the potential labour supply, refers to all people in the population aged 15–64 years. It is a potential supply because it includes all those who fit the age requirement, despite some not actually being available for the labour market (e.g. full-time students, those with long-term illnesses or disabilities that affect their ability to work). The potential labour supply at the local level is constantly shifting due to trends such as ageing, migration and urbanisation. The red areas on the map indicate a projected working-age population decline and blue areas an increase. The yellow areas indicate a stable development. On a national level Greenland (-16.2%), the Faroe Islands (-6.6%), Finland (-3%) and Denmark (-2%) are projected to see a decrease in the working-age population, while increases are projected in Sweden (4%), Norway (4.6%), Åland (9.1%) and Iceland (10.9%). It is worth noting that, even in the parts of the Nordic Region where the working-age population is expected to shrink, the projections are less severe than the EU28 average (-6.5%). Greenland and Faroe Islands are the only exceptions. At the municipal level, the variation is even more striking with the majority (72%) of Nordic municipalities projected to experience a decrease in the size of the working-age population. As Figure 6.2 shows, this trend is most pronounced in Finland (decline of the working-age population in 90% of the municipalities) and Denmark (81%) and less apparent in Sweden (67%), Iceland (64%) and Norway (61%). Most of…
- 2020 February
- Demography
- Labour force
- Migration
- Nordic Region
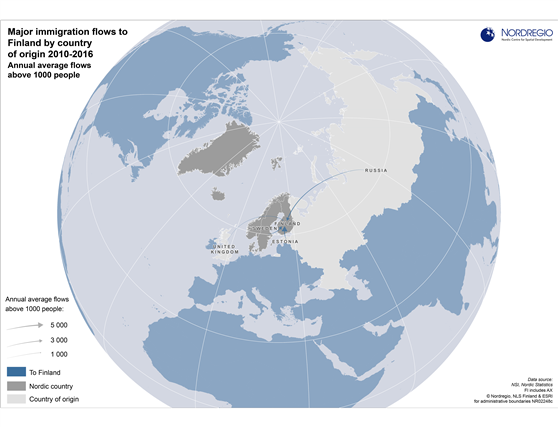
Major immigration flows to Finland 2010-2016
Average annual flows above 1000 people by country of origin Migration flows by country of origin are of growing interest in the Nordic Region due to the recent unprecedented inflows of migrants. There are also interesting differences between the Nordic countries with respect to the dominant countries of origin of migrants and the size of inflows. Finland had only four inflows exceeding annual averages of 1000 people during the measured period. The inflow from Estonia was by far the largest, an annual average of around 5000 people, flowed by inflows from Sweden and Russia (just under 3000), and the United Kingdom (around 1000).
- 2017 June
- Demography
- Finland
- Migration
- Nordic Region
- Other
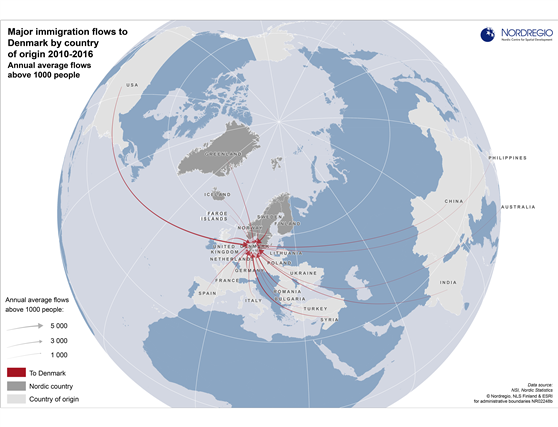
Major immigration flows to Denmark 2010-2016
Average annual flows above 1000 people by country of origin Migration flows by country of origin are of growing interest in the Nordic Region due to the recent unprecedented inflows of migrants. There are also interesting differences between the Nordic countries with respect to the dominant countries of origin of migrants and the size of inflows. During the measured period, there were more than 23 average annual inflows to Denmark that exceeded 1000 people. However, none of these inflows were as large as the dominant inflows to Norway and Sweden during the same period. The largest inflows to Denmark were around 5000 people each from U.S., Sweden, Germany and Poland. Due to historic and political connections, Denmark, unlike Norway, Finland and Sweden, had substantial annual inflows from the Faroe Islands, Greenland and Iceland (around 1000 or 2000 each). These numbers are particularly notable in the context of the small populations of
- 2017 June
- Demography
- Migration
- Nordic Region
- Other
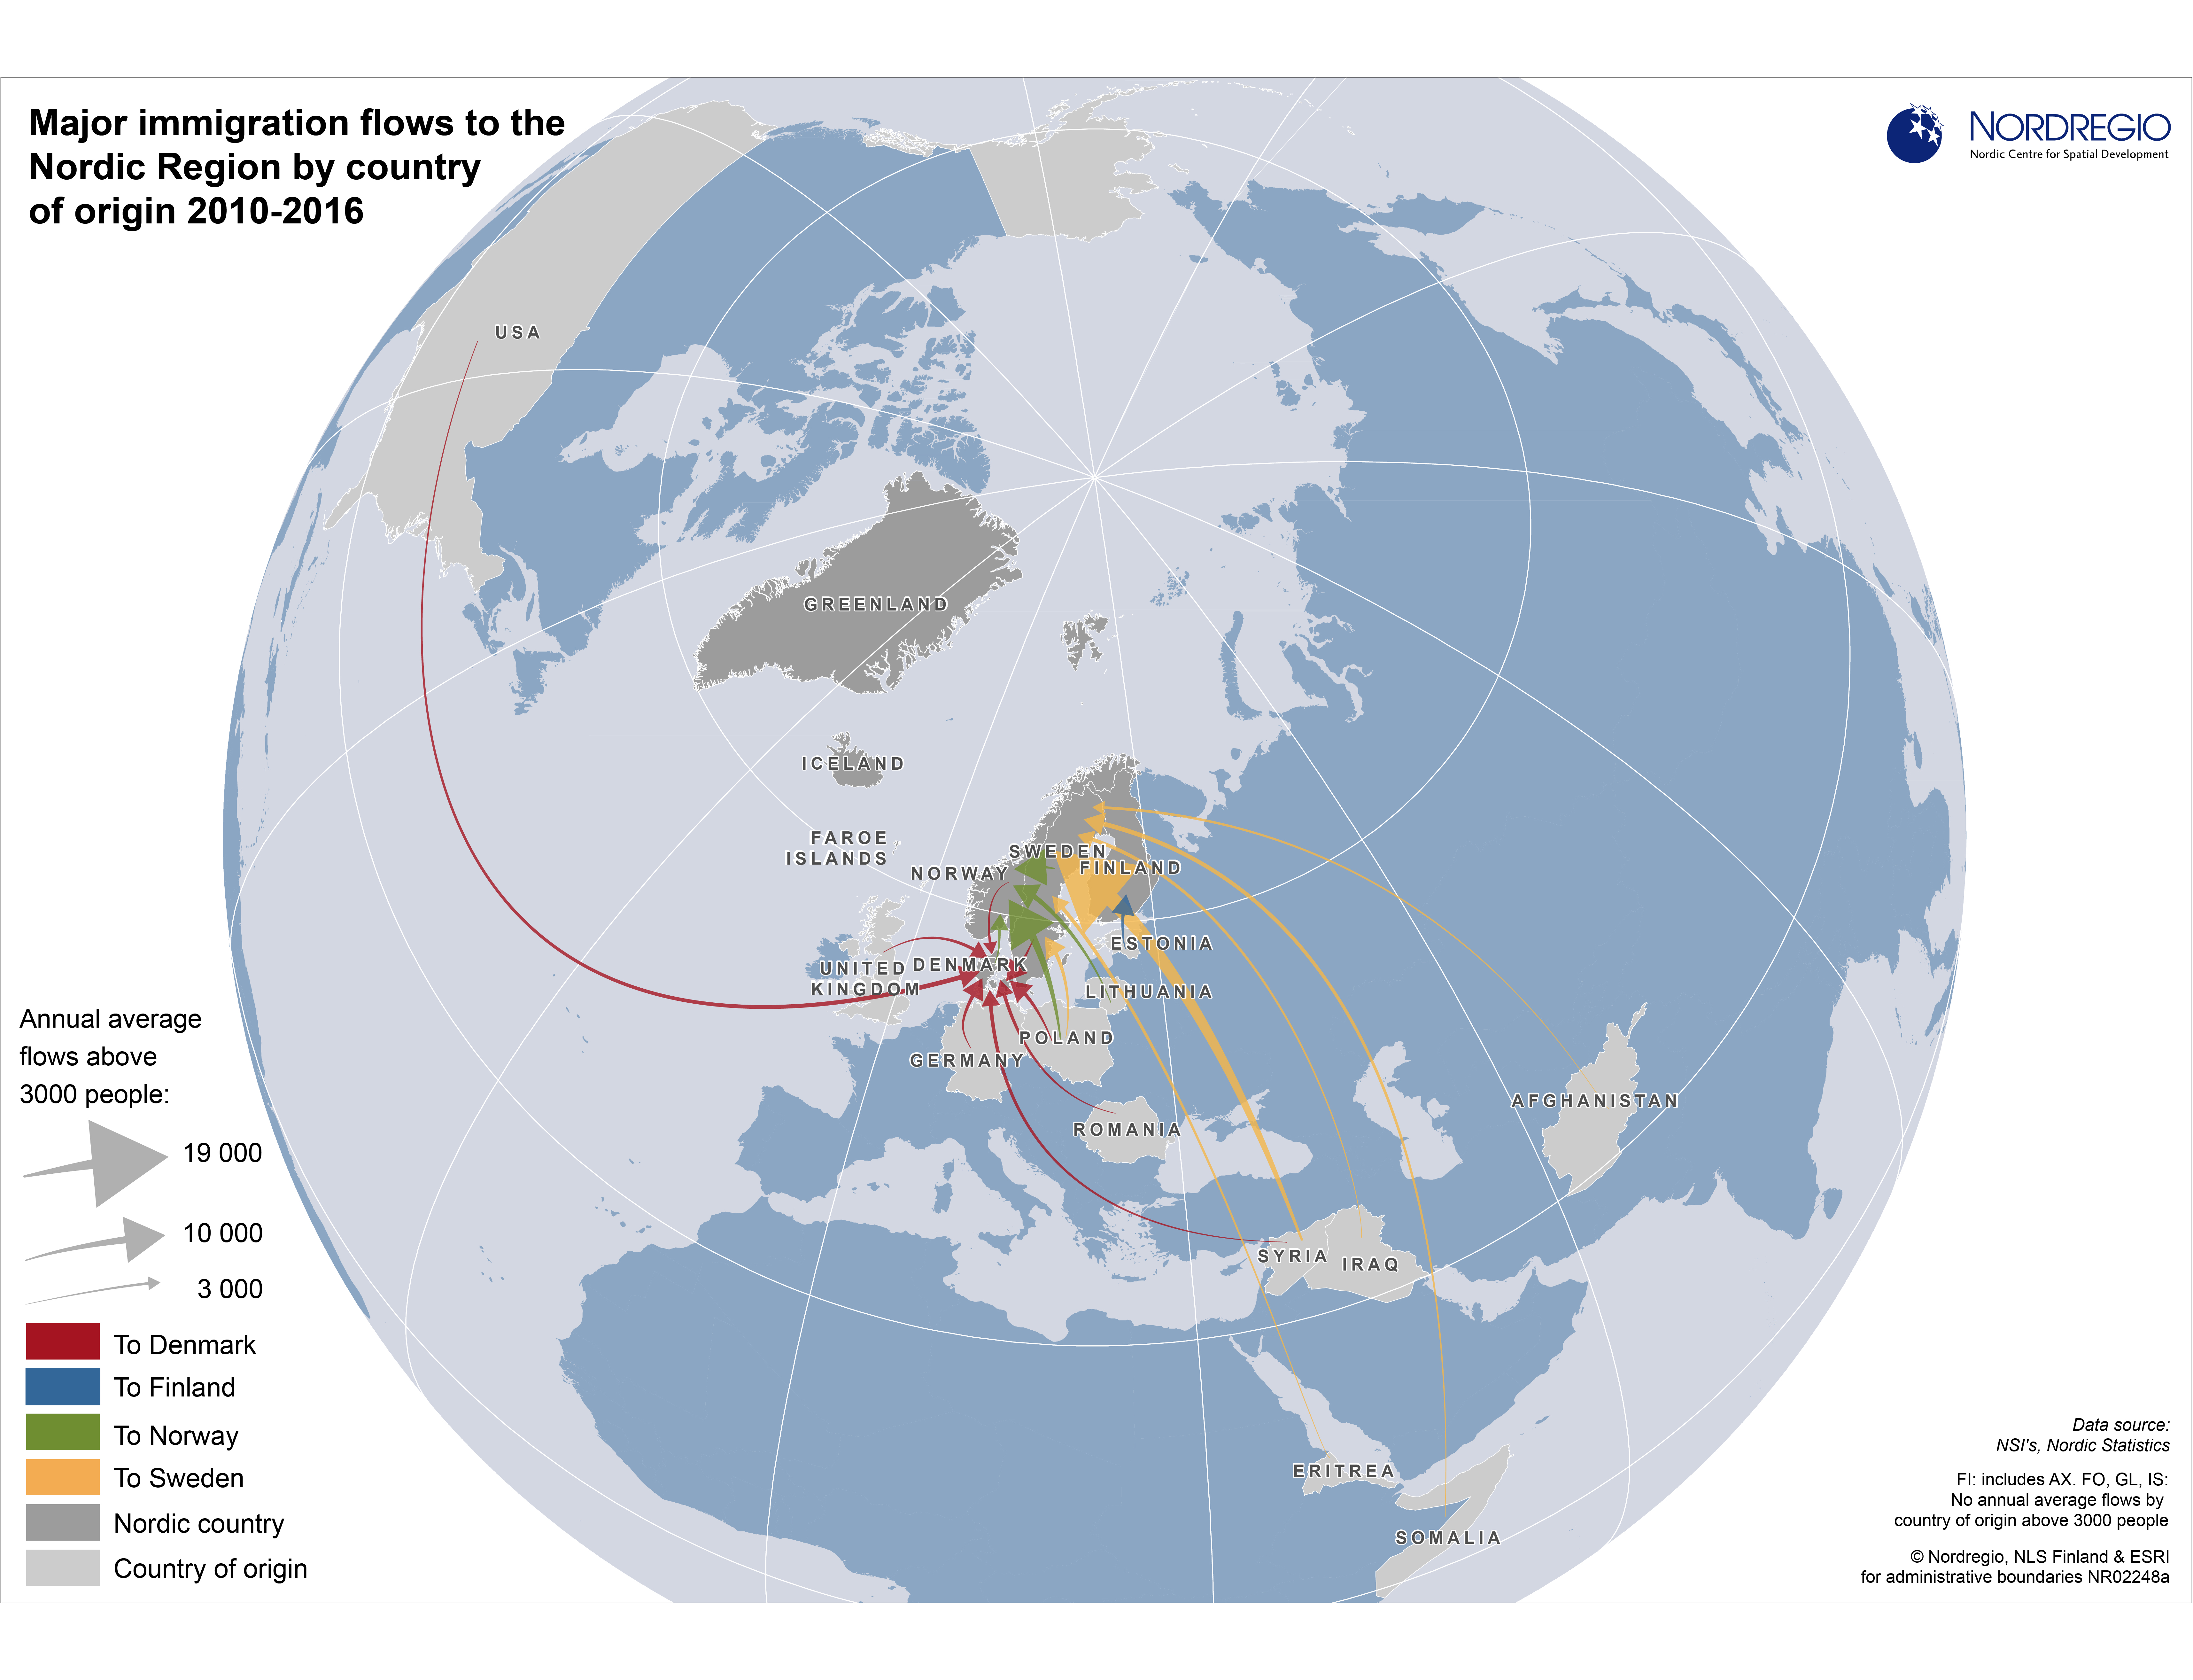
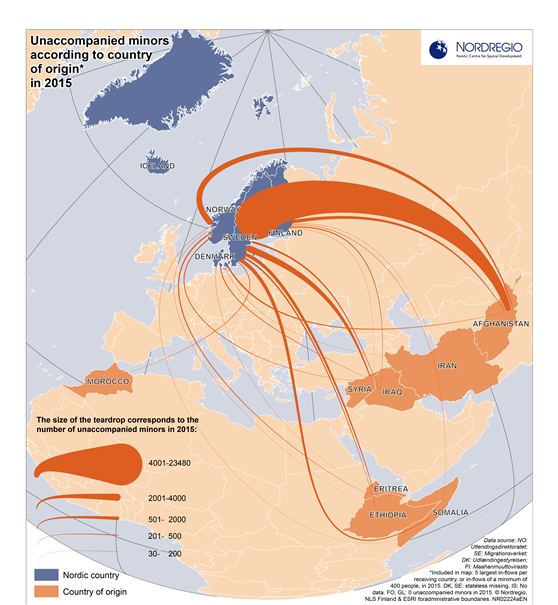
Major immigration flows to the Nordic Region 2010-2016
Average annual flows above 3000 people by country of origin Migration flows by country of origin are of growing interest in the Nordic Region due to the recent unprecedented inflows of migrants. There are also interesting differences between the Nordic countries with respect to the dominant countries of origin of migrants and the size of inflows. The map shows some clear spatial patterns regarding the dominant countries of origin of migrants and the size of inflows to each of the Nordic countries. Finland had only one average annual inflow of over 3000 people during the measured period, namely from Estonia. Compared to the other Nordic countries, Sweden had by far the largest immigrant flows, with average annual arrivals of nearly 19 000 immigrants from Syria, around 5000 from both Somalia and Poland, about 4000 from Iraq and Eritrea, and circa 3000 from Afghanistan, India, China and Iran. For Norway, inflows above 3000 people were all from nearby countries: Sweden, Lithuania, Denmark, and Poland. Inflows from Poland were particularly high – an annual average of almost 11 000 people. Although Denmark experienced a similar number of inflows above 3000 people, these inflows were smaller and more evenly distributed than in Norway and Sweden. The largest inflows were around 5000 people and included migrants from the U.S., Sweden, Germany and Poland.
- 2017 June
- Demography
- Migration
- Nordic Region
- Other
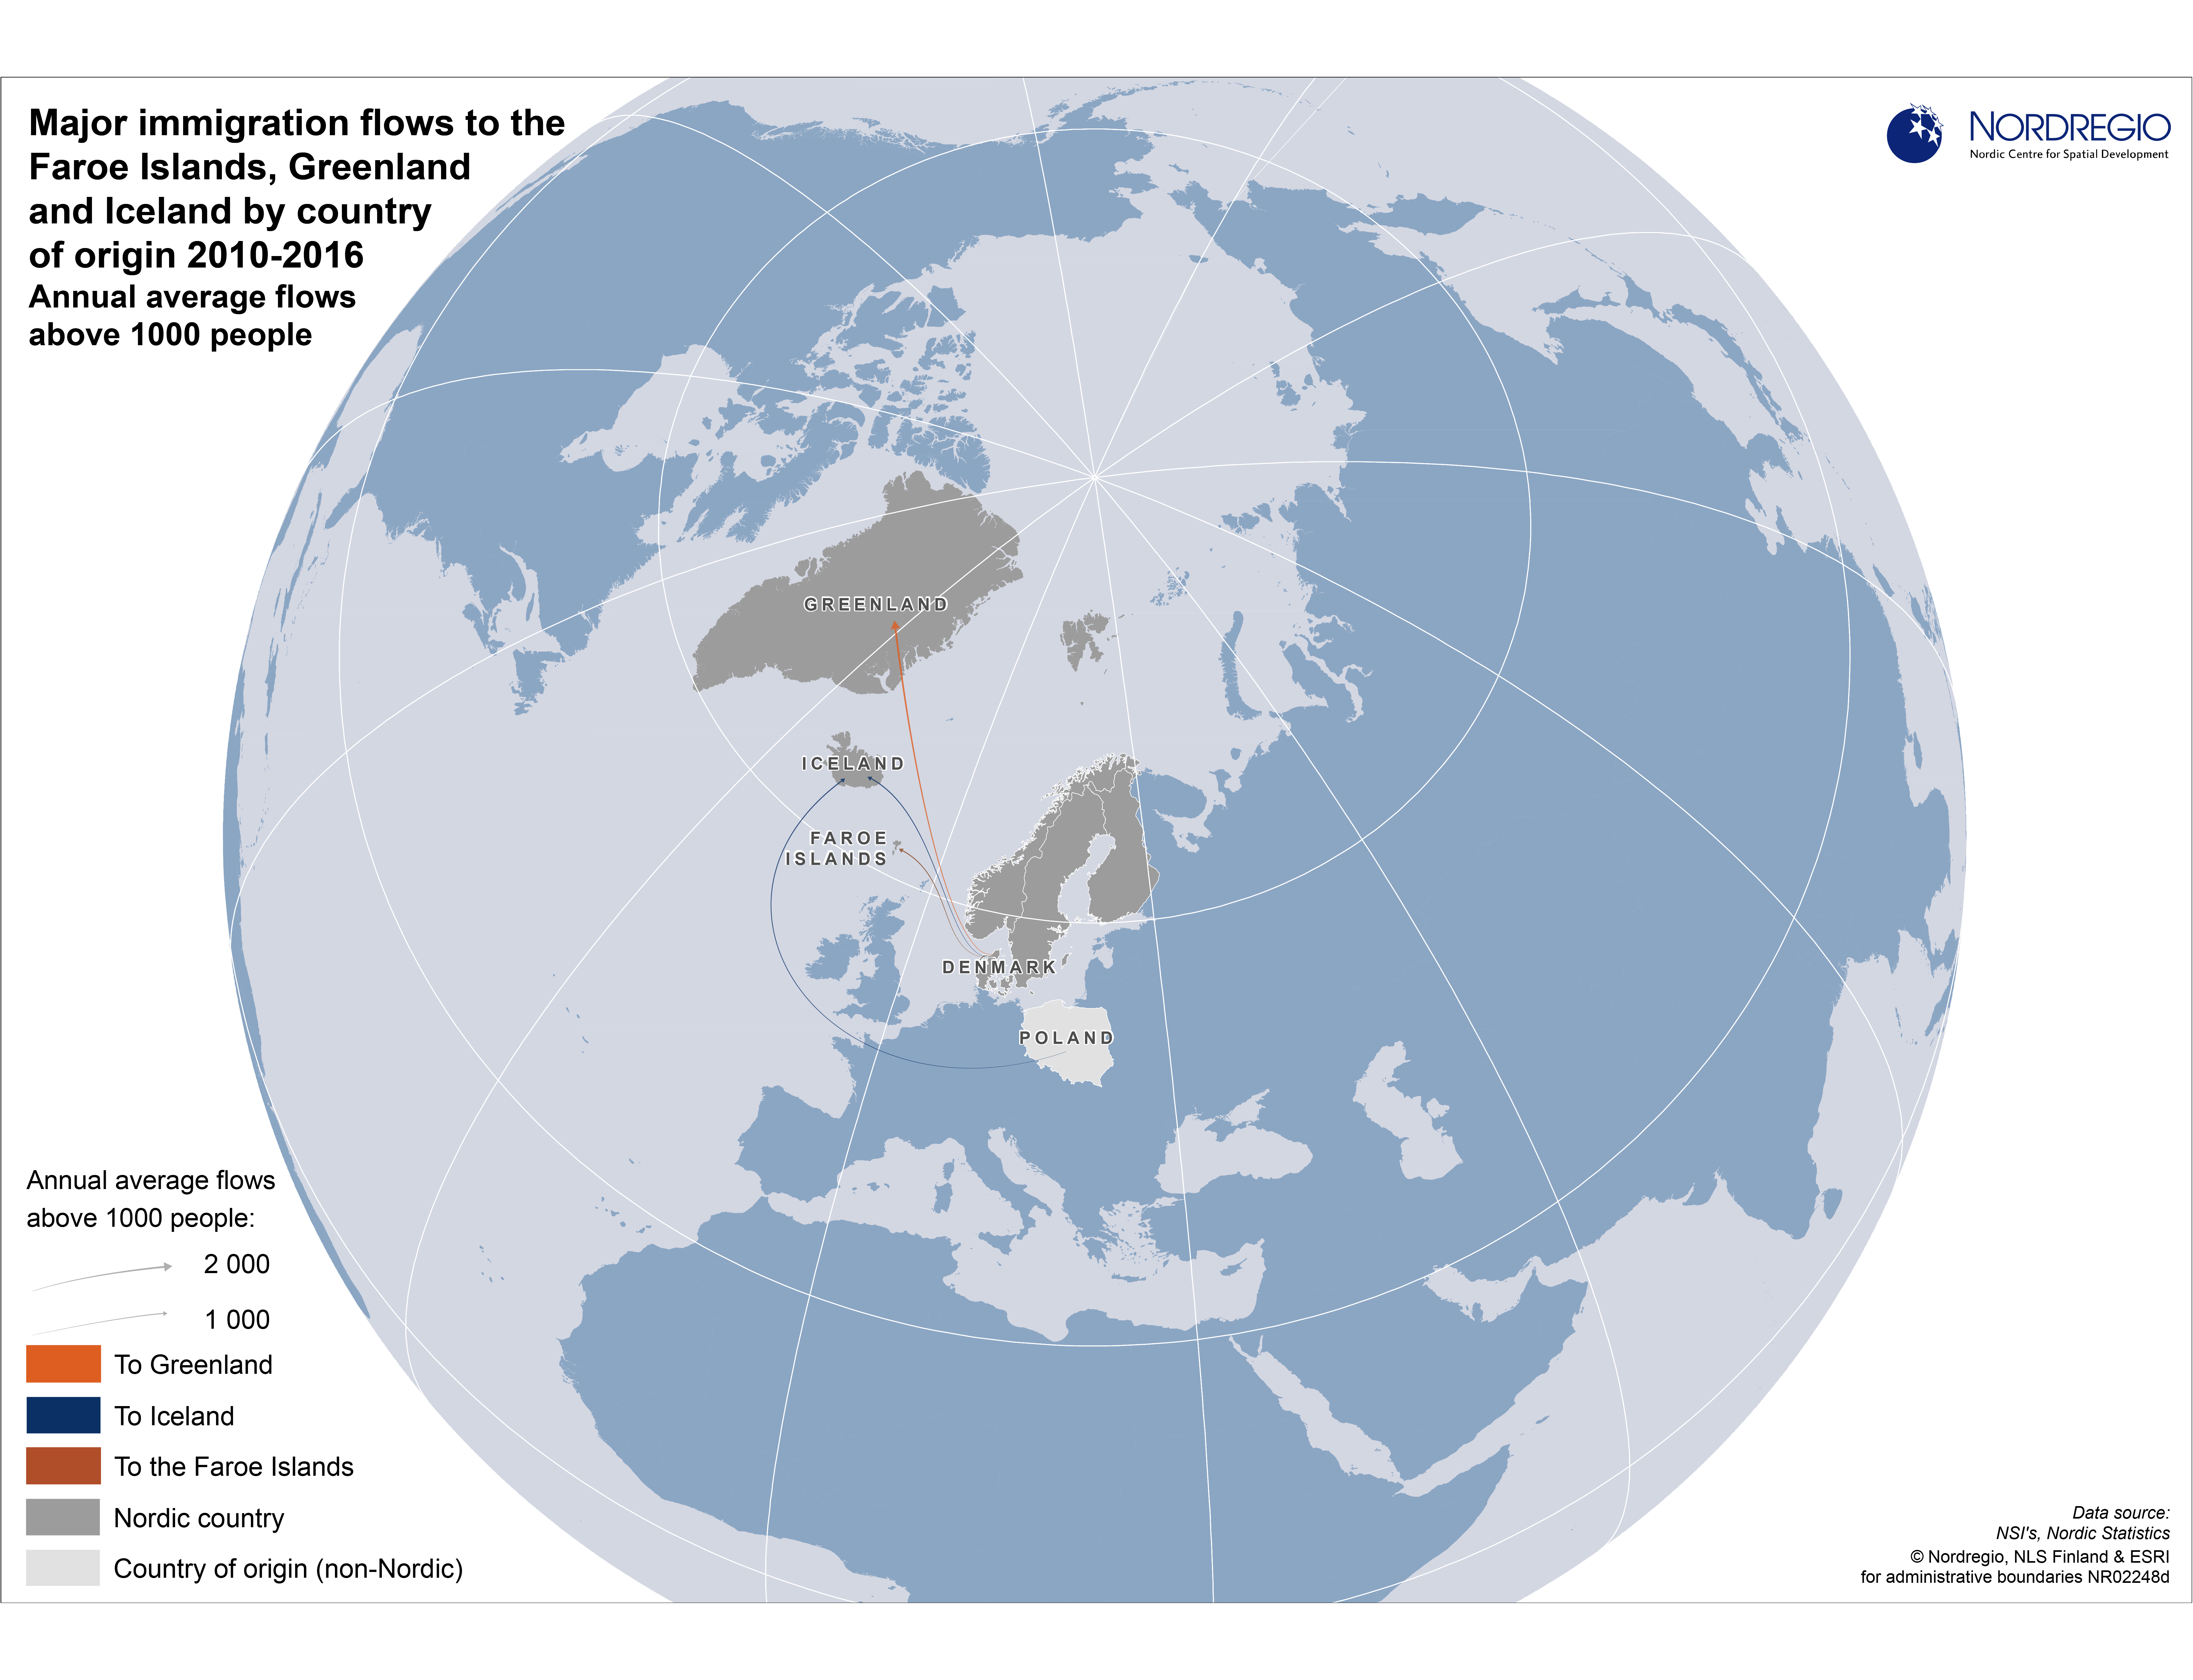
Major immigration flows to the Faroe Islands, Greenland and Iceland 2010-2016
Average annual flows above 1000 people by country of origin Migration flows by country of origin are of growing interest in the Nordic Region due to the recent unprecedented inflows of migrants. There are also interesting differences between the Nordic countries with respect to the dominant countries of origin of migrants and the size of inflows. The Faroe Islands and Greenland each had one average annual inflow greater than 1000 people during the measured period, in both cases from Denmark (around 2000 to Greenland and around 1000 to the Faroe Islands). Iceland had average annual inflows just above 1000 people from two countries, Denmark and Poland.
- 2017 June
- Demography
- Iceland
- Migration
- Nordic Region
- Other
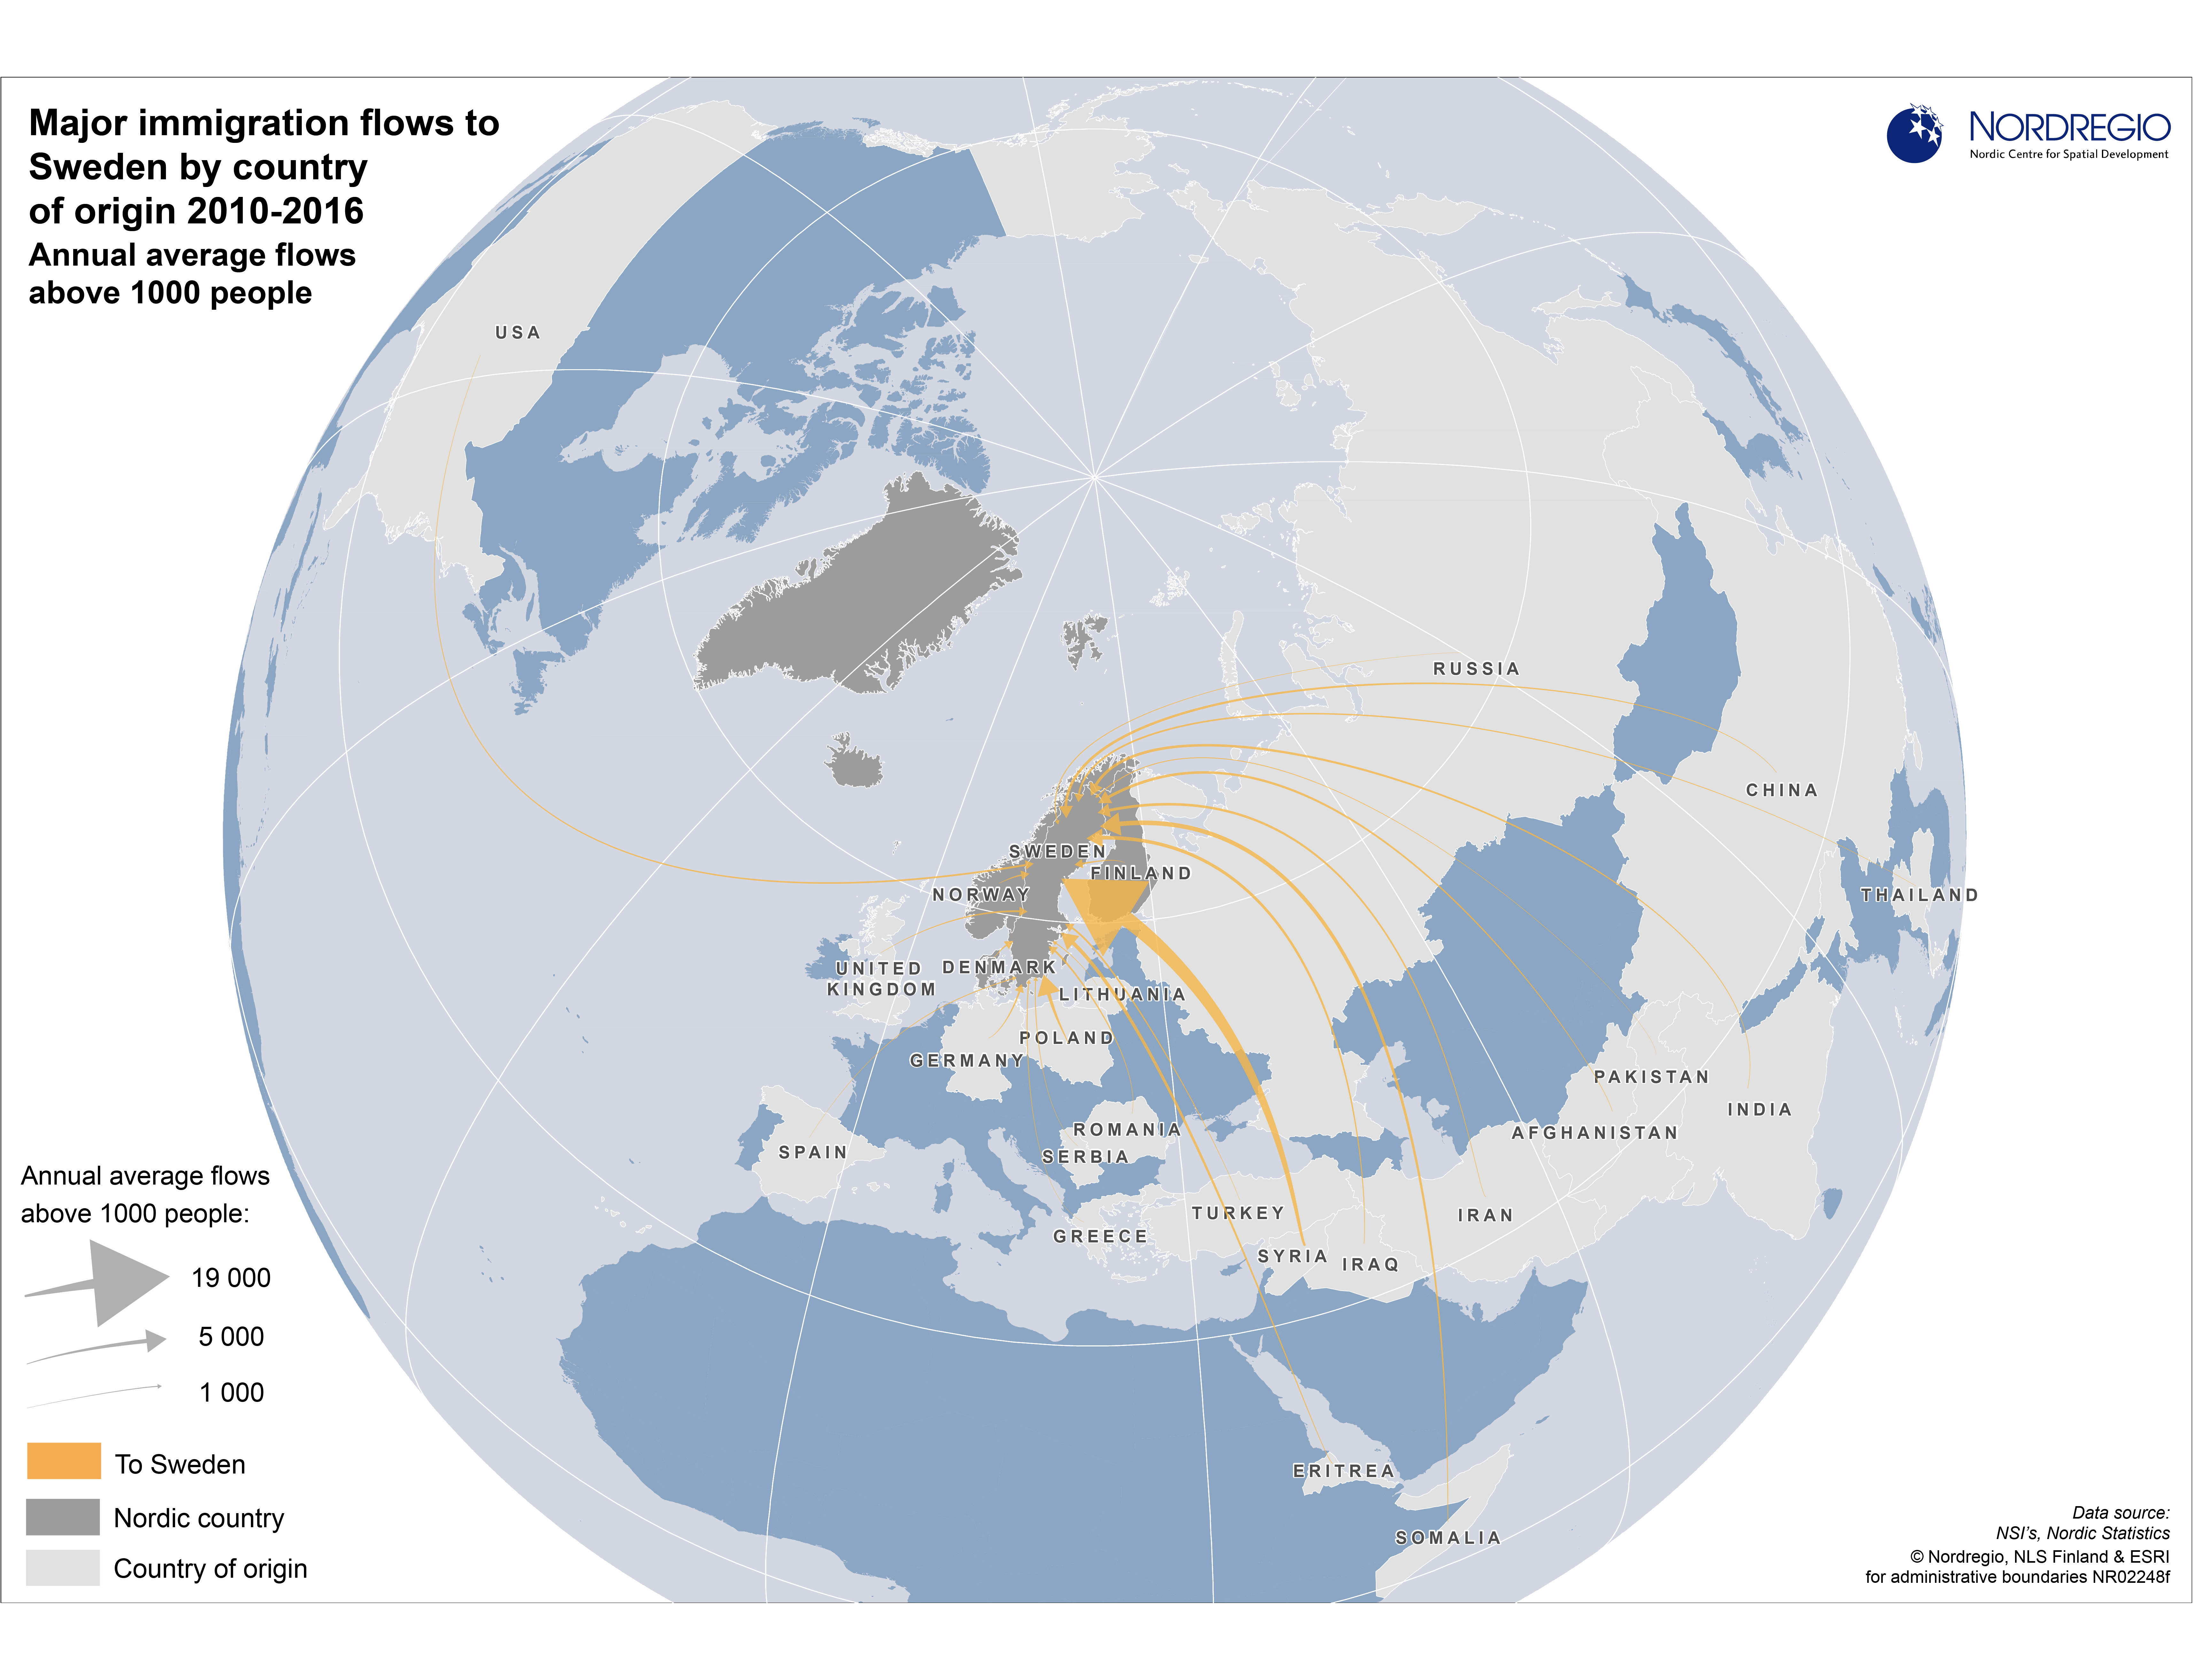
Major immigration flows to Sweden 2010-2016
Average annual flows above 1000 people by country of origin Migration flows by country of origin are of growing interest in the Nordic Region due to the recent unprecedented inflows of migrants. There are also interesting differences between the Nordic countries with respect to the dominant countries of origin of migrants and the size of inflows. During the measured period, Sweden had by far had the largest immigrant flows compared to of all the other Nordic countries – Denmark, Finland, Iceland and Norway. An annual average of nearly 19 000 immigrants came from Syria, around 5000 from both Somalia and Poland, about 4000 from Iraq and Eritrea, and circa 3000 each from Afghanistan, India, China and Iran. Many of the largest immigration flows to Sweden originated from countries in East Africa, the Middle-East, and mainland Asia. Alongside the large inflows from Poland, Sweden also experienced large inflows from its other European neighbours: Finland, Germany, Denmark and Norway (over 2000 people at the annual average).
- 2017 June
- Demography
- Migration
- Nordic Region
- Other

Major immigration flows to Norway 2010-2016
Average annual flows above 1000 people by country of origin Migration flows by country of origin are of growing interest in the Nordic Region due to the recent unprecedented inflows of migrants. There are also interesting differences between the Nordic countries with respect to the dominant countries of origin of migrants and the size of inflows. During the measured period, the largest average annual inflows to Norway were from nearby countries: Sweden, Lithuania, Denmark, and, most notably, Poland (annual average of almost 11 000 people). This specific pattern for Norway can largely be explained by the rich job opportunities that have existed in in the country over the past decade.
- 2017 June
- Demography
- Migration
- Nordic Region
- Other