Every other year, Nordregio produces a comprehensive report: State of the Nordic Region, to draw on the latest development trends at the national, regional and municipal level. It presents an analysis of demographic changes, labour market trends, education, economic performance, and developments in themes such as digitalisation and the bioeconomy based on the latest available statistics.
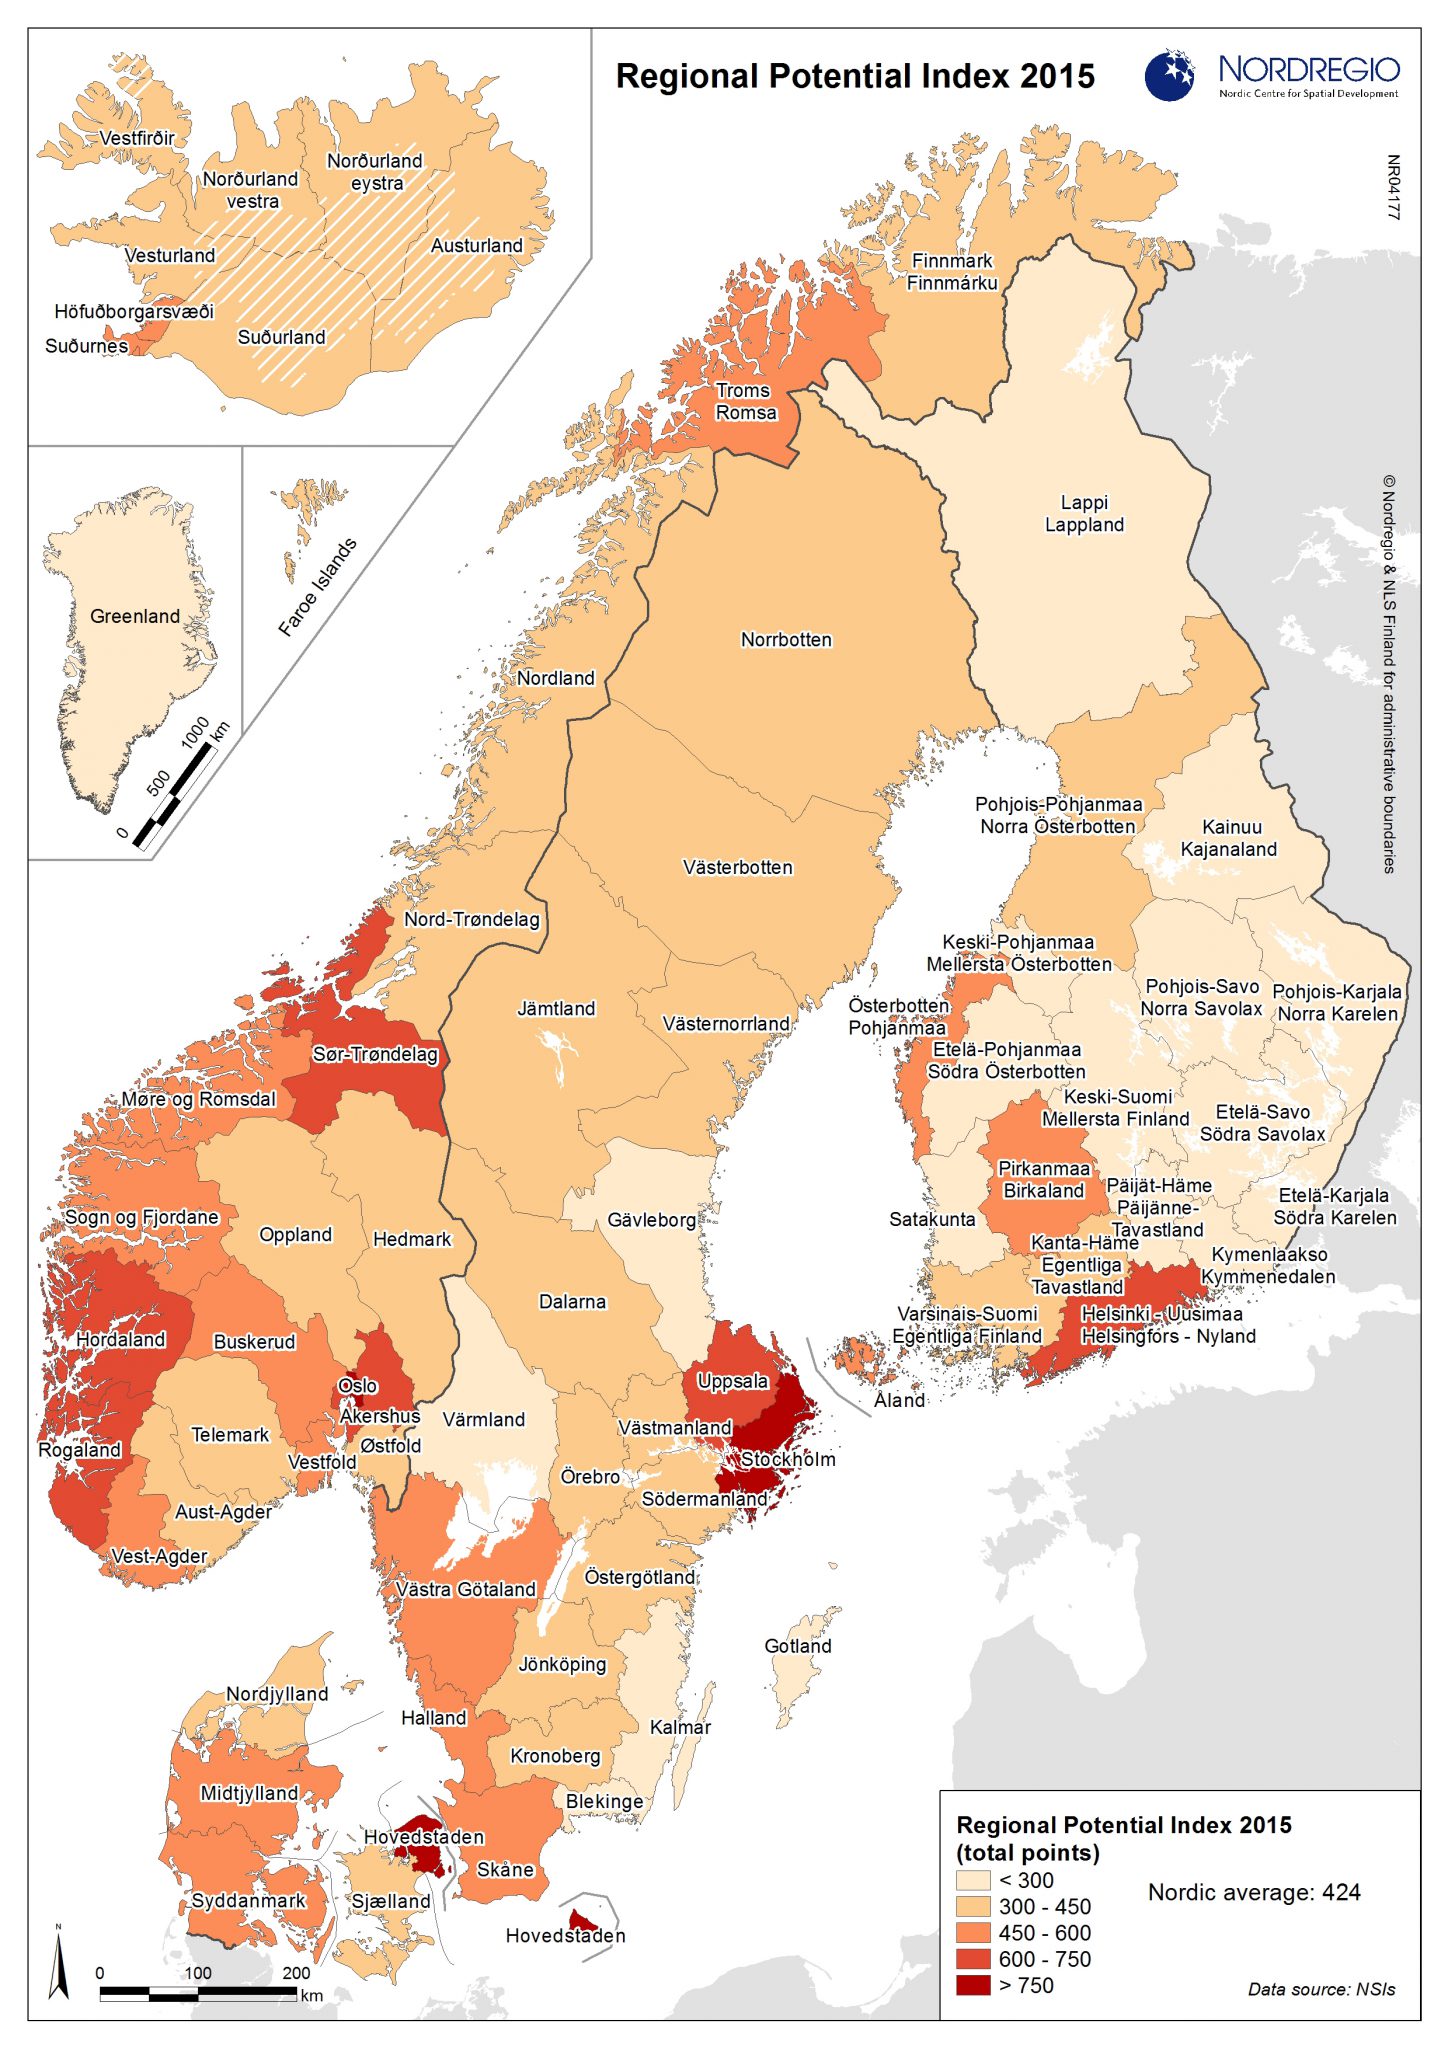
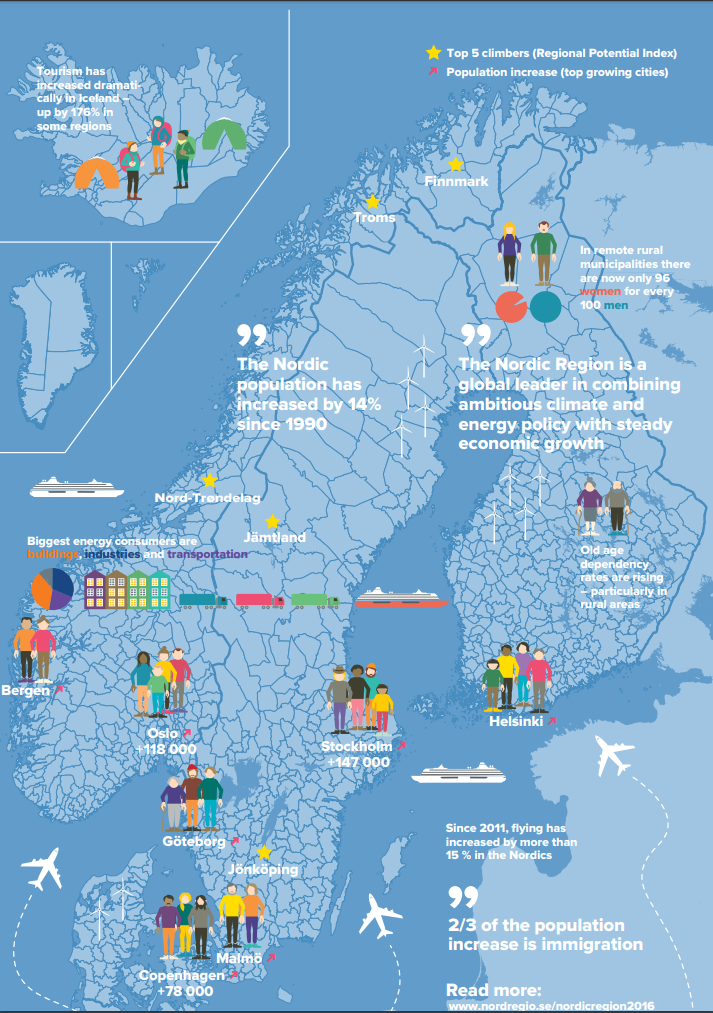
For the first time in 2016, State of the Nordic Region included a Regional Potential Index, highlighting the strengths and weaknesses of the 74 Nordic Regions in relation to one another, and identifying the regions with the strongest growth potential. The Regional Potential Index spread widely in the media, sparking interest in the analysis behind the data: Why is a certain region performing so well when a neighbouring region might be sinking in the ranking? Oslo emerged as the winner of the ranking, followed by the other capital regions. We also witnessed some promising development outside the obvious urban areas, for example, the thriving city of Tromsø in Northern Norway. The aim of Nordregio’s Regional Potential Index is to show the current performance of Nordic regions, to highlight regions with high potential for future development and to identify regions in need of further support. The index is also helpful in pinpointing common denominators of regions that are doing well and determining the focus of policy measures to strengthen the potential of regions facing challenges. So, what makes a region successful? Some of the regions succeeded in the index due to their adaptiveness to new labour markets, by staying appealing to young people and offering jobs and education. Others have seen declines in their gross regional product and working age population due, at least in part, to structural changes in the industry. Some particularly strong results can be seen from regions with industries, businesses and services related to oil and gas extraction. Denmark and Iceland have a large proportion of regions with high regional growth potential. In Sweden and Finland the domestic variation between the strongest and weakest regions is greater. In the south-east of Sweden, most regions scored relatively poorly. In Finland, the eastern and northern regions received the lowest rankings. All the maps showing the regional changes by themes are available at NordMap, which also displays the change over time when using time play feature (www. nordmap.se).
REGIONAL POTENTIAL INDEX 2015 – WINNERS AND LOSERS
The Regional Potential Index is made of 9 indicators covering demographic potential (population density, net migration rate, demography dependency rate and female ratio), labour market potential (employment rate, share of the age group 25-64 with high education degree, youth unemployment rate) and economic potential (GRP/ capita and total R&D investments).

This article is part of Nordregio News #2. 2017, read the entire issue here.


