


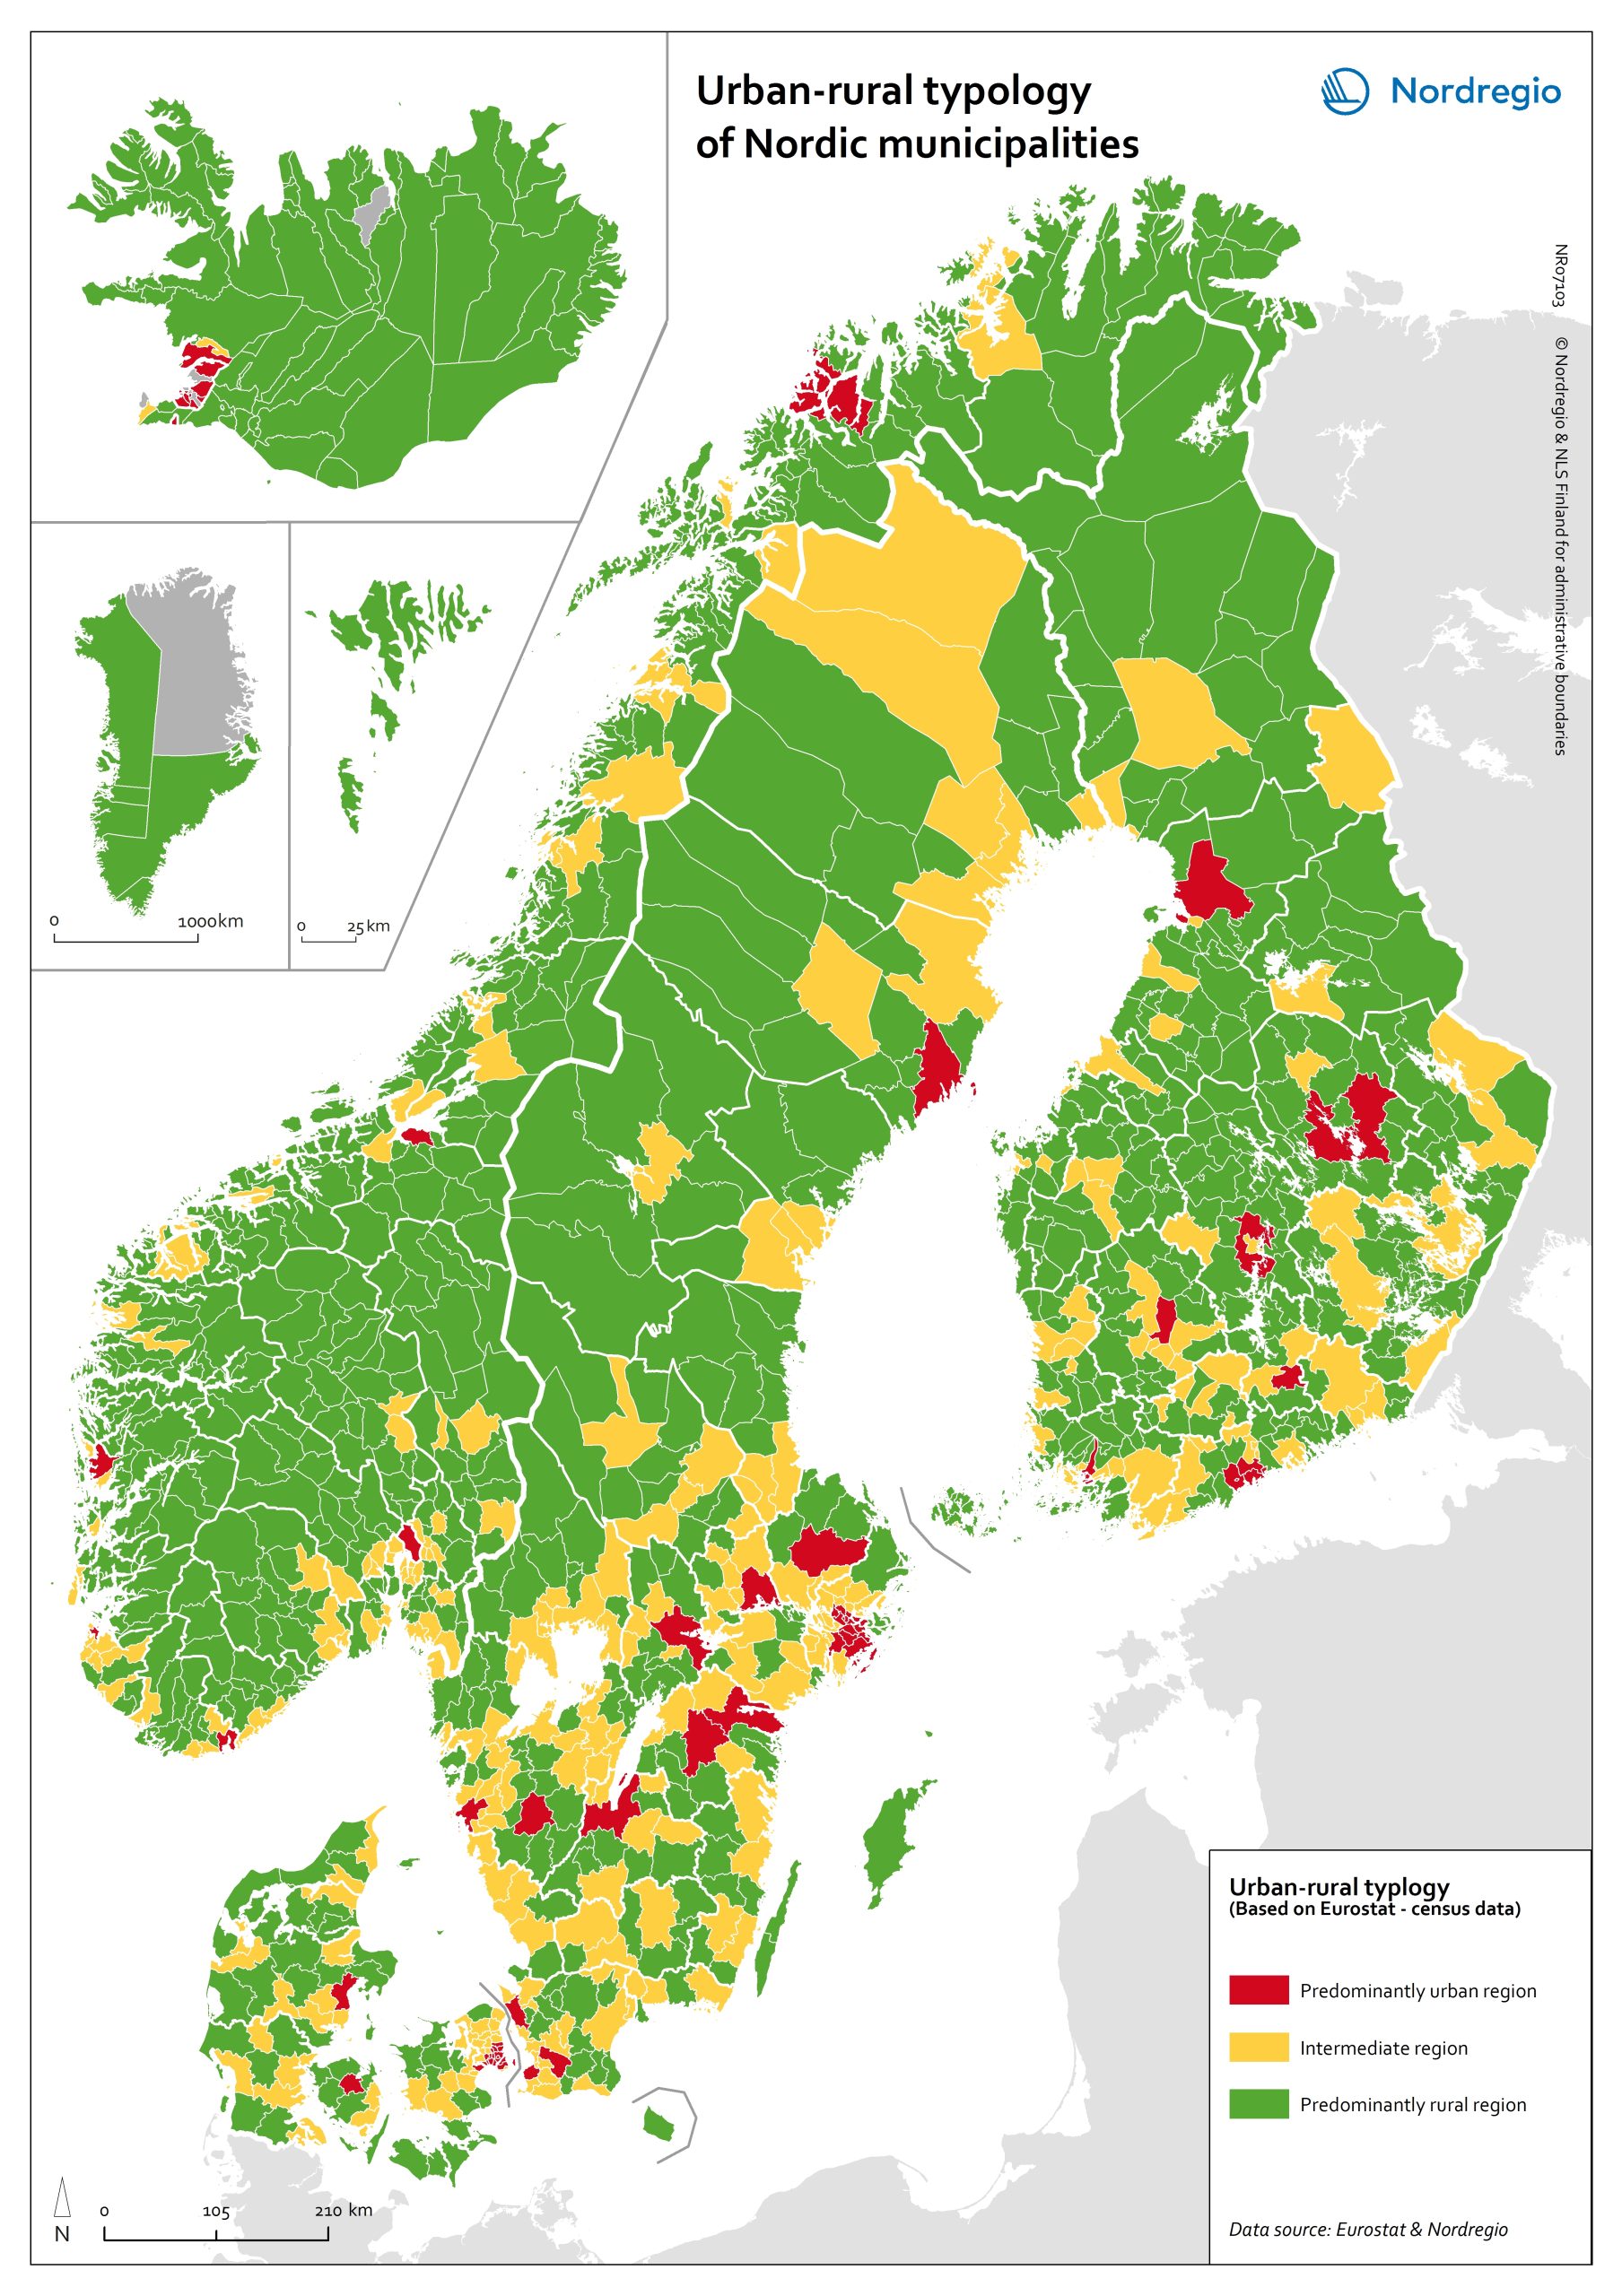
From bustling cities to vast wilderness, many Nordic municipalities cover large areas of land with very different characteristics. Take Kiruna municipality in Sweden which has an urban centre but where the rest of the municipality is quite rural. A traditional urban-rural typology would classify Kiruna as urban, but how accurate is that?
What if we could look at this municipality at the grid-level? What trends and patterns could we identify then? Follow along as we explain the new and innovative Nordic urban-rural typology and show how it can be applied to explore trends in the education level of the Nordic Region’s populations.
What is the Nordic urban-rural typology?
Think of two places anywhere in the world. Are they cities, rural areas, or something in between? Is it easy to compare them by size or number of inhabitants? The urban-rural typology is a method that categorises any area according to its urban or rural characteristics. It helps us to better understand the demographic trends in the urban-rural continuum.
An early attempt to systematically classify various urban and rural areas using detailed grid-level data occurred almost ten years ago. In 2013, the Finnish Environment Institute (SYKE) published an urban-rural typology of Finland. Inspired by this work, Nordregio, together with the company Ubigu has developed a typology for the Nordic region, using only open, free-of-charge statistical data. We developed an open-source code so that anyone could update the typology with the latest available data and use it in their scientific work.
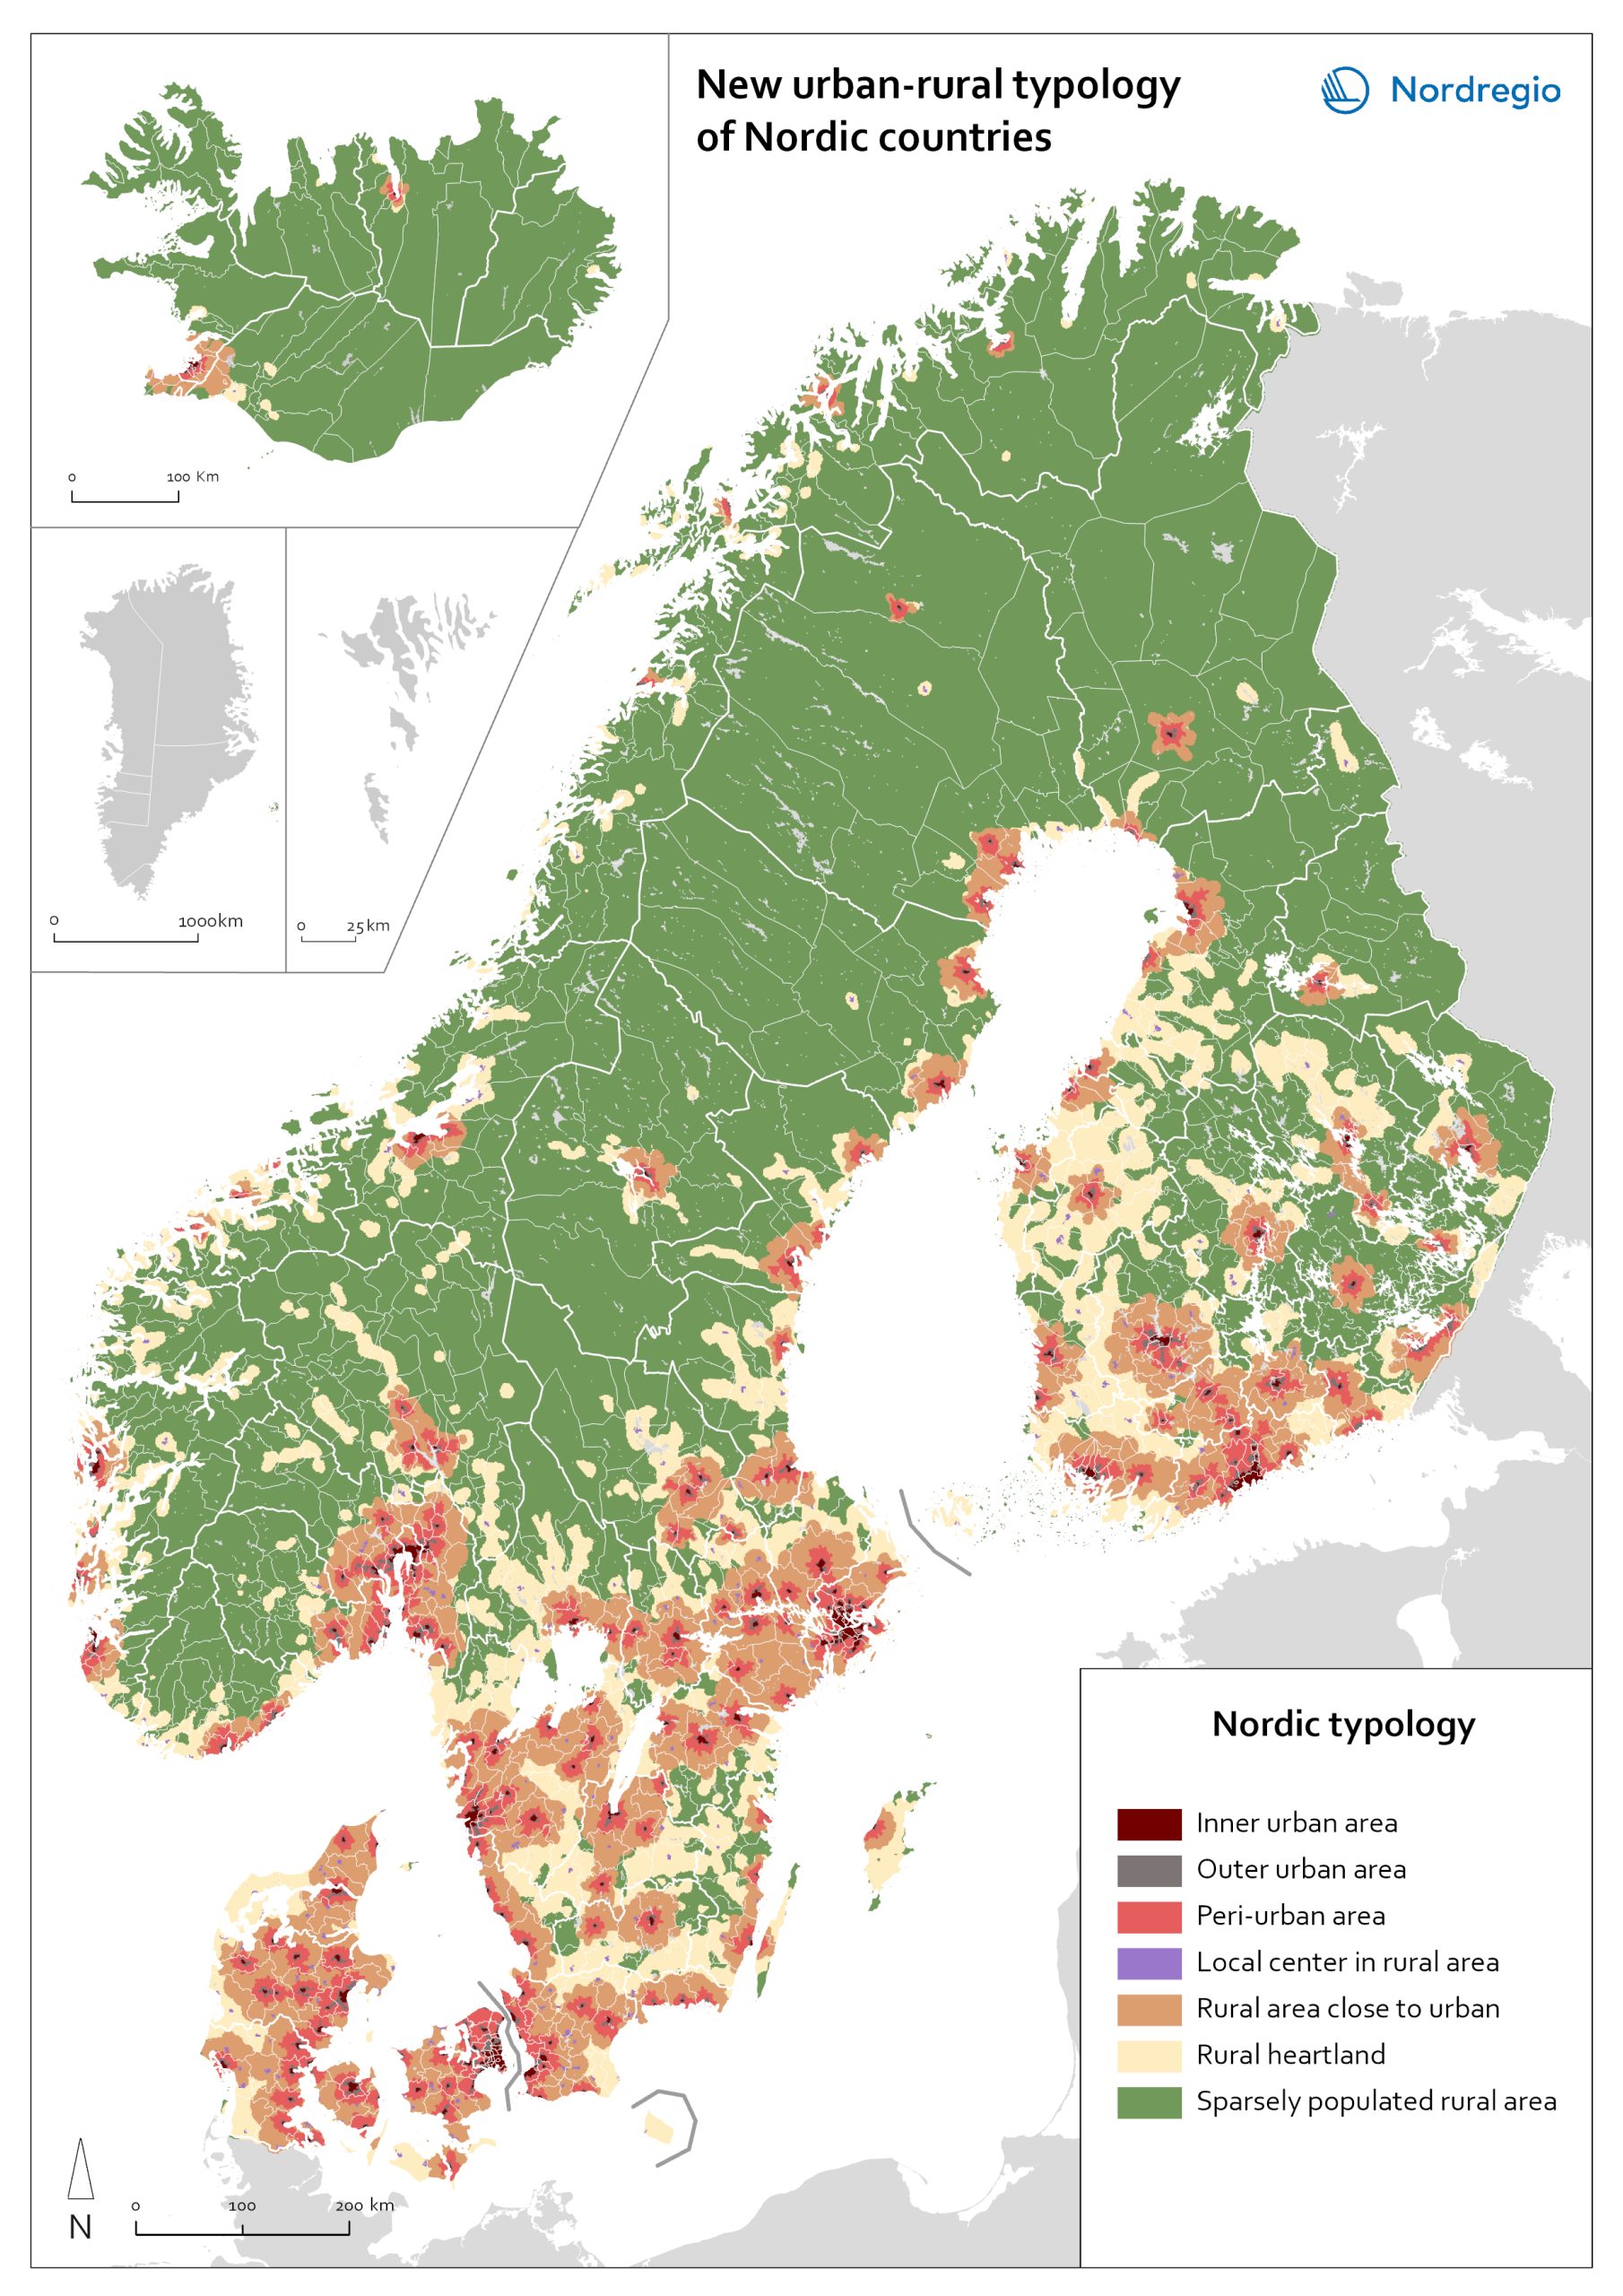
The Nordic typology categorises all urban and rural areas into seven groups – from inner urban areas to sparsely populated rural areas. The typology itself does not communicate any trends, but when we combine it with some statistical data, it reveals a lot of interesting information. Thanks to the statistical data available on a very detailed level and our typology, we can now compare population trends and settlement patterns between different types of areas among countries in a more accurate way. This improves the results and analysis on the Nordic level.
How accurate are the maps?
Historically, Nordregio has been analysing the statistics and producing maps on national, regional and municipal levels. To allow for a more nuanced and fine-grained understanding of spatial differences within regions and municipalities, researchers decided to explore how grid-level statistics could be analysed and illustrated on the map.
A couple of years ago, we carried out the first comparative Nordic study, using grid-level statistics to examine the population change and noticed some trends that are difficult to see, or even entirely invisible, at more general levels of data. The study showed that the Nordic Region is undergoing highly unbalanced population development, and there are notable differences in demographic trends between and within countries. For example, some municipalities might be undergoing rapid population growth. However, the grid-level analysis could show that population growth is rapid only in urban areas. At the same time, the peripheries might develop at a much slower pace or even undergo population shrinkage. The study demonstrated that population data at the grid level are well- suited for identifying demographic change processes and trends occurring within regions and municipalities and can thus provide more accurate information about the development of the Nordic region.
Mapping urban-rural typology accurately
After developing the method for mapping rural and urban areas in the Nordic region, as well as testing how the grid-level data works for examining demographic changes, the Nordregio team decided to take a few steps forward and combine the findings.
This resulted in a very detailed Nordic classification showing a varying degree of urban and rural characteristics. The statistics from Greenland and the Faroe Islands are not included due to a lack of available grid-level data.
Nordic contributions to the European typology
In Europe, the interest in classifying rural and urban areas in a more harmonised and accurate way has been growing in the past few years. The European typology, however, is more simplified. Also, it focuses mainly on the degree of urbanisation.
So, the rural areas at a European level have yet not been consistently identified in the typology. In the upcoming four years, Nordregio will contribute to the further development of the urban-rural typology in the GRANULAR project based on the experience gathered in the previous Nordic assignments. In this project, Nordregio and project partners are set to develop an urban-rural typology with high geographical granularity for entire Europe, and the new Nordic typology is an important methodological contribution to that process.
What’s next? Let’s test it with the education data!
During 2022, Nordregio has worked on several assignments that require an understanding of the educational composition of the population. The statistics have been gathered both on the municipal and grid level, which has made it possible to learn both about the Nordic population and the degree of their education and to test if the statistics on municipal and grid levels provide the same results.
The map on the left illustrates the tertiary education attainment level based on the municipal data. The map on the right represents the information on a very fine grid level. What a difference!
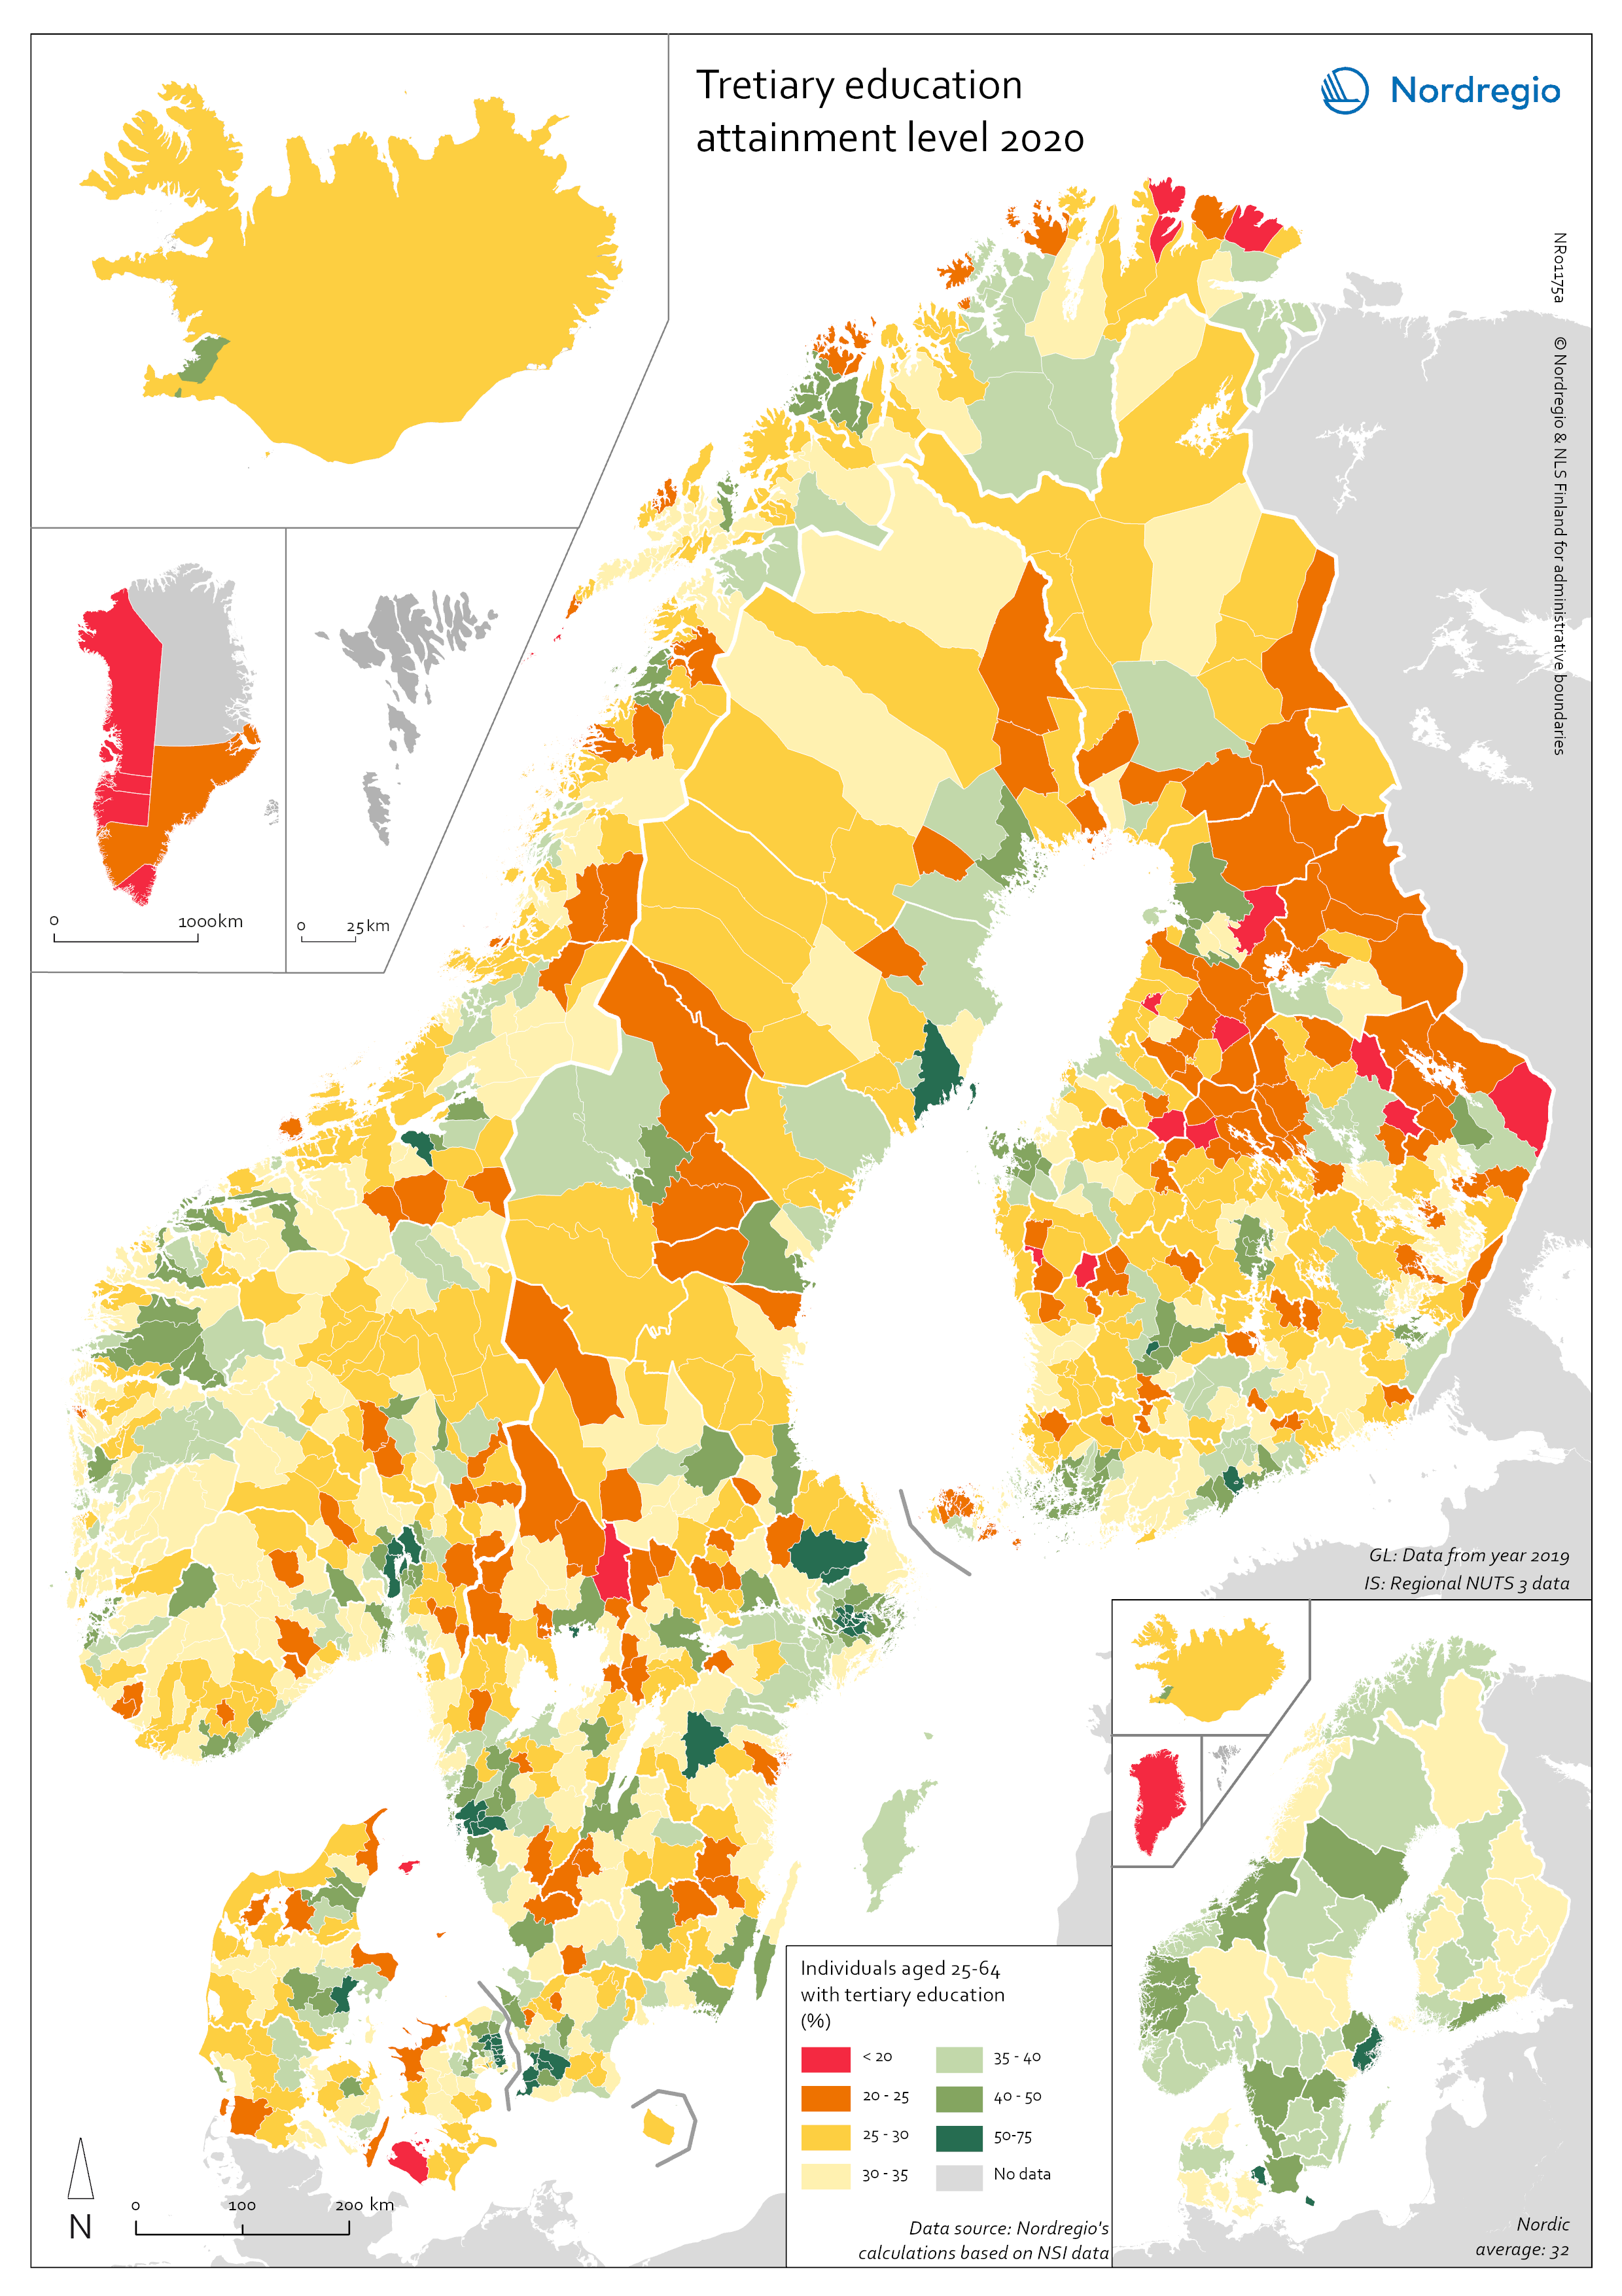
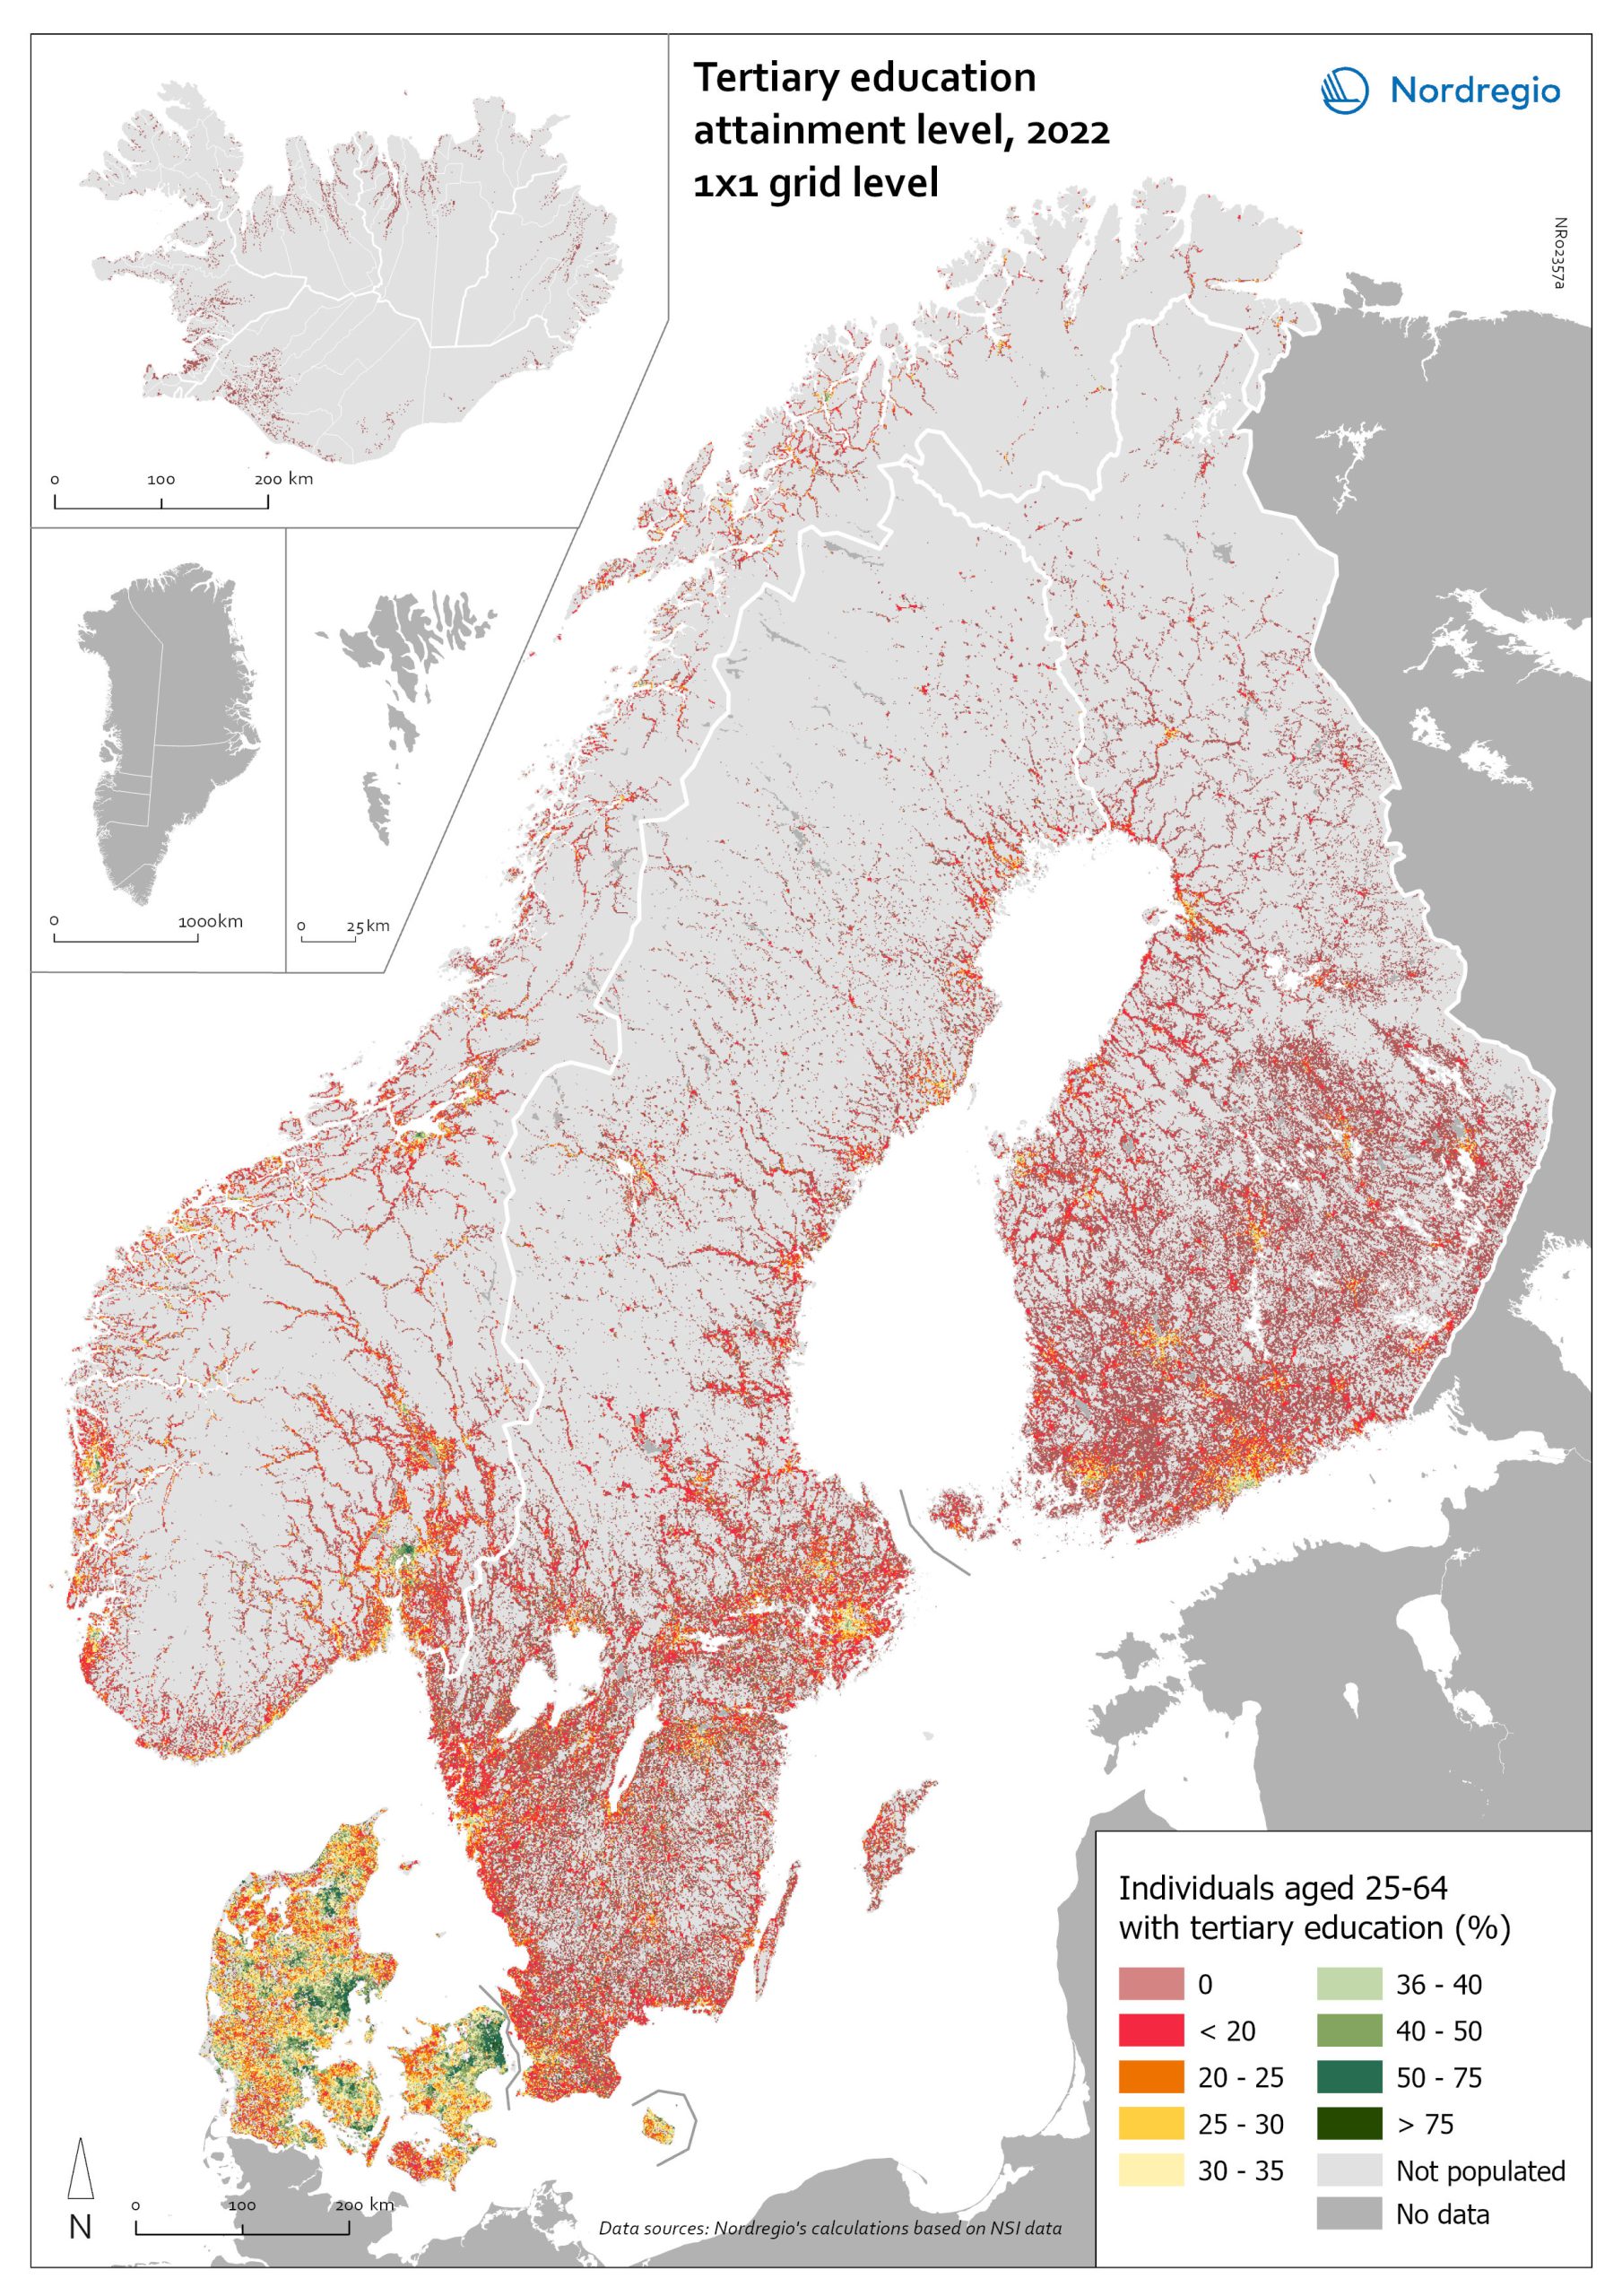
While we won’t go into all the findings here, you will note that there is a strong discrepancy between cities and peripheries – the more urbanised areas are where the higher tertiary education rates are found. The average rate for urban areas in Denmark, Sweden and Norway are 53%; the corresponding rate for Finland is 43%, while the rural areas in all four countries have an average of approximately 30%.
This gives you a hint of the possibilities with this new Nordic typology and we hope you will explore it further with us. A start might be this interactive chart below…
This interactive chart was created by Nordregio intern Tove Lundberg
The new typology has been developed by Nordregio and Ubigu with funding from all three Nordic Thematic Groups 2021-2024 as part of the Remote work and multi- locality post-pandemic project. The Nordic typology platform can be accessed via: https://nordictypology.ubihub.io/
