The map shows the voting turnout of Nordic municipalities and regions at the latest held parliamentary elections. Blue municipalities and regions are where the turnout was higher than the national average.
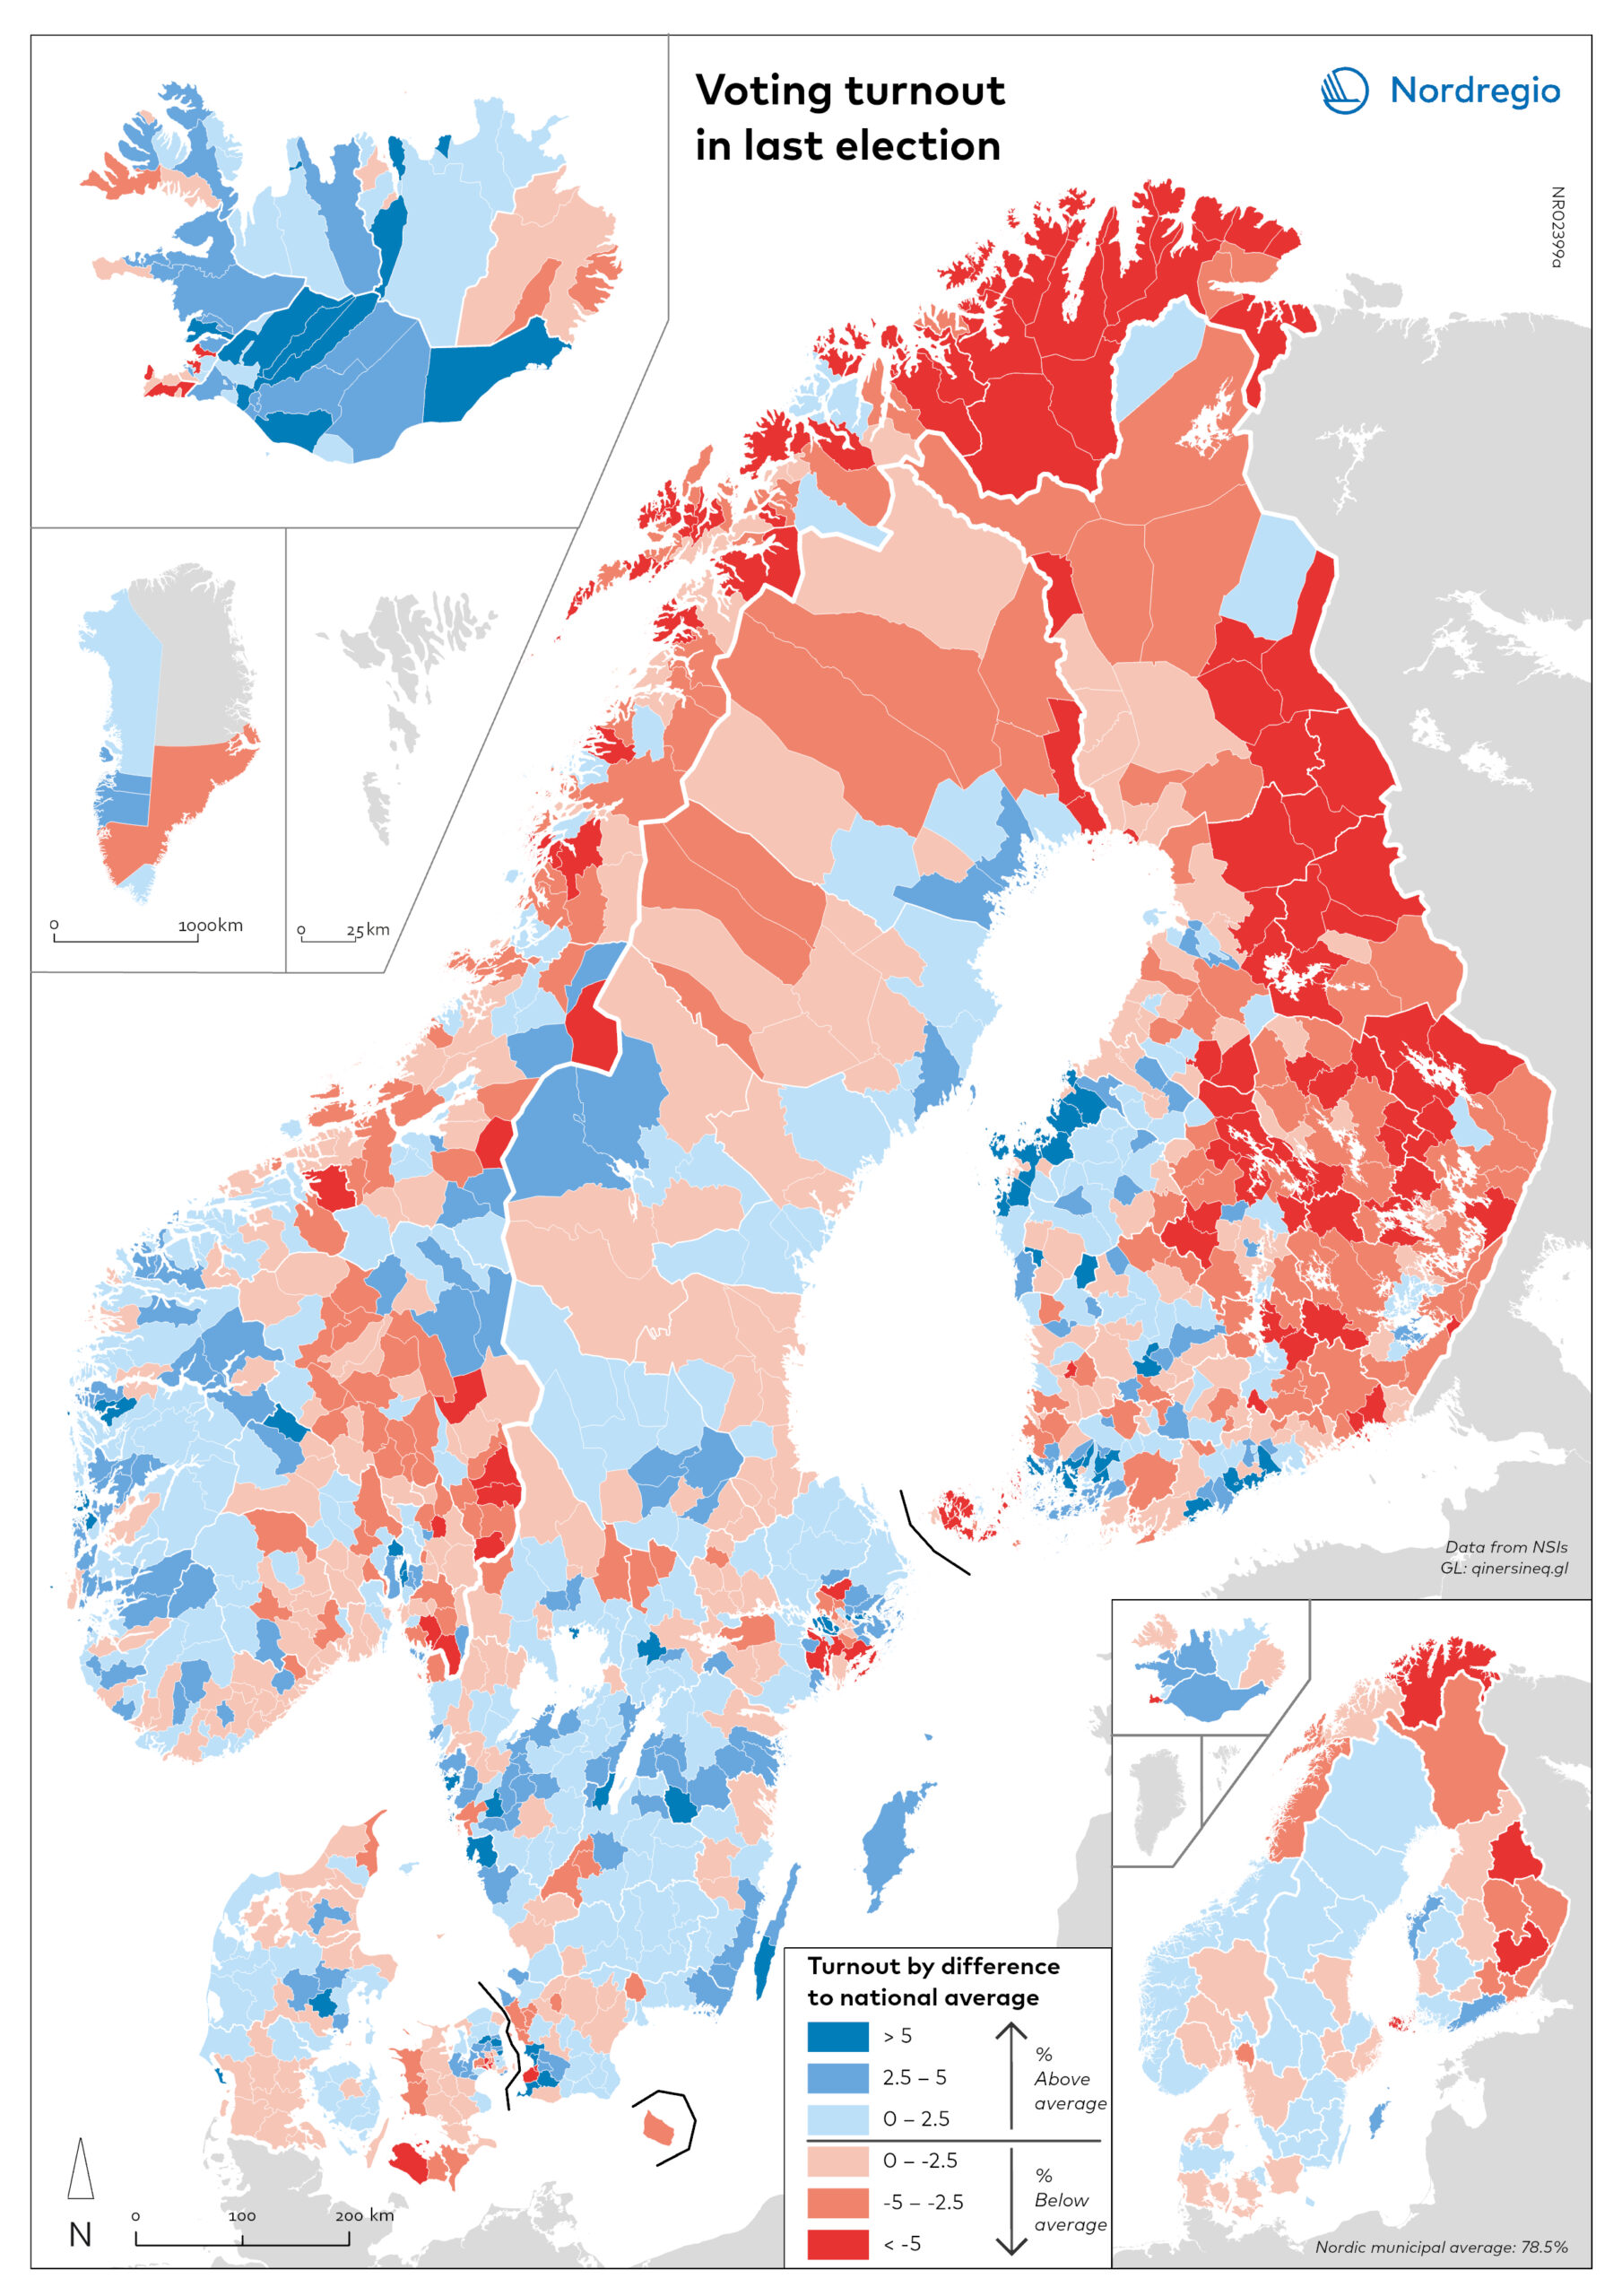
Municipalities are compared to other municipalities within the same country. This entails that a blue Finnish municipality could have a lower election turnout than a Swedish one.
National averages for each country are presented in the table below.
| Country | National average |
| Denmark | 83.9 % |
| Finland | 71.9 % |
| Greenland | 70.2 % |
| Iceland | 80.2 % |
| Norway | 79.3 % |
| Sweden | 84.2 % |

