Over the past three decades, there has been considerable diversity in population growth rates among Arctic regions. These range from a near doubling of the population of the territory of Nunavut in Canada to a 70 percent decline in the population in the Chukotka okrug in the Russian Far East. At lower geographic levels, there has been a trend towards the concentration of populations into larger urban centers and sizable shrinkage or closure of many smaller settlements.
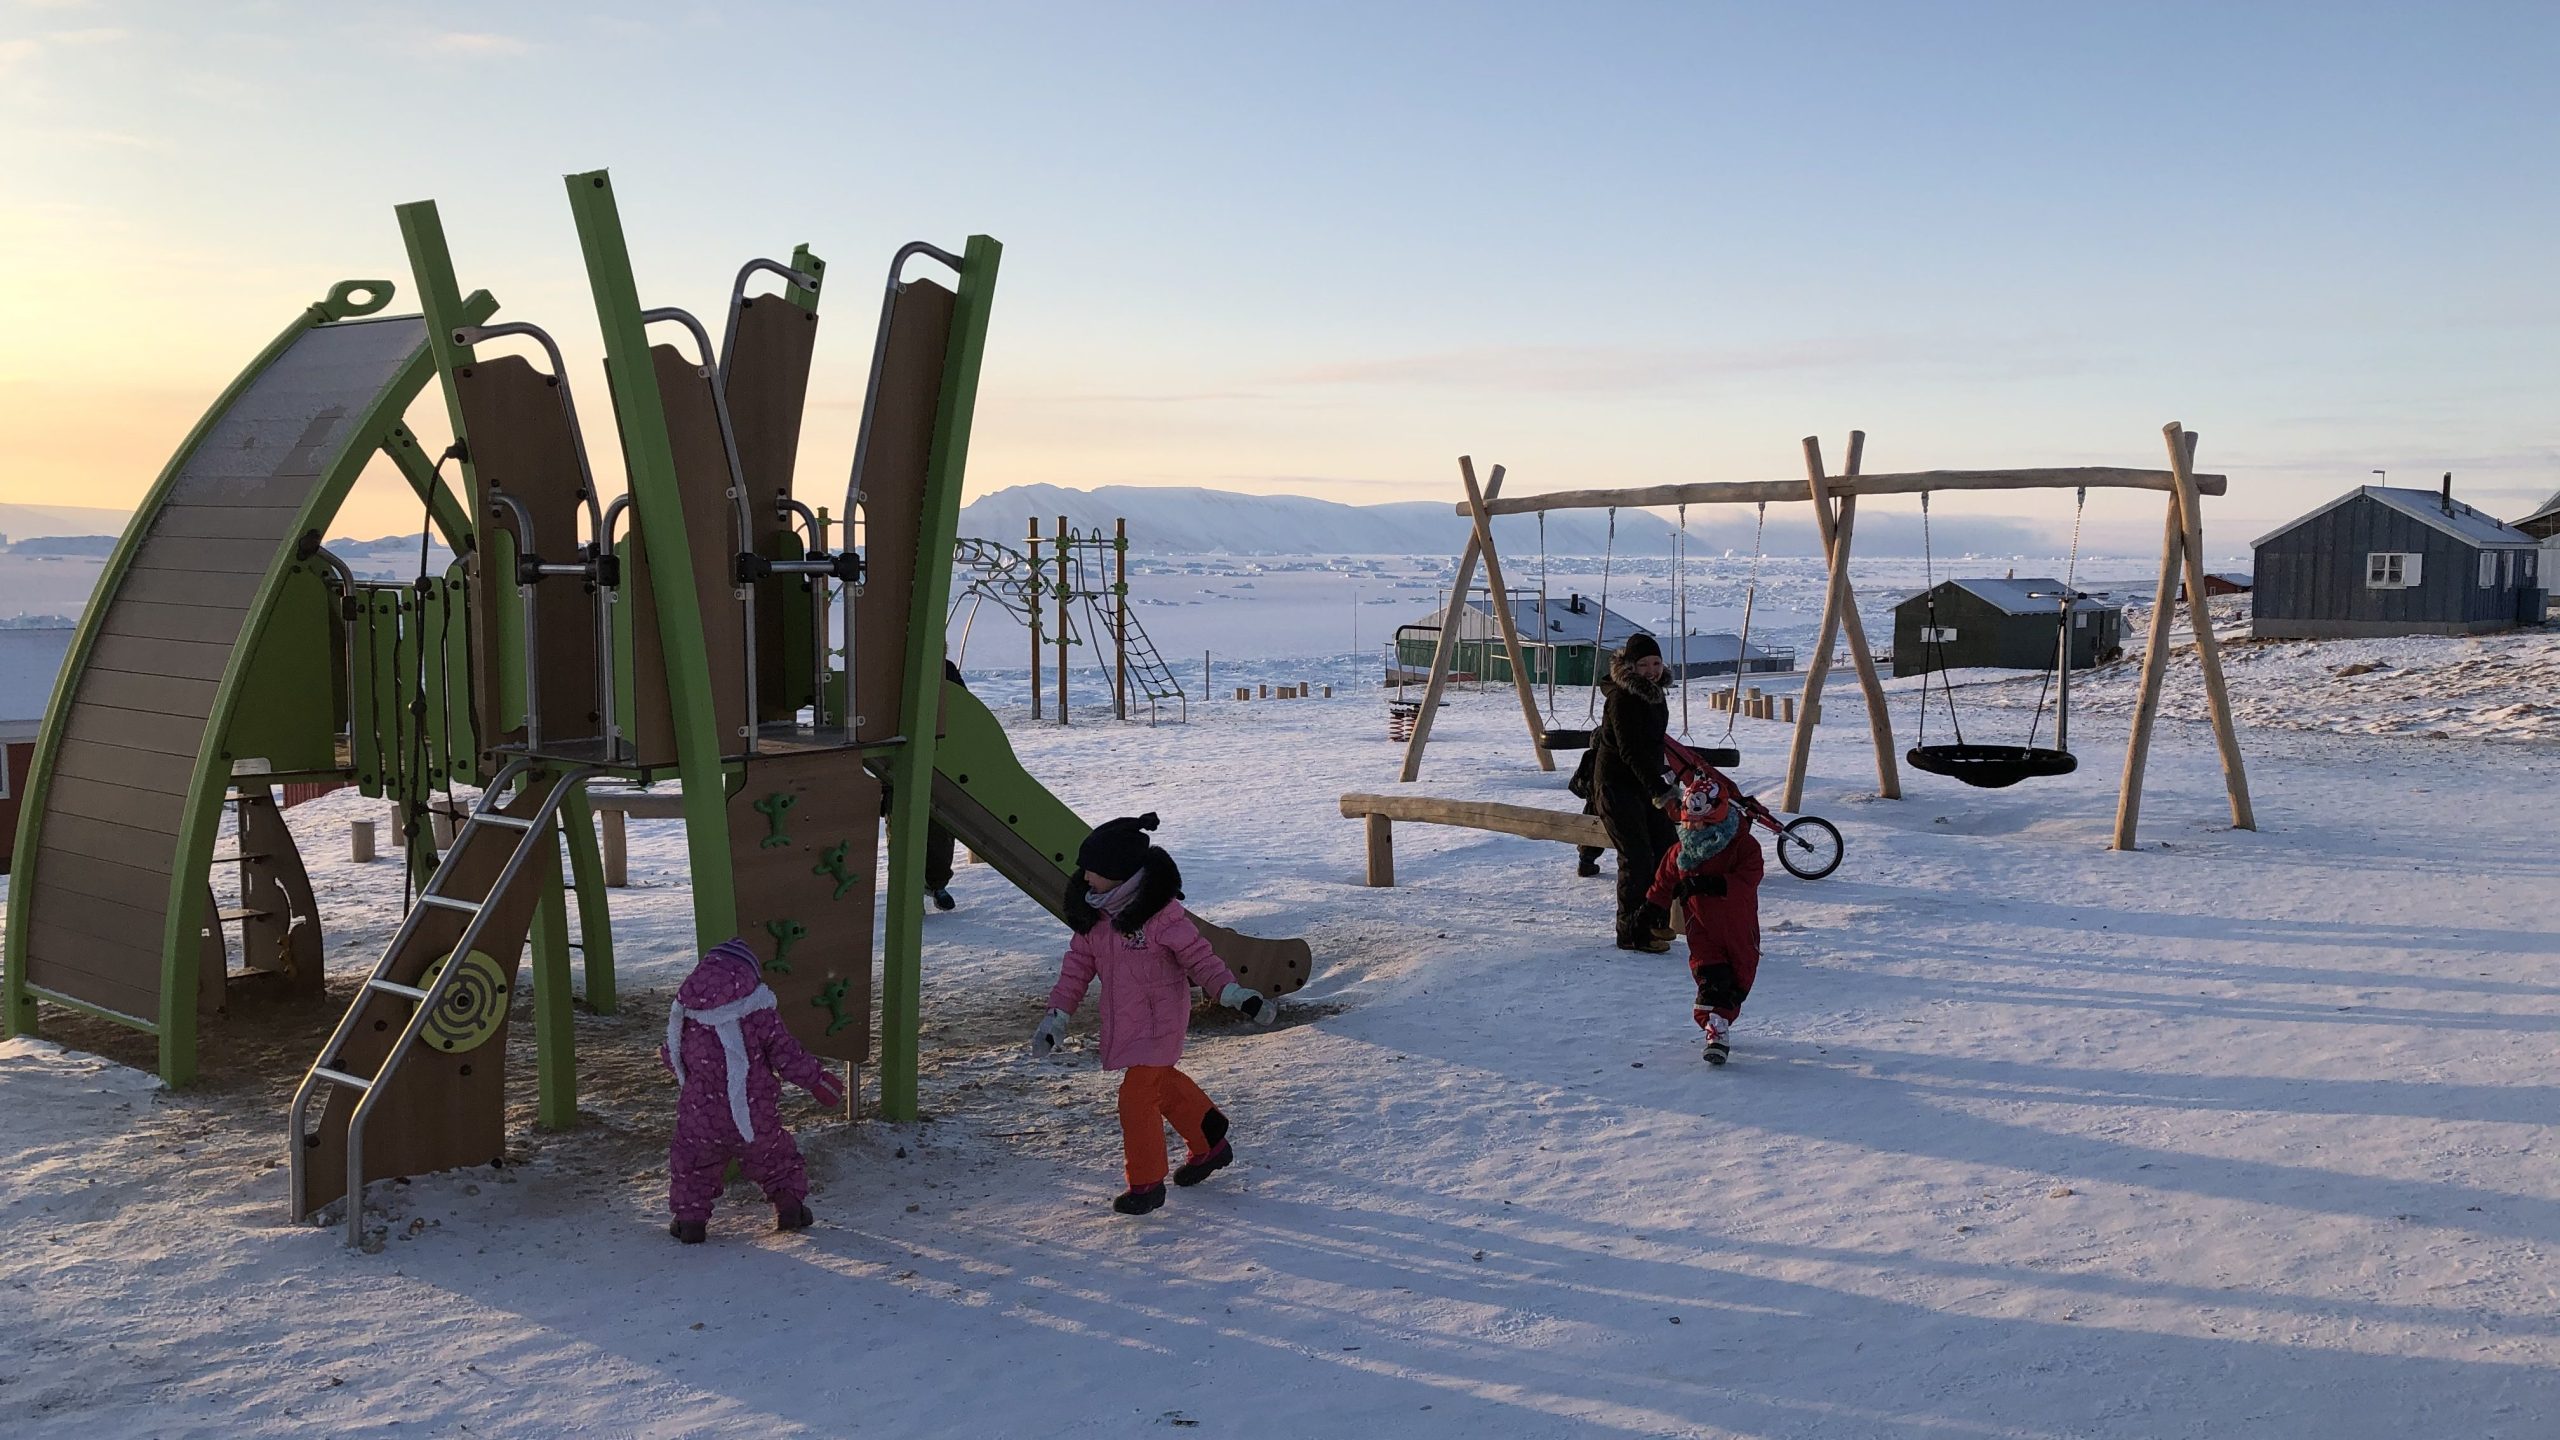
A playground in Qaanaaq, Greenland. By Leneisja Jungsberg, Nordregio.
A combination of demographic and economic factors has contributed to these trends, including Russia’s transition to a market economy. There are also significant demographic differences between Arctic indigenous and non-indigenous populations. Arctic indigenous populations tend to have higher fertility, lower life expectancy, and younger age structures. Population change for any country or region consists of two components, natural increase – the difference between the number of births and deaths and net migration – the difference between people migrating to a region and those leaving. This note analyzes and maps population change in the Arctic since 1990 showing the large differences among regions and settlements in the Arctic.
Alaska
The population of the United States has grown by 37 percent since 1990, due to equal contributions of natural increase and net immigration. The population of Alaska grew slightly less than this, by one-third, because of higher natural increase and outmigration. Migration to and from Alaska is quite volatile based on relative economic conditions in Alaska and the rest of the U.S. There has been net out-migration from Alaska since 2012, which is the longest sustained exodus since 1867. Over this period, 57,000 more people left the state than arrived In 2017, the population of the state declined for the first time in three decades and is now 736,947.
Arctic Canada
The population of Canada has grown considerably since 1990, by 43 percent to nearly 40 million. The population of the Yukon increased by 50 percent since 1990 and now stands at 46,704. This increase was due to roughly equal contributions of natural increase and net migration. The population of the Northwest Territories grew by 15 percent to 44,741, all from natural increase as net migration was negative. Nunavut grew the most of the three by 85 percent 41,159, all due to natural increase as there was out-migration. The population of Nunavik grew as much as Nunavut and now stands at 14,045. Labrador’s population has been slowly declining as is now 25,390.
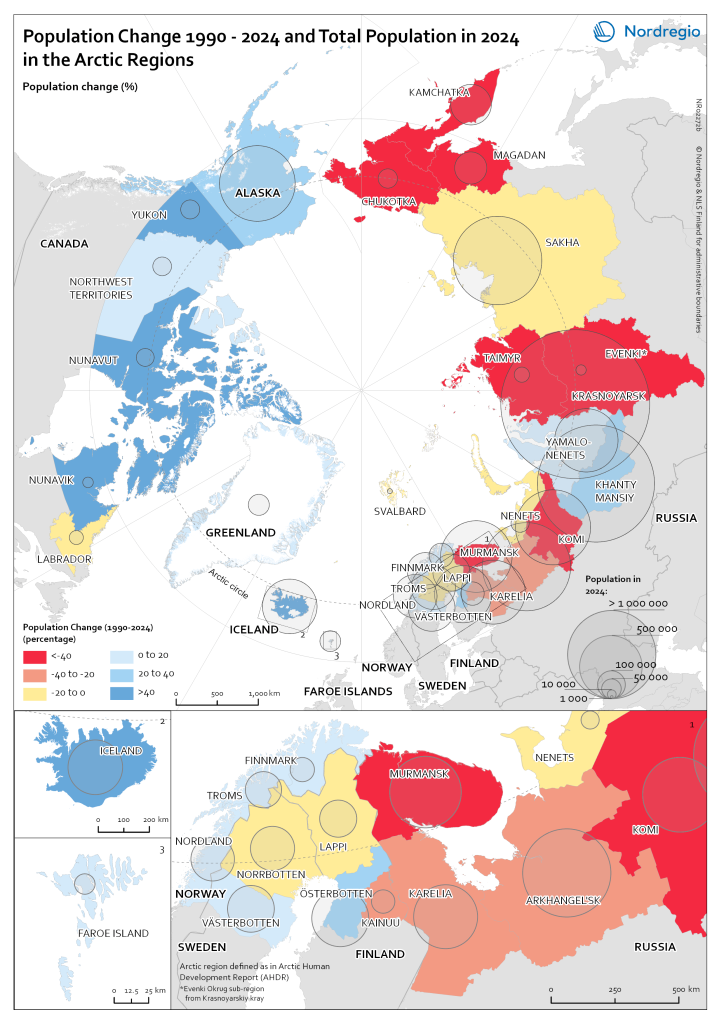
Population change in the Arctic 1990 – 2024. Map produced by Karina Berbert Bruno.
Iceland
The twentieth century was a period of substantial modernization and higher standards of living in Iceland which resulted in increased population size. The population reached 200,000 in 1968 and 300,000 in 2007. Starting in 2005, there has been substantial immigration into Iceland which has been a major contributor to population increase. The booming Icelandic economy created a demand for foreign labour. At the beginning of 2024, the population of Iceland was 383,726, its highest ever recorded size.
Greenland
There has been considerable population growth in Greenland over the twentieth century as the population increased nearly five-fold reaching 55,000 in 1989 before stabilizing. Since then, the population of Greenland has remained remarkably constant, varying by less than one thousand plus or minus of 56,000. This is because any excess of births over deaths is balanced by roughly the same amount of net-outmigration. Because it consists of a largely indigenous population, Greenland has a younger age structure and higher fertility and grew by one-quarter percent between 1990 and 2024 from natural increase. The current population is 56,699.
Greenland. By Justine Ramage, Nordregio
Faroe Islands
The population of the Faroe Islands grew during the twentieth century reaching 46,883 in 1988 before a crisis in the fisheries sector caused large outmigration and population decline. More people left the country than migrated to it during the years 1989 to 1995 but since 2016 there has been high in-migration to the country. This trend, combined with positive natural increase, has contributed to the population reaching its highest ever level at 54,492 at the beginning of 2024.
Arctic Norway
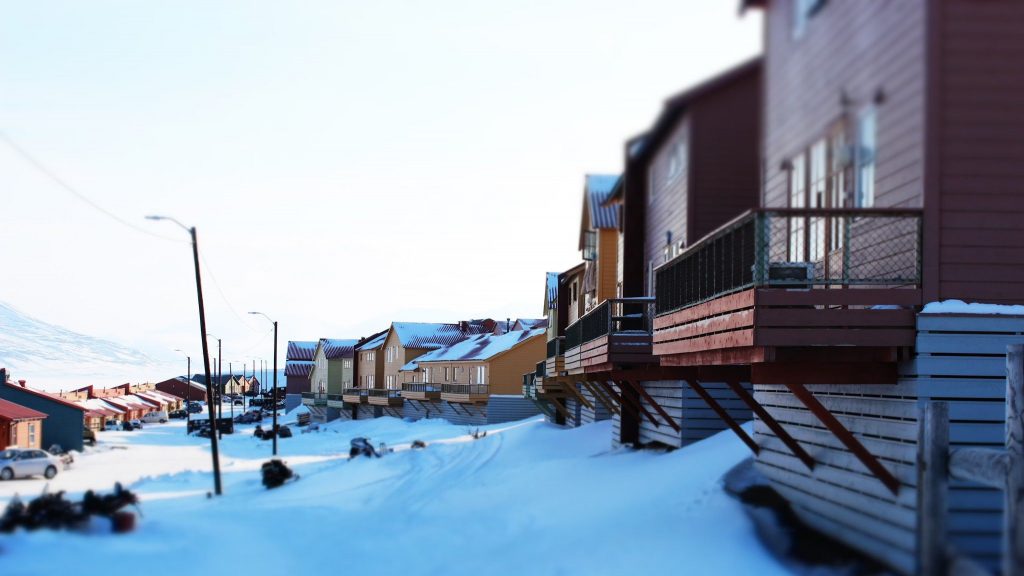
Arctic Norway consists of Norland, Troms, and Finnmark and the archipelago of Svalbard. Since 1990, the population of Norway increased by 31 percent or 1.3 million and now stands at 5.6 million. Over the period, natural increase accounted for 40 percent of this increase and net migration 60 percent. The populations of the three Arctic regions increased by much less, Nordland by 1.5 percent, Troms by 15.7 percent, and Finnmark by 1.2 percent. The population of the Norwegian settlements in Svalbard has declined over this period from 3,544 in 1990 to 3,042 in 2024, much of this attributable to out-migration.
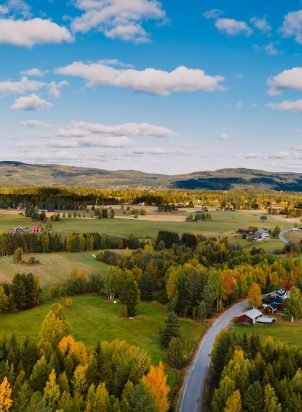
Norland, Norway. By Karl Hedin, Unsplash.com
Arctic Sweden
The two northernmost counties in Sweden, Västerbotten and Norrbotten, are considered Arctic. The population of Sweden has grown significantly since 1990, by 24 percent, with one-quarter of this growth from natural increase and three-quarters from net immigration. The population of Västerbotten grew by 11 percent since 1990, with roughly the same proportions of natural increase and net migration as the country. The population of Norrbotten has declined since 1990 by 6 percent through a combination of negative natural increase and net out-migration.
Arctic Finland
Since 1990, the population of Finland has increased by 13 percent, growing from just under 5 million to 5.6 million in 2024. Of the total increase of 630,000, there were 190,000 more births than deaths and 431,000 more immigrants than emigrants. Starting in 2016, there has been more deaths than births in Finland, thus all the population growth has come from there being positive net migration. Of the three Arctic regions of Finland, only North Ostrobothnia grew over this period increasing by 20 percent, all entirely due to natural increase. Kainuu, declined by 24 percent and Lappi by 12 percent. In both, nearly all the decline was attributable to out-migration.
Arctic Russia
The way the Soviet Union went about developing its Arctic and Siberia regions stands in sharp contrast to other Arctic countries which developed under market economy conditions.
The population of the Russian north adjusted to the new economic conditions by declining significantly through a combination of slight natural increase and large-scale outmigration of more than one-third of the population. There was decline in the population size and the settlement structure as many settlements across the Russian Arctic were either closed or abandoned when they became depopulated. Outmigration and population decline were greater in regions further east and in some smaller regions, particularly in some of the ethnic homelands of Arctic indigenous peoples. In the Far East, the population of Kamchatka declined by 40 percent, the Koryak okrug in the northern portion of the Kamchatka peninsula declined by 65 percent, the Magadan oblast by nearly two-thirds, and the Chukotka okrug by nearly 70 percent. Two different sets of northern regions emerged both economically and demographically. The Khanty-Mansiy and Yamal Nenets okrugs, the oil and gas regions in west Siberia, make up the bulk of the economic output of the Russian north and are also the only two regions which are growing in population size. Combined, these two regions increased in population size by 30 percent between 1990 and 2024, adding 520,000 persons. The other northern regions declined by 37 percent, losing 2.6 million persons.