The map shows changes in number of people travelling to work in the Nordic municipalities with the biggest populations comparing November 2021 to a pre-pandemic baseline.
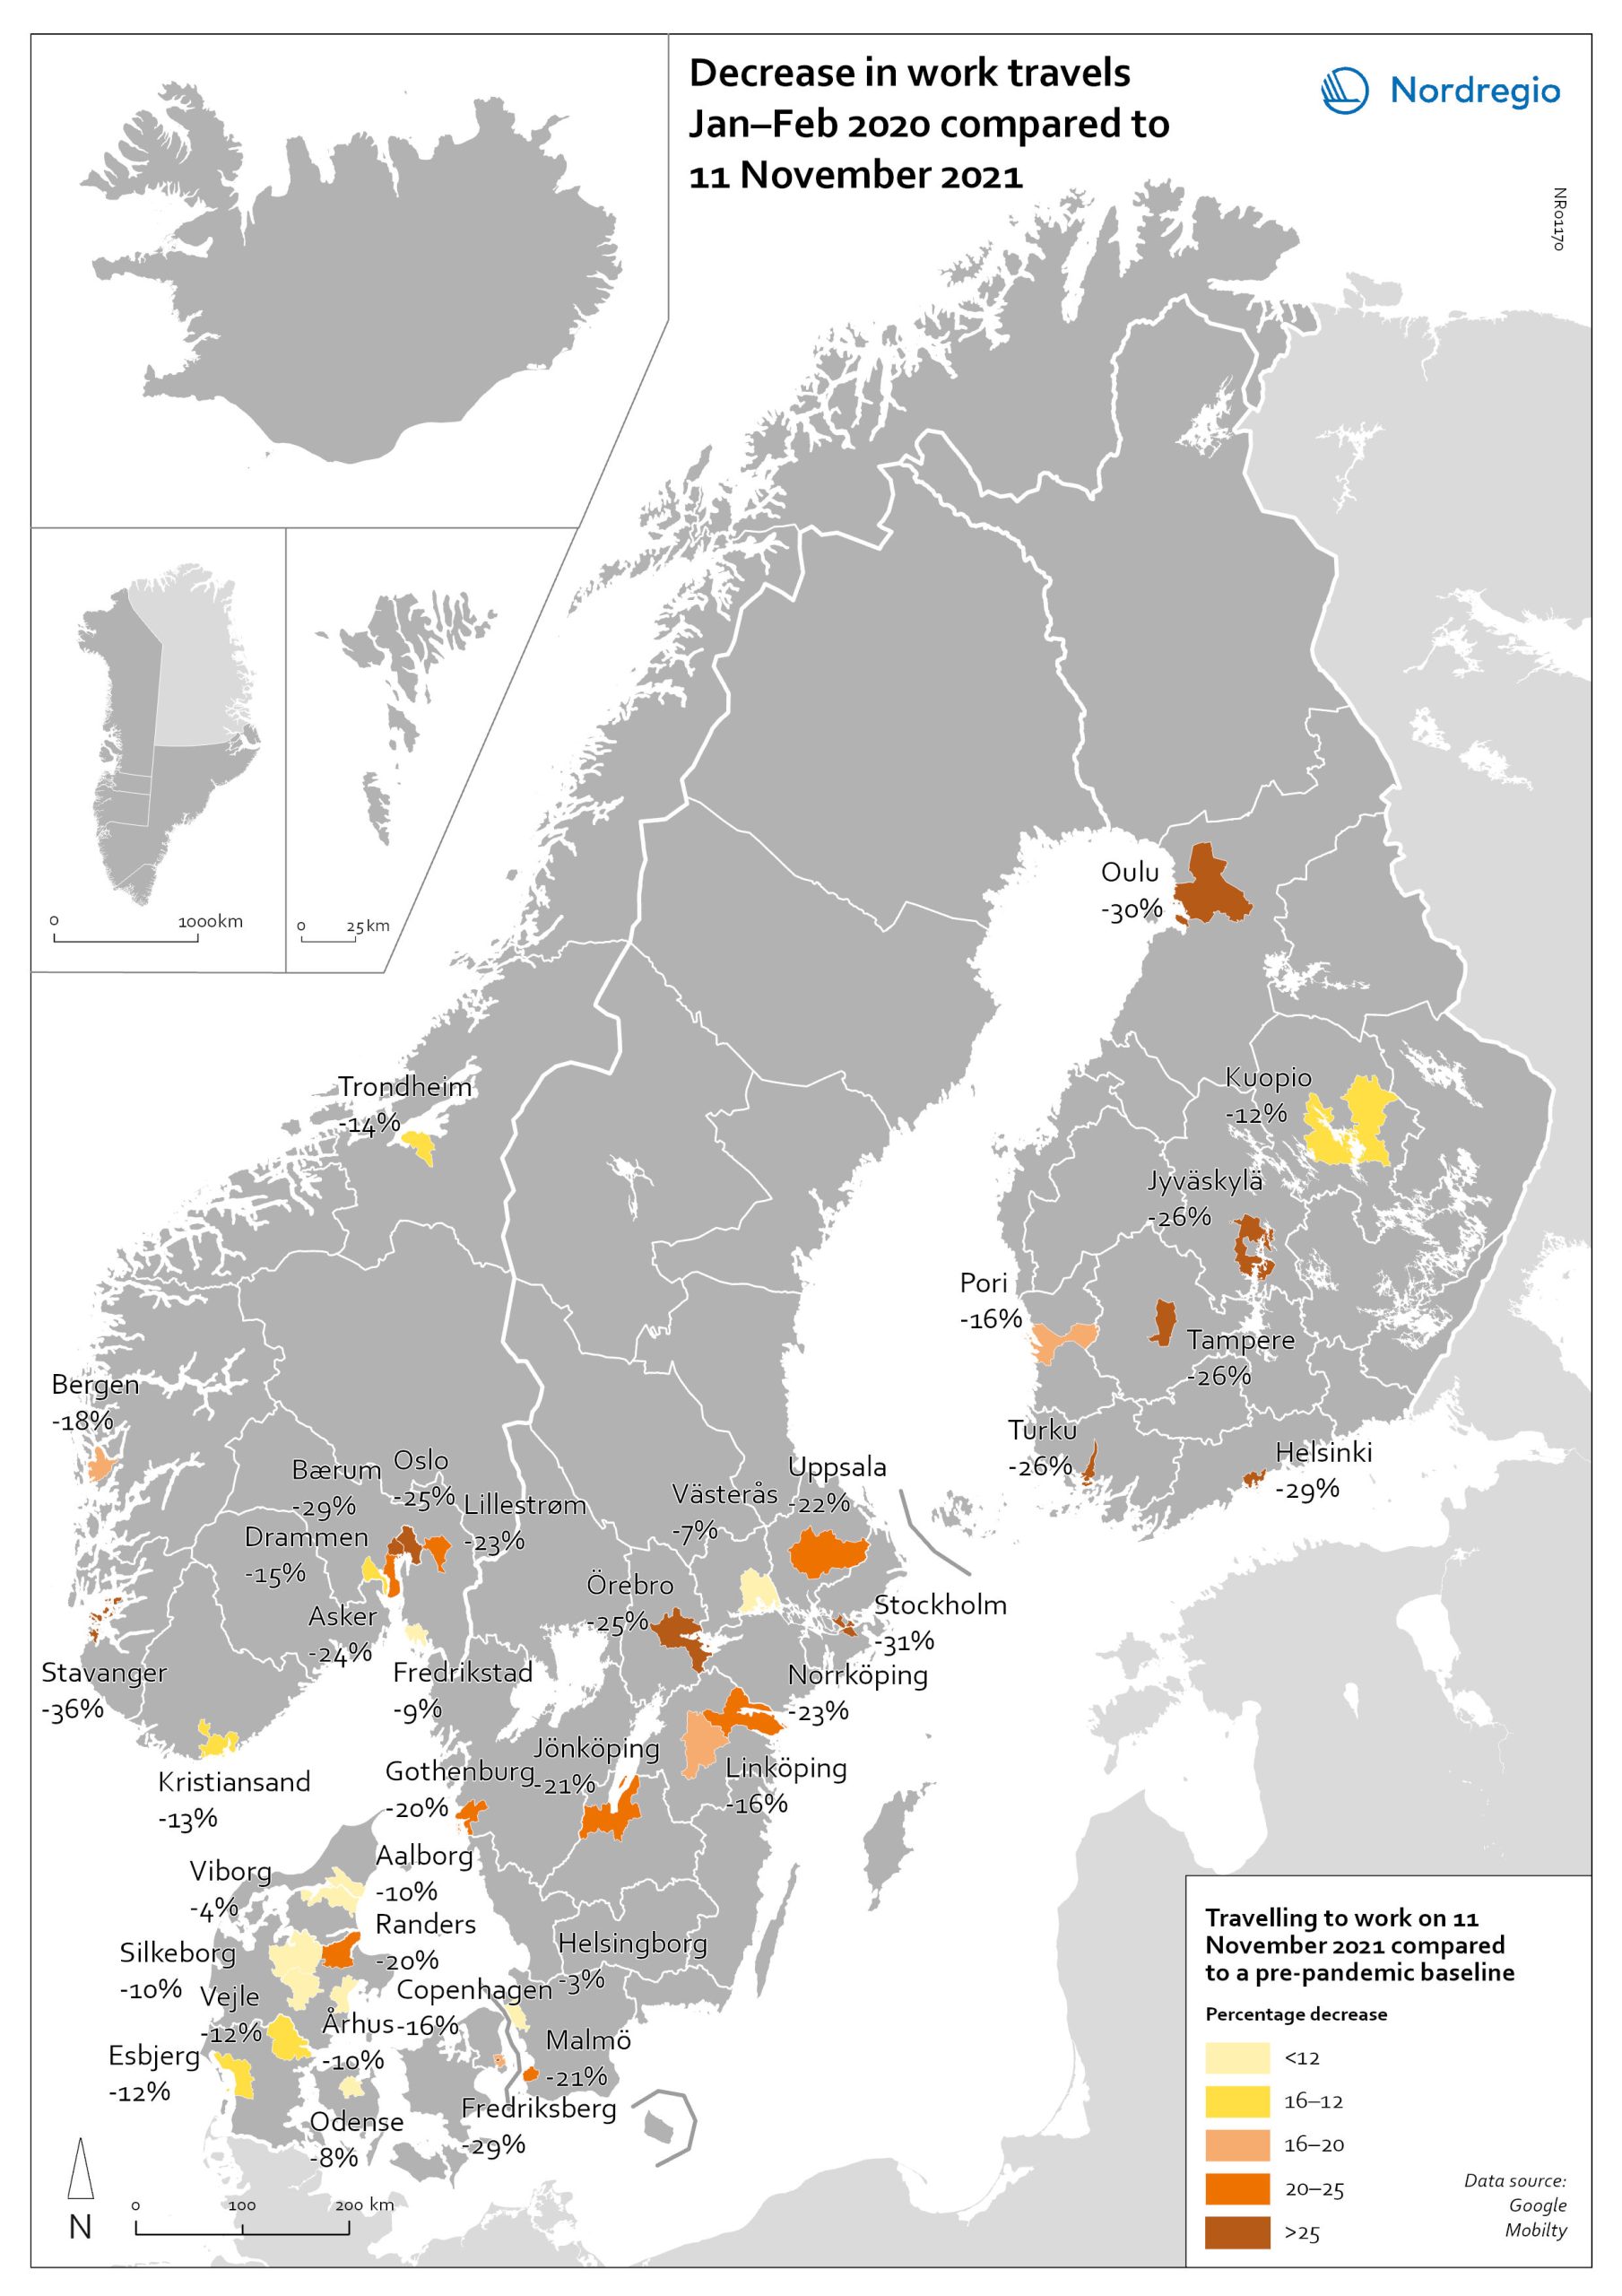
The map compares the average number of people who travelled to work on a weekday in January and February 2020 with the number of people who travelled to work on 11 November 2021 in the ten largest cities of Denmark, Finland, Norway and Sweden. The date was selected as the reference date as it is considered to be a relatively typical Thursday. It also represents a point when few movement restrictions were in place in the Nordic countries.
As can be seen from the map, all of the municipalities highlighted recorded a fall in work-related travel on 11 November compared to the pre-pandemic baseline. It was biggest in Stavanger (-36%), followed by Stockholm (-31%), Oulu (-30%), Bærum (adjacent to Oslo) (-29%), Frederiksberg (adjacent to Copenhagen) (-29%) and Helsinki (-29%). In general, the decrease was highest around the capital regions and larger cities, but there were exceptions, for example, Jyväskylä (-26%), Örebro (-25%), Jönköping (-21%), and Randers (-20%). Several large municipalities also stood out because their patterns did not change so much, for example, Helsingborg (-3%) and Västerås (-7%) in Sweden; Viborg (-3%) and Odense (-8%) in Denmark.