This map shows the spatial distribution of Nordic electricity production per capita, by volume and source type in the Nordic Region in 2021. The data is presented at a regional level, except for Iceland (national level) and Denmark (bidding zones). The circles represent electricity production in GWh, while the green shades indicate electricity production per capita (kWh). Finally, the colour of the circles denotes the source of electricity.
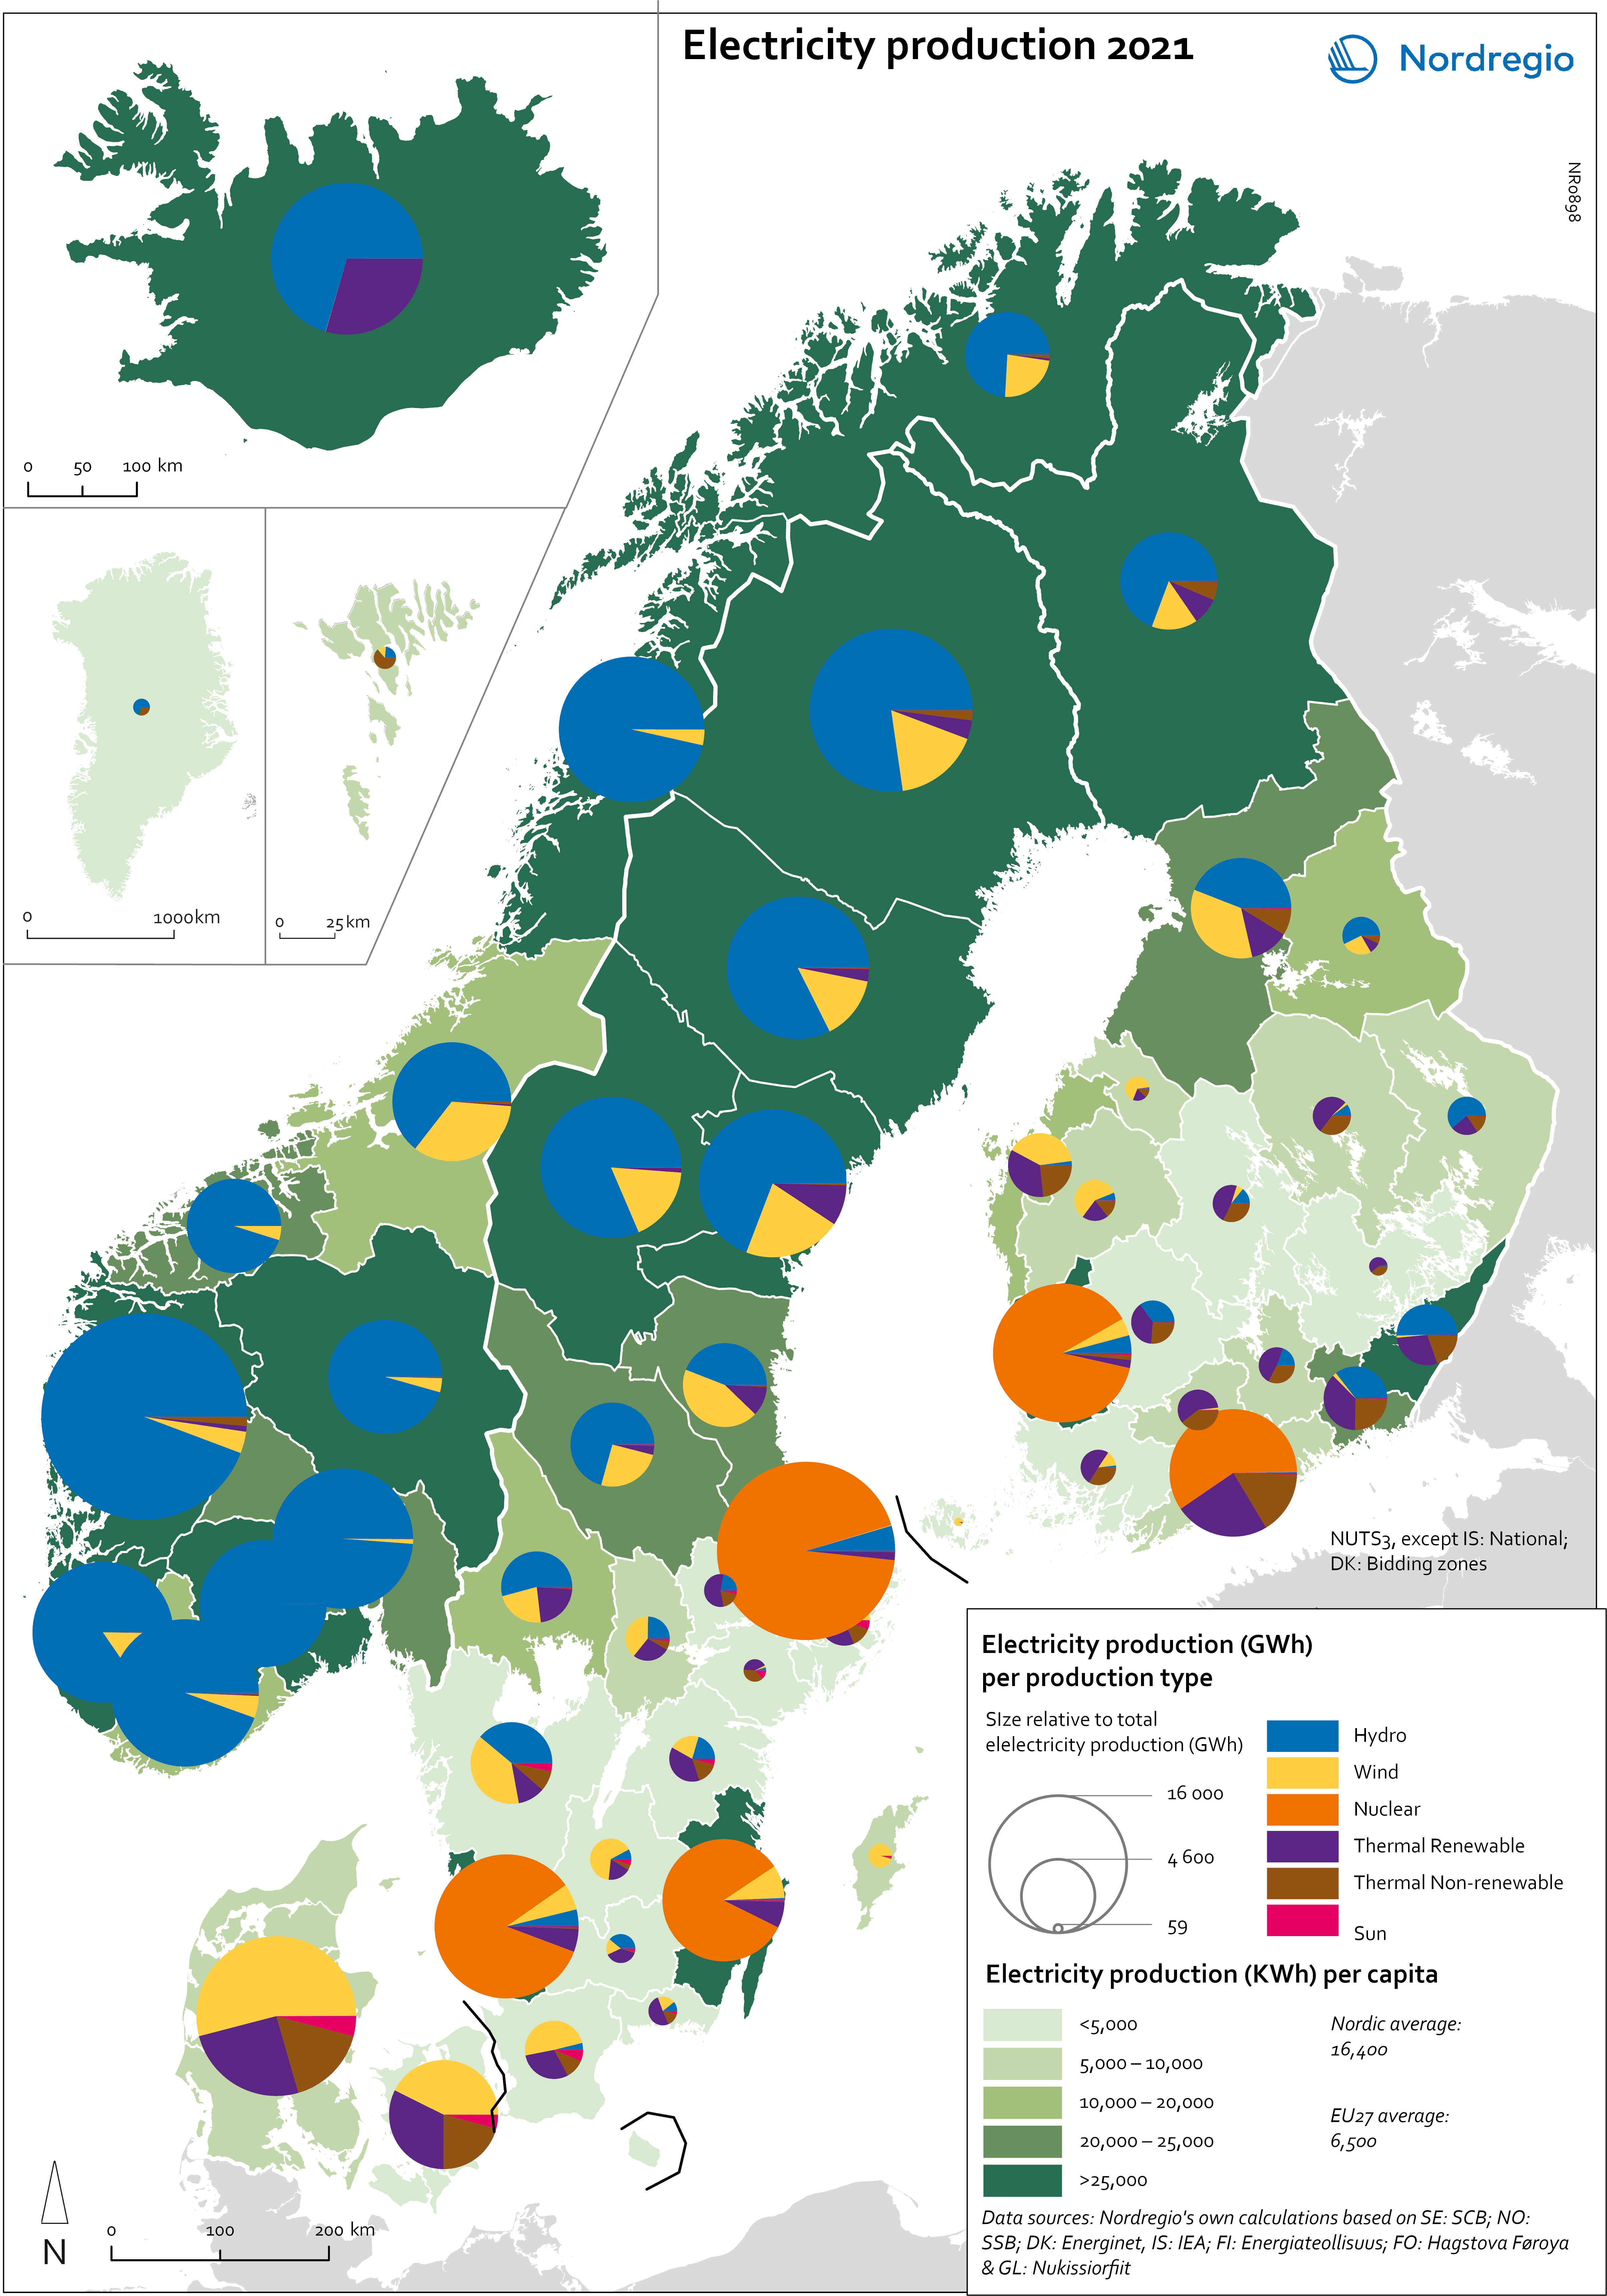
The Nordic Region overall has a high electricity production per capita; in fact, Iceland and Norway have the world’s highest electricity production per capita. The electricity mix in 2021 was 96% fossil-free – 73% from renewables (mainly hydropower) and 17% from nuclear power. In 2000 85% of the electricity production was fossile-free.
Still there are clear spatial differences in the electricity production. Firstly, we see the high amount of electricity being produced for the five nuclear facilities in Sweden and Finland. Secondly, a substantial volume of hydro-electricity is produced in southern Norway, throughout Iceland, Northern Sweden and Northern Finland. As a result, over half of Nordic electricity is produced from hydropower. Wind power is the source of electricity that has been growing the most during the last two decades, from 1.2% in 2000 to 14% in 2021. The regions with the highest electricity production per capita are in Iceland, Northern Sweden, and Northern and Western Norway. Both Finland and Denmark are net importers of electricity, but both countries have rapidly transitioned away from fossil fuels.
Cheap and fossil-free electricity is a prerequisite for the green transition and with growing industries within e.g. battery production, green steel and mining, the need for fossil-free electricity is expected to increase in the coming decades.
