This map shows the Gini coefficient in Nordic municipalities (big map) and regions (small map) in 2022 (no data was available for Iceland). Blue shades indicate a Gini coefficient below the Nordic average. Red areas indicate a Gini coefficient above the Nordic average (0.27, excluding Greenland, as a statistical outlier). The data for the Faroe Islands is for 2021.
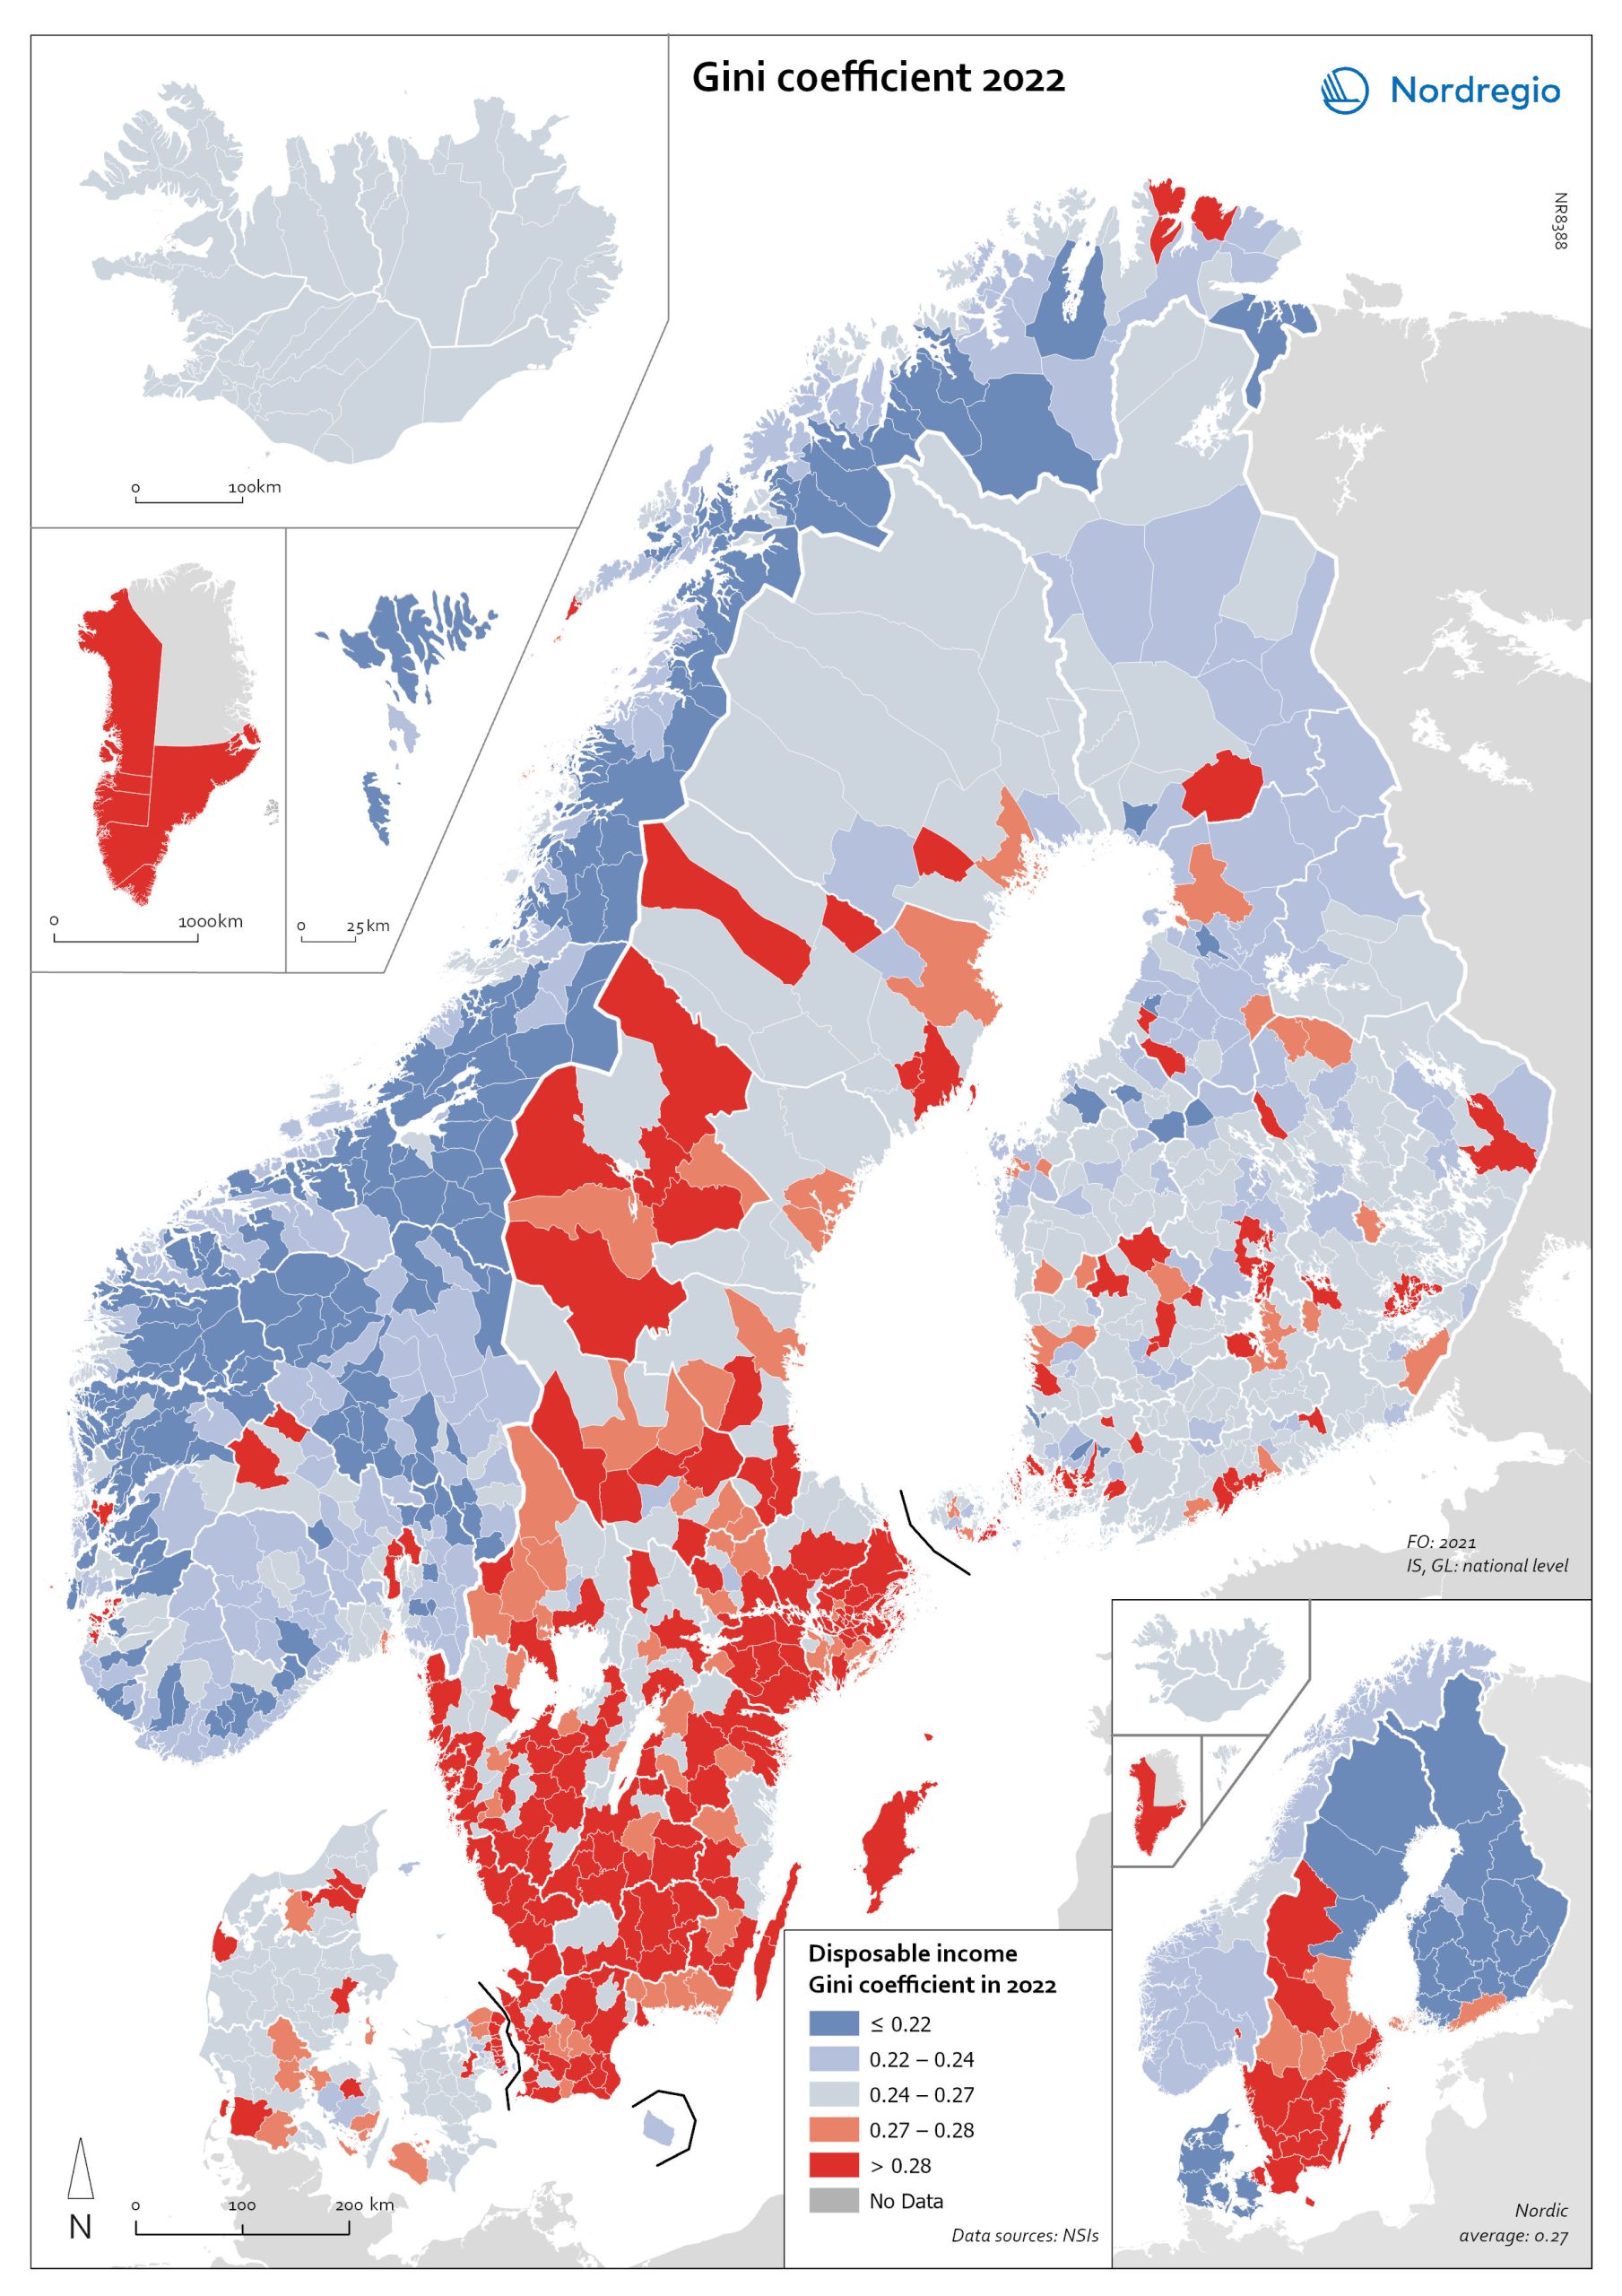
The Gini coefficient index is one of the most widely used inequality measures. The index ranges from 0–1, where 0 indicates a society where everyone receives the same income, and 1 is the highest level of inequality, where one individual or group possesses all the resources in the society, and the rest of the population has nothing.
In 2022, the highest municipality income disparities were observed in the capital city regions of Denmark, Finland and Sweden, each of which had Gini coefficients around 0.6. Danderyd (0.64), Lidingö (0.52), and Gentofte (0.51) had the highest Gini coefficients. These municipalities also have some of the highest incomes in their respective countries.
