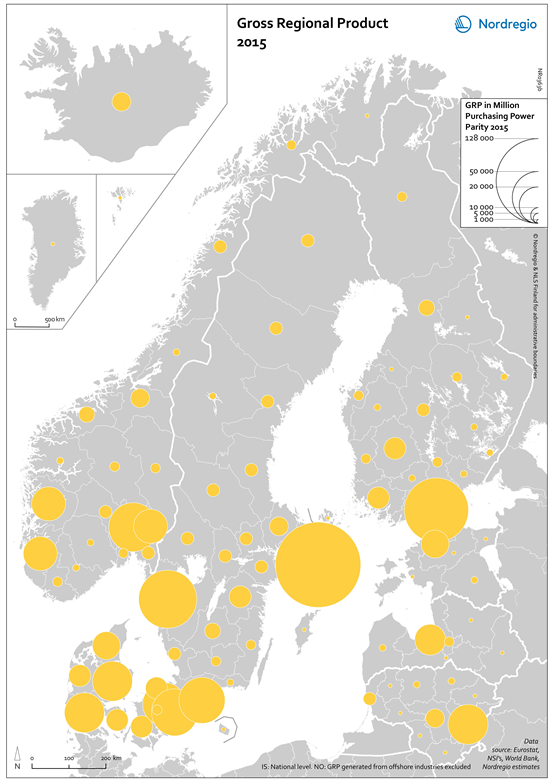
This map shows the total gross regional product (GRP) in million Purchasing Power parity (PPP) for the Nordic and Baltic Regions in 2015.
The yellow circles indicate the GRP in million PPP, with larger the circle representing regions with higher GRP.
Urban regions are often highlighted as the primary motors of economic performance. The major contributors to national GDP are the city regions of Stockholm, Helsinki, Oslo, Gothenburg, Malmö, and Copenhagen. Other places that tend to perform well economically are those regions endowed with second-tier cities: Gothenburg in Sweden, Stavanger and Trondheim in Norway and Aalborg in Denmark. This pattern is much less pronounced in Finland for which the Tampere region performs somewhat averagely in both Nordic and European terms. In general, and similarly to the situation pertaining in many other European regions, the Nordic metropolitan and city-regions remain the key centres of economic production.