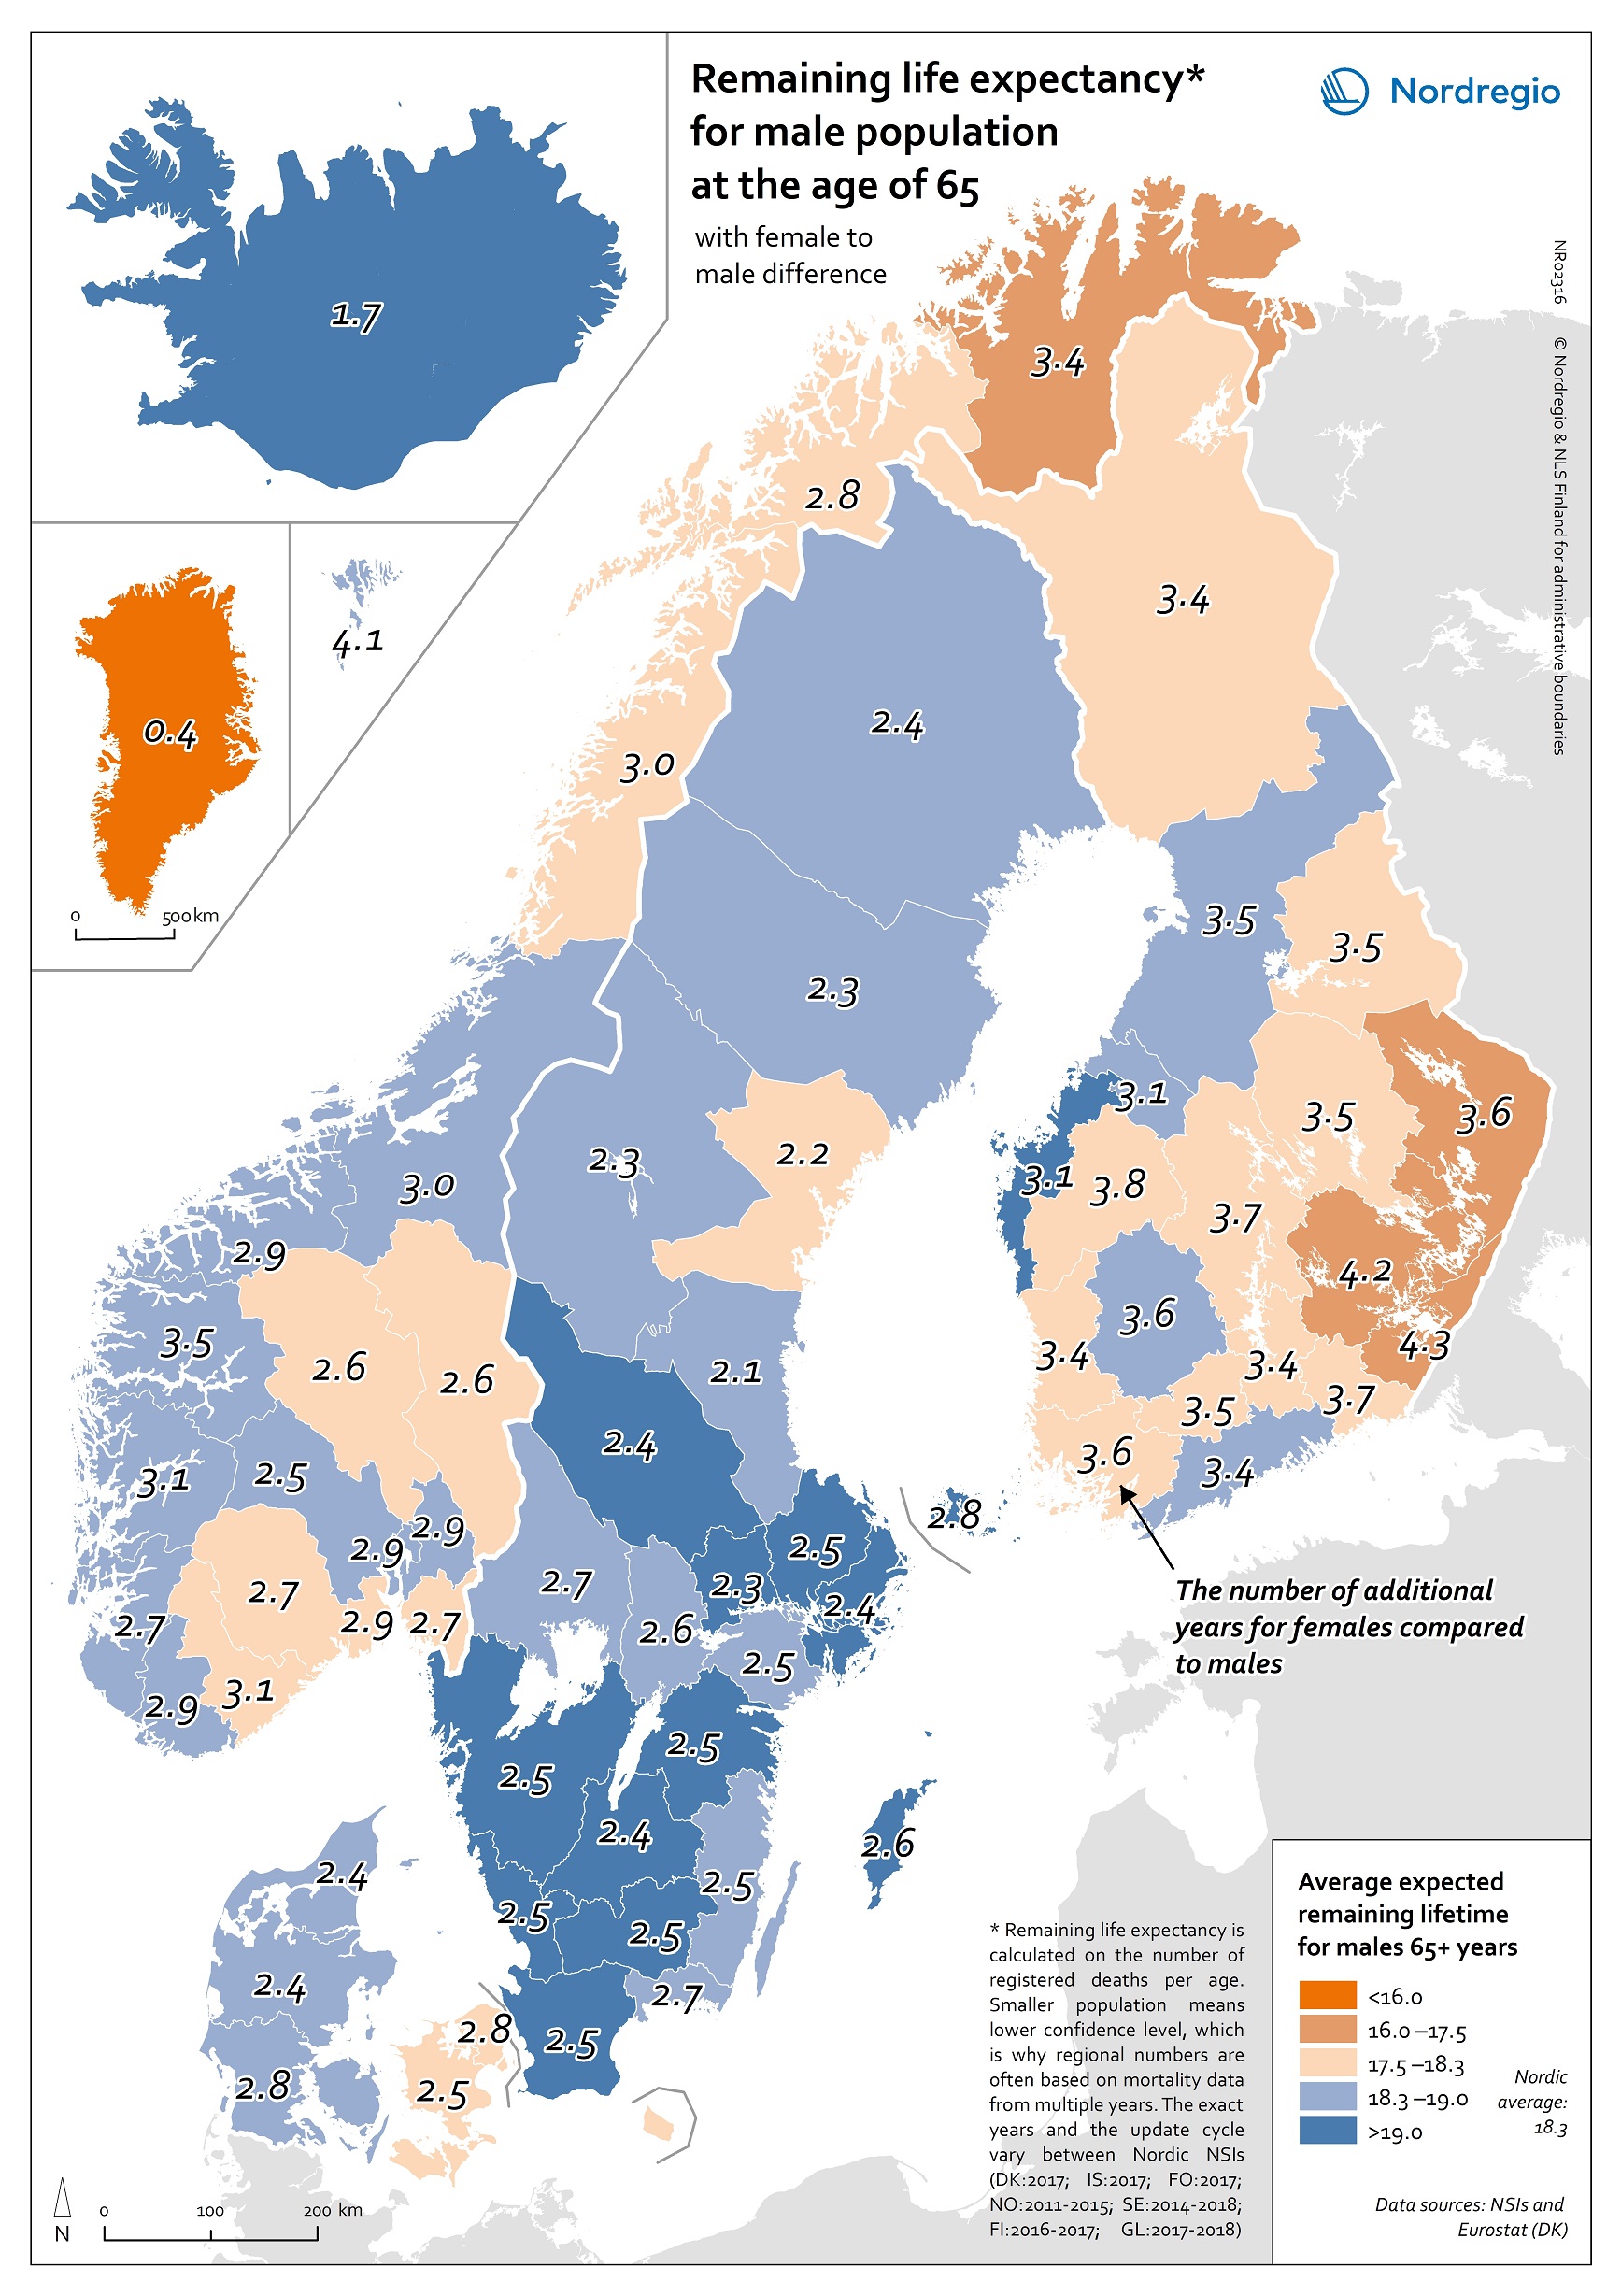
This map shows the remaining life expectancy for males aged 65 and the difference in remaining years for females compared to males.

Remaining life expectancy is calculated on the number of deaths per age. Smaller population means lower confidence level, which is why regional numbers are often based on mortality data from multiple years. The exact years and update cycle varies between Nordic NSIs. See note in map for details.
The colours in the map ranges from dark blue to dark orange, with dark orange indicating the shortest expected remaining life expectancy for males. The numbers indicate the female to male difference by region.
The Nordic average remaining lifetime for males at 65 is 18.3 years. Women are expected to live two to three years longer than men. The most obvious differences can be seen when comparing Iceland and Greenland. Iceland has the highest remaining life expectancy at 65, where men are expected to live for an additional 19.6 years on average compared to 21.3 years for women. Greenland stands out with clearly the lowest remaining life with 12.7 years for males and 13.1 years for women.
Read the digital publication here.


