The map shows the average internal net migration in 2020 and 2021 for Nordic municipalities.
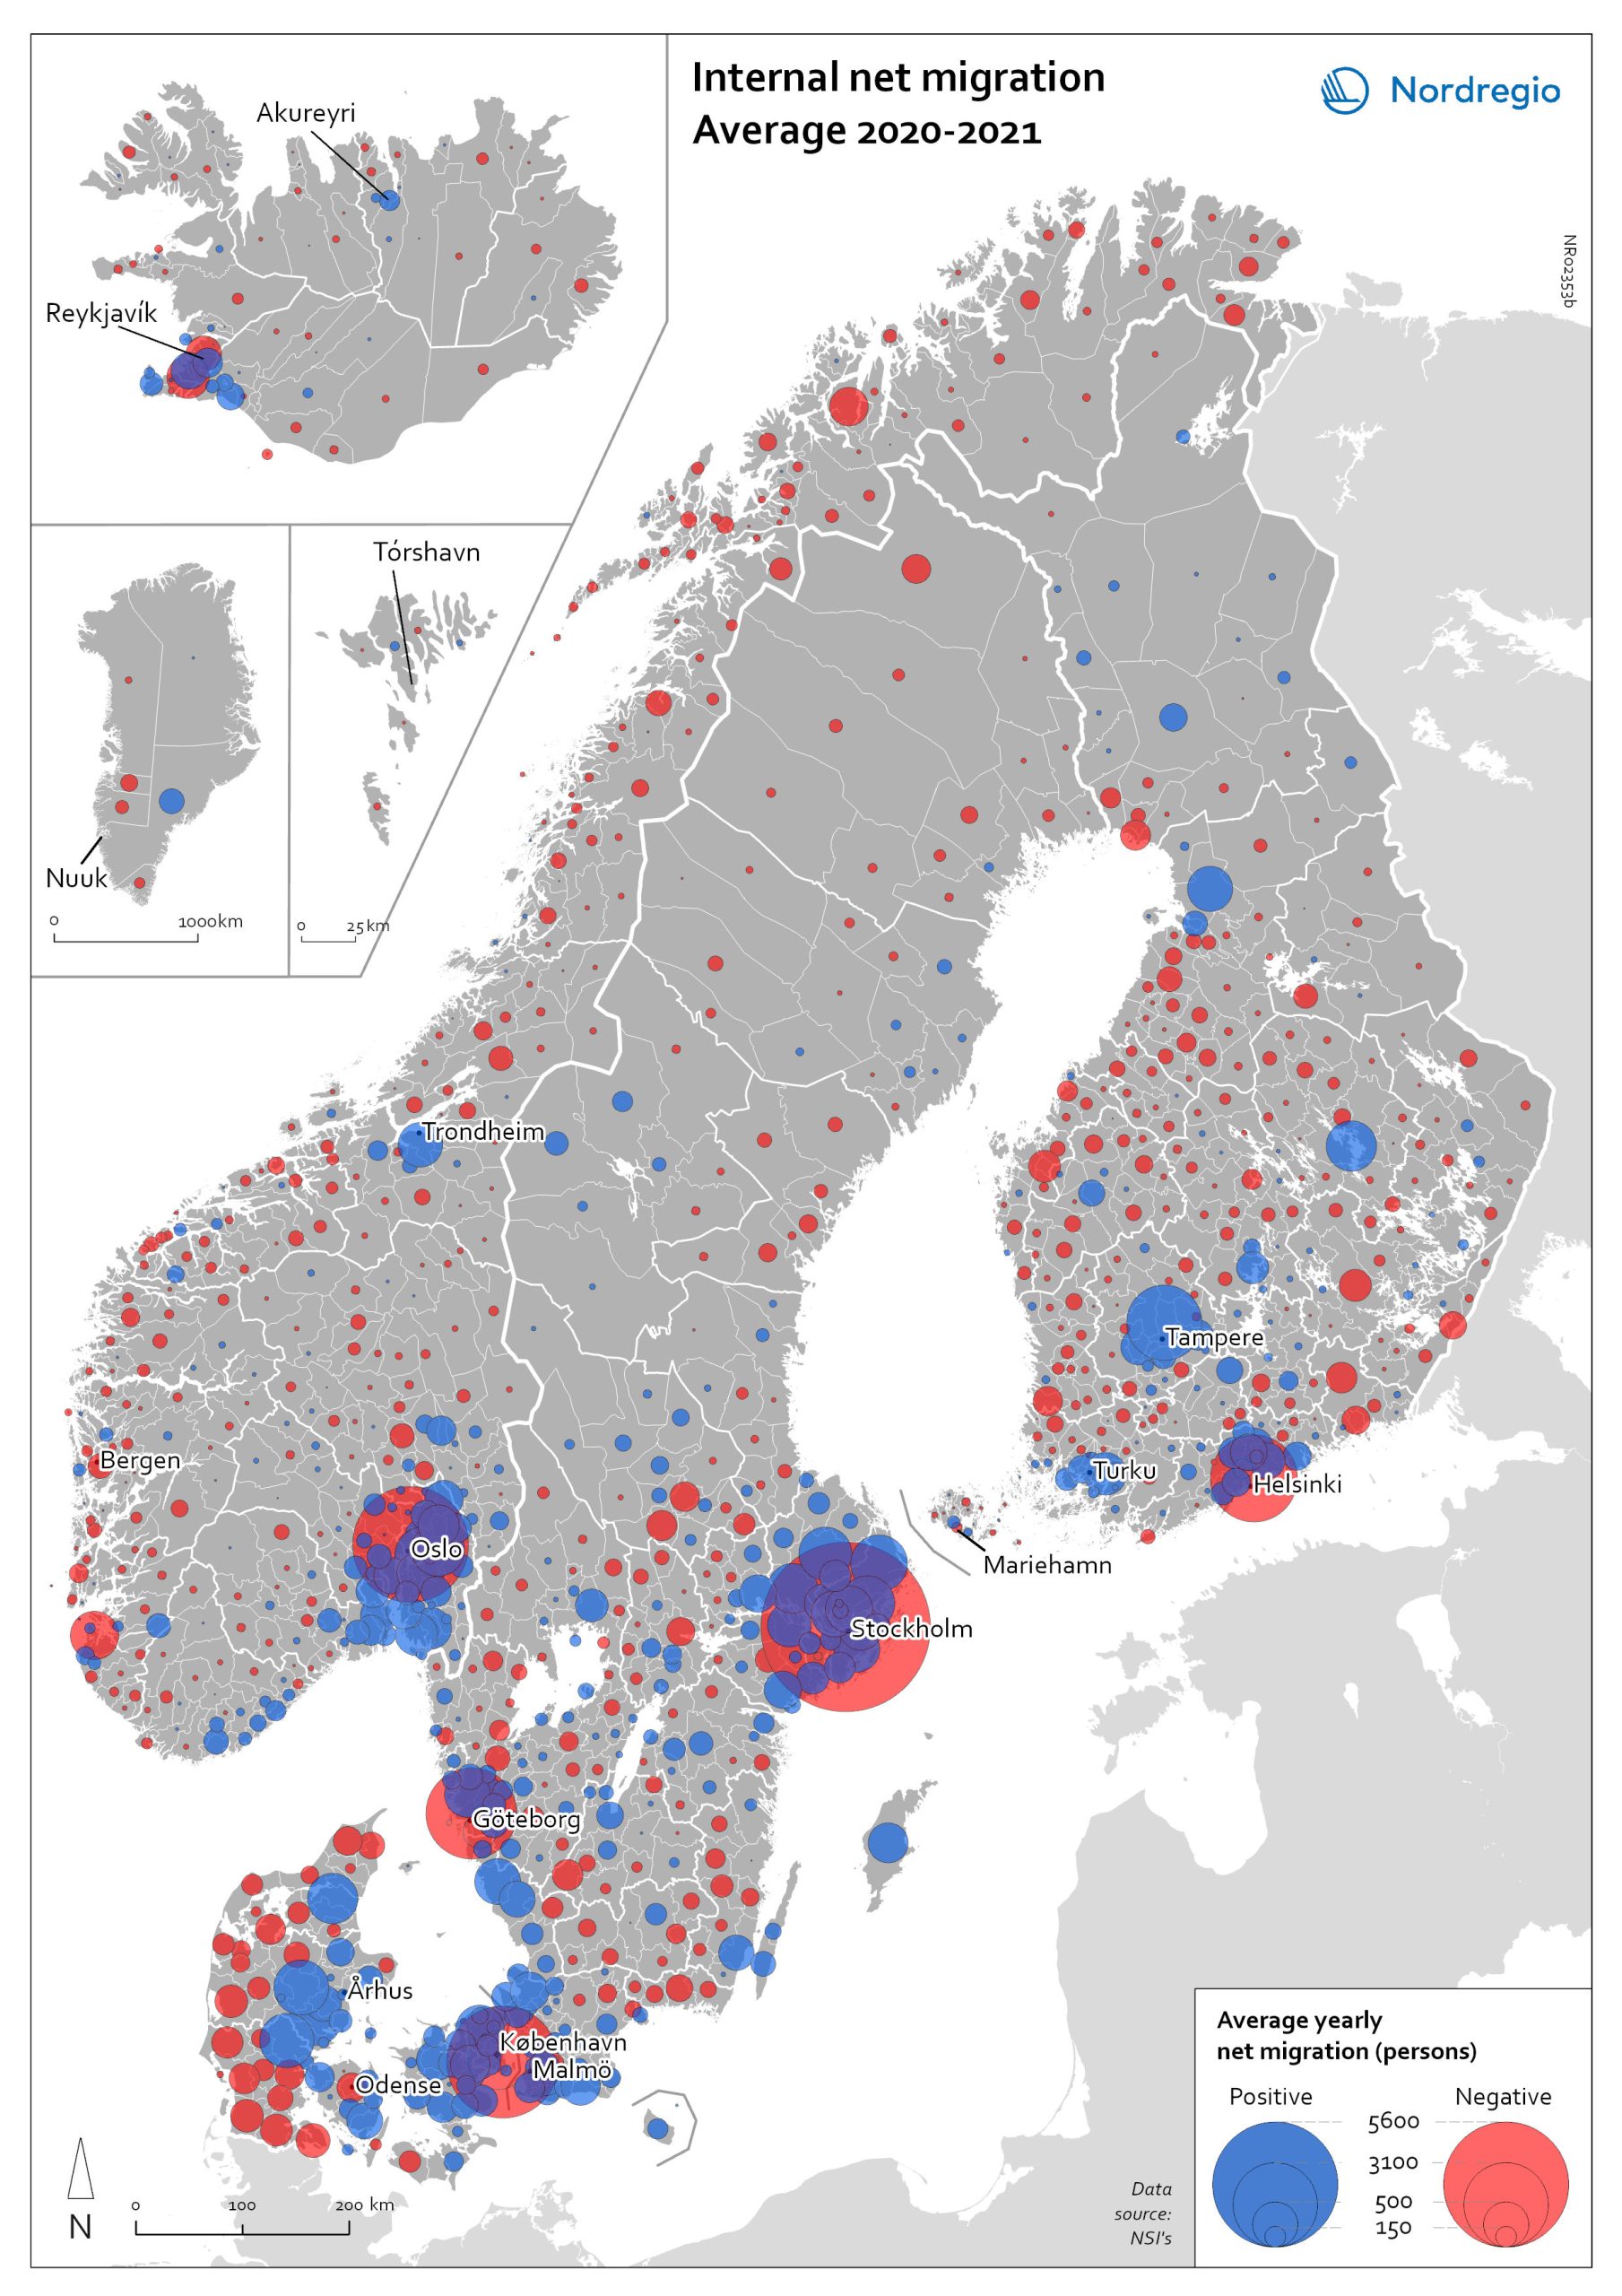
Blue dots indicate positive internal net migration (more people moving in than out) and red dots indicate negative internal net migration (more people moving out than in), while the size of the dots represents the extent of the positive or negative trend. Internal migration refers to a change of address within the same country.
The map shows substantial outmigration from the Nordic capitals, as well as from Gothenburg and Malmö in Sweden. Alongside increased suburbanisation, the map also provides some evidence of growth in medium-sized cities and smaller cities within commuting distance of larger cities.