This map shows the ratio between the age groups 20–29 and 55–64 at the municipal level (big map) and regional level (small map). A ratio below 1 indicates that fewer individuals are entering the labor market than leaving it, while a ratio above 1 means more people are entering than exiting.
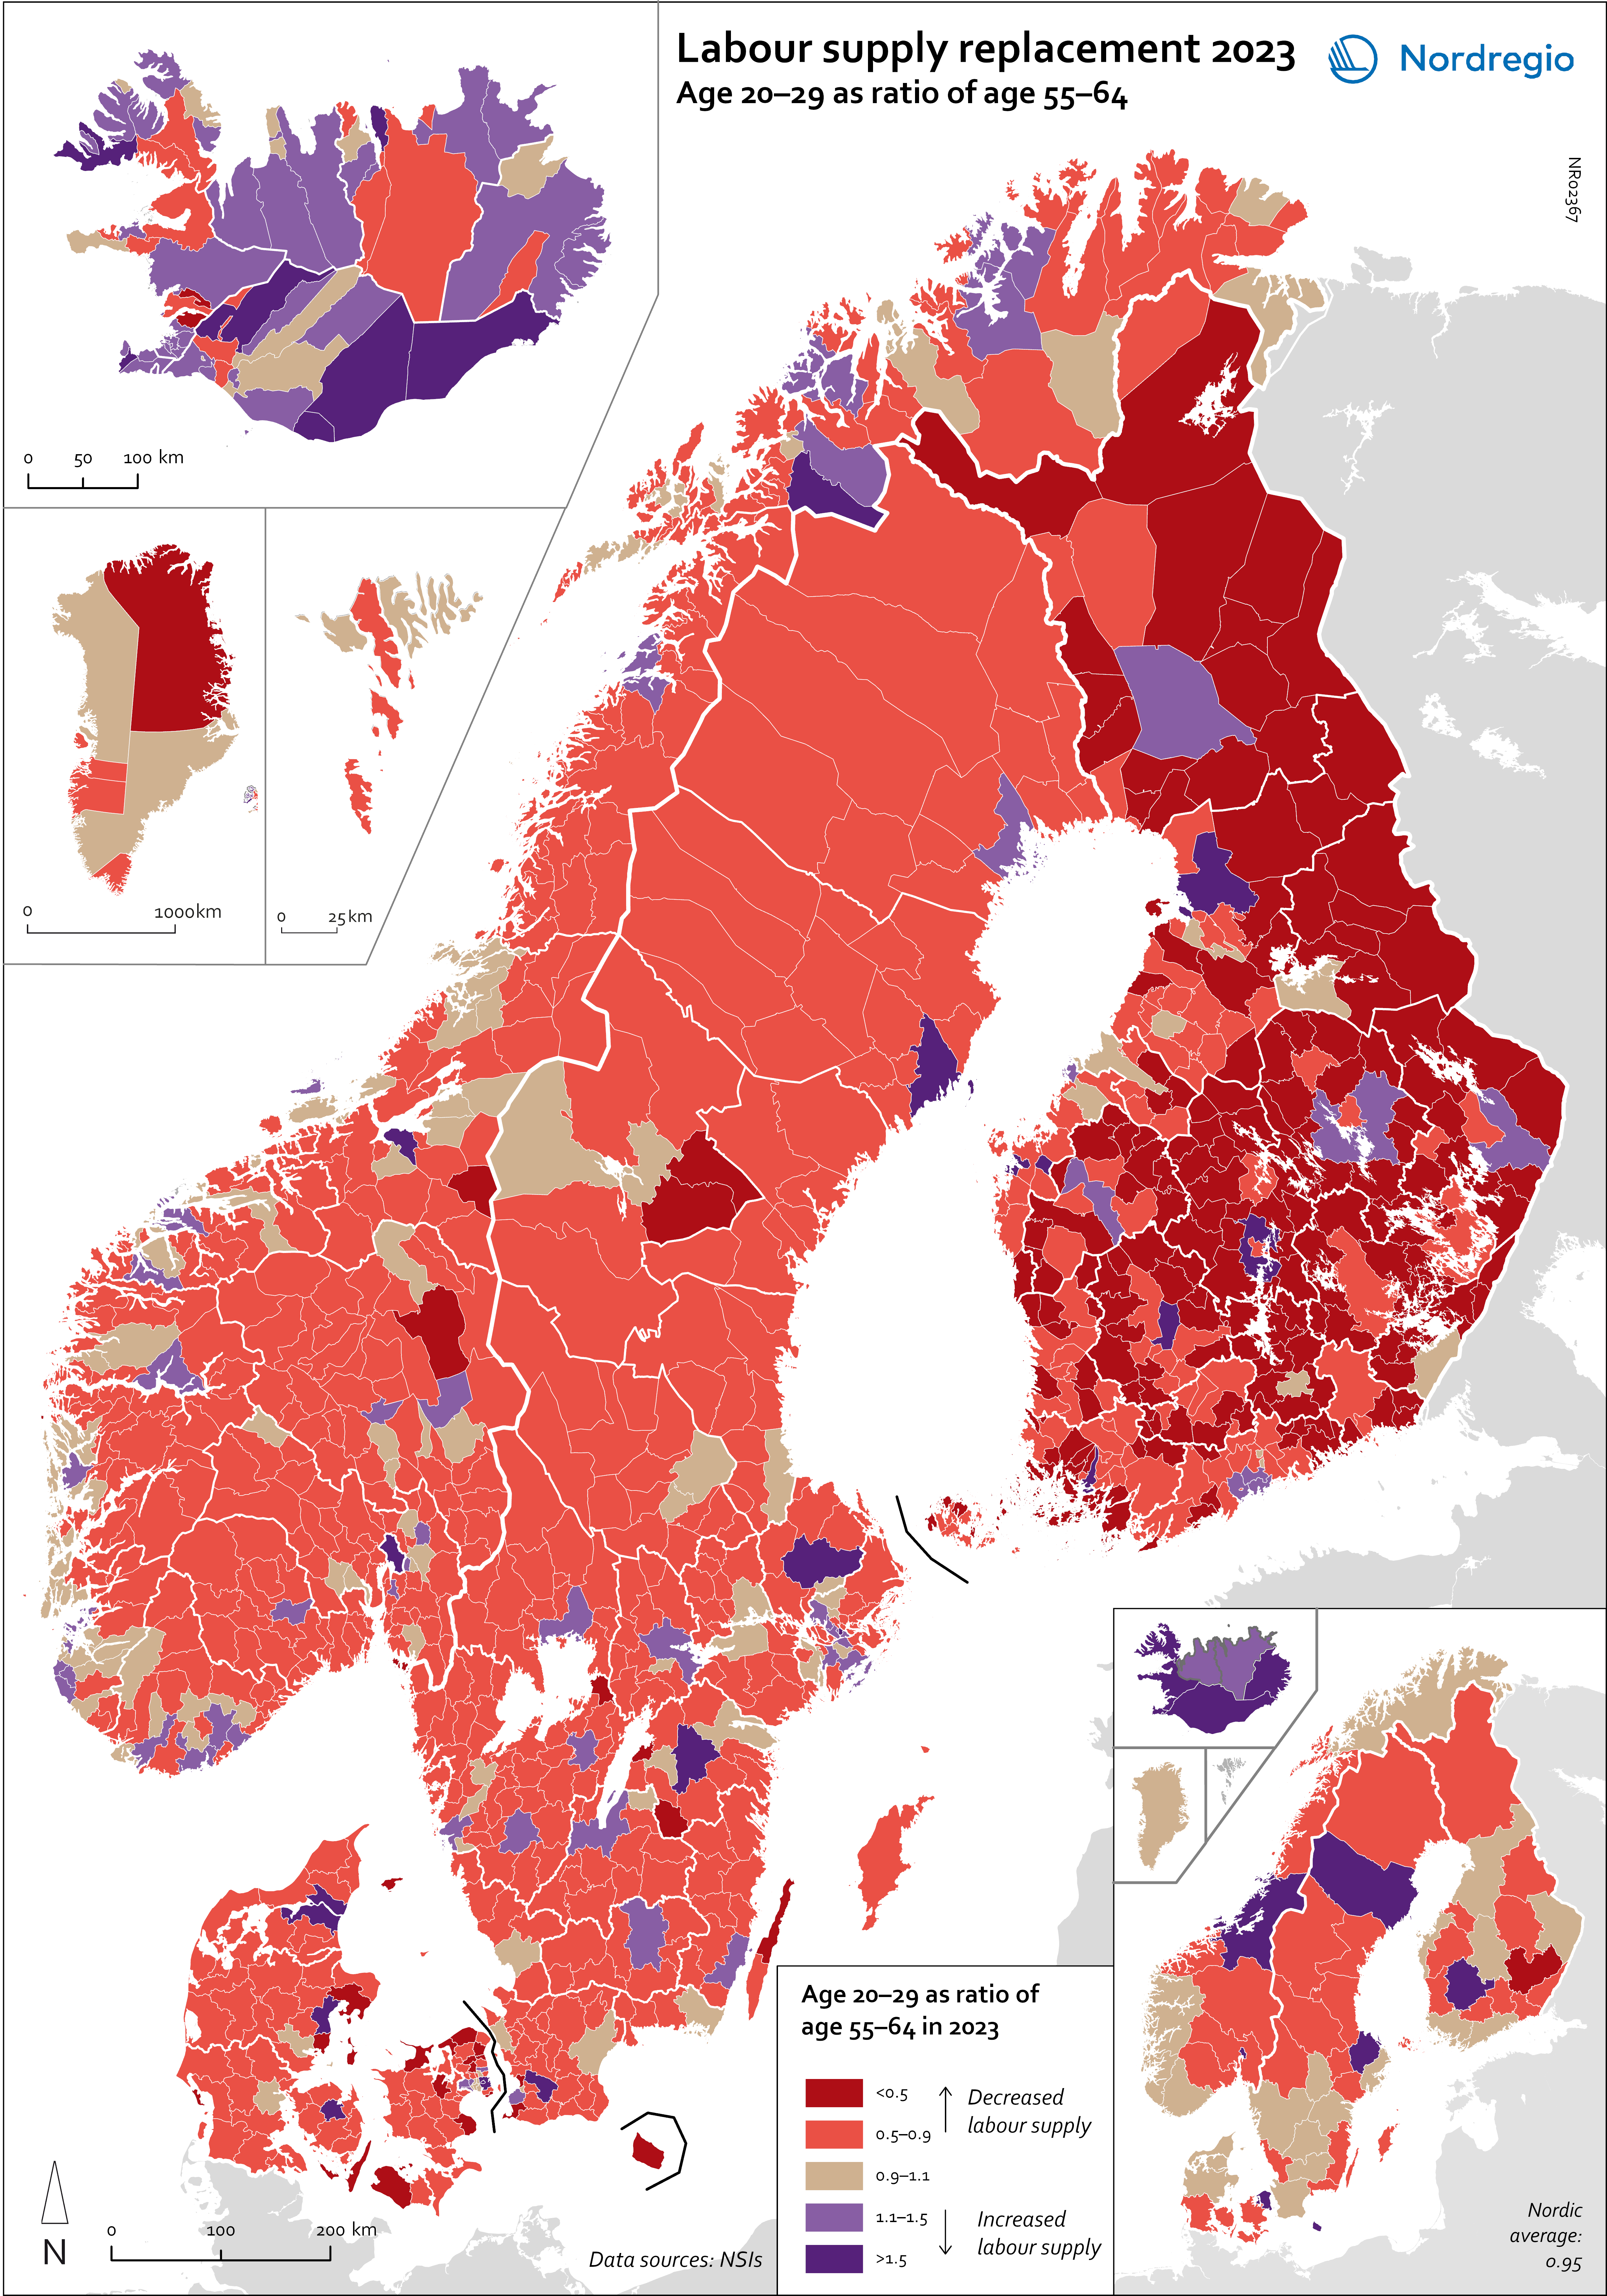
For the Nordic Region as a whole, the ratio is 0.95, meaning that there are slightly fewer people in the age group 20–29 than 55–64. Iceland is the only country with a ratio above 1 (Iceland: 1.3; Greenland: 0.99; Denmark: 0.97; Norway: 0.95; Finland: 0.94; Sweden: 0.93; Faroe Islands: 0.88; Åland: 0.63). All of the Icelandic regions, as well as the capital regions of Norway, Denmark and Finland, have a ratio above 1. In Sweden, the highest ratios are in Uppsala (1.25), Västerbotten (1.14) and Östergötland (1.03), while the ratio in Stockholm is below 1 (0.95). The lowest ratios are found in Etelä-Savo (0.62) and Åland (0.63) in Finland, Sjælland (0.63) in Denmark, Västernorrland (0.74) in Sweden, and in Vestfold og Telemark (0.78) and Viken (0.77) in Norway. However alarming these trends and developments are, they are neither new nor undescribed. An analysis of the factors and policy strategies that are influencing these developments enables adjustments to be made to future trends.
