Nordregio is an international research institute established by the Nordic Council of Ministers

31 March, 2017

Municipal population change in the Nordic Region (2010-2016)

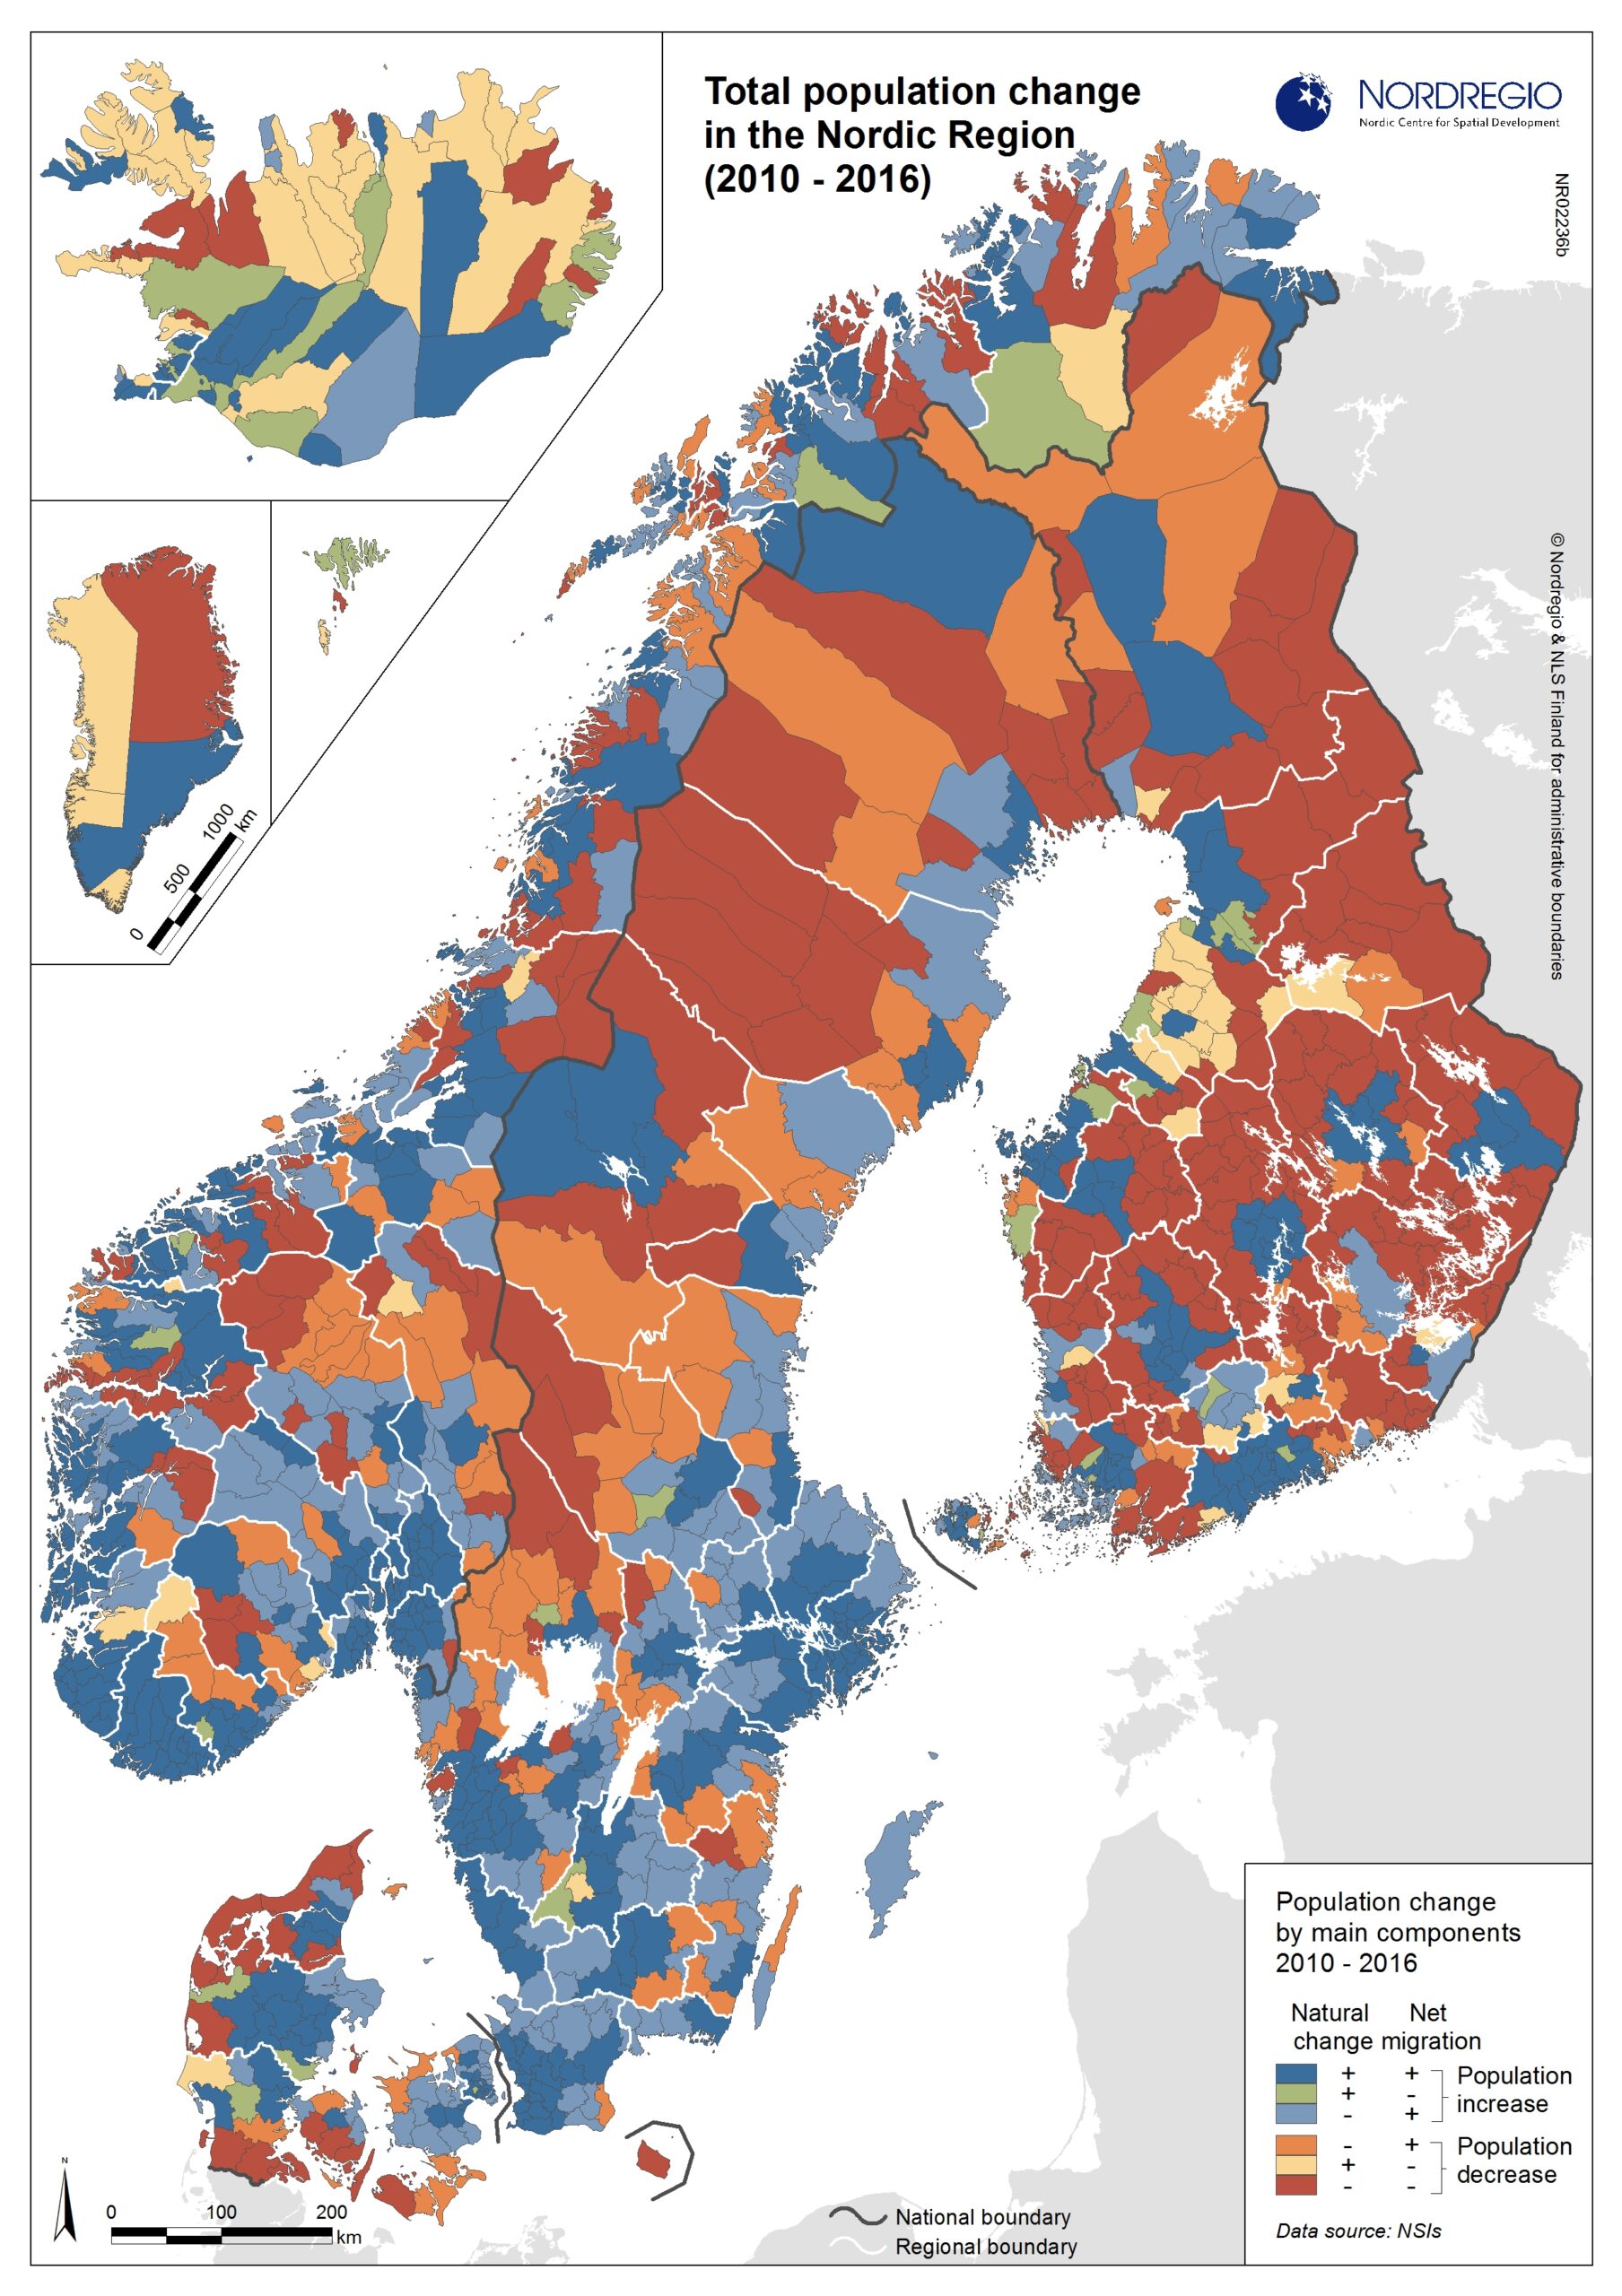
Population change by main components 2010-2016 on municipal level

Migration flows are of growing interest in the Nordic Region due to both unprecedented in-flows of migrants, and depopulation in many rural areas.

A large portion of the population increase in the Nordic municipalities has occurred around larger cities, towns and municipalities and the decreases have mostly been observed in sparsely populated areas. There are very few municipalities that have experienced population increase alongside negative net-migration however many have experienced population increase alongside negative natural change. This suggests that migration was a stronger driver of population increase than natural change from 2010-2016. At the municipal level, Sweden and Finland appear to be the countries most dramatically affected by population decline.

Map Facts

This map shows total population change, based on natural increase and net migration, in Nordic municipalities from 2010-2016.

The blue and green tones on the map represent population increase, with dark blue indicating an increase due to both natural change (i.e. more births than deaths) and net migration (i.e. more people moving in than moving out). Green indicates an increase driven largely by natural change and light blue indicates an increase driven largely by net migration.

The red and yellow tones on the map represent population decrease, with dark red indicating population decrease due to both natural change (i.e. more deaths than births) and net migration (i.e. more people moving out than moving in). Light red indicates a population decrease driven primarily by natural change and yellow indicates a population decrease driven largely by net migration.

Map id: 02236b

Designer/Cartographer
Shinan Wang

Data source
NSI’s

Published 31 March 2017

Terms of use

All images are the property of Nordregio. They may be freely used as long as the logo of Nordregio is clearly visible and the source is cited accordingly. Please give also the cartographer/designer/author credit and give full recognition to the data sources if named in the graphic.

If you have any questions, contact us:

Email: maps@nordregio.org

Phone: + 46 8 463 54 00

Source: Nordregio at www.nordregio.org