The map shows the international net migration in 2020.
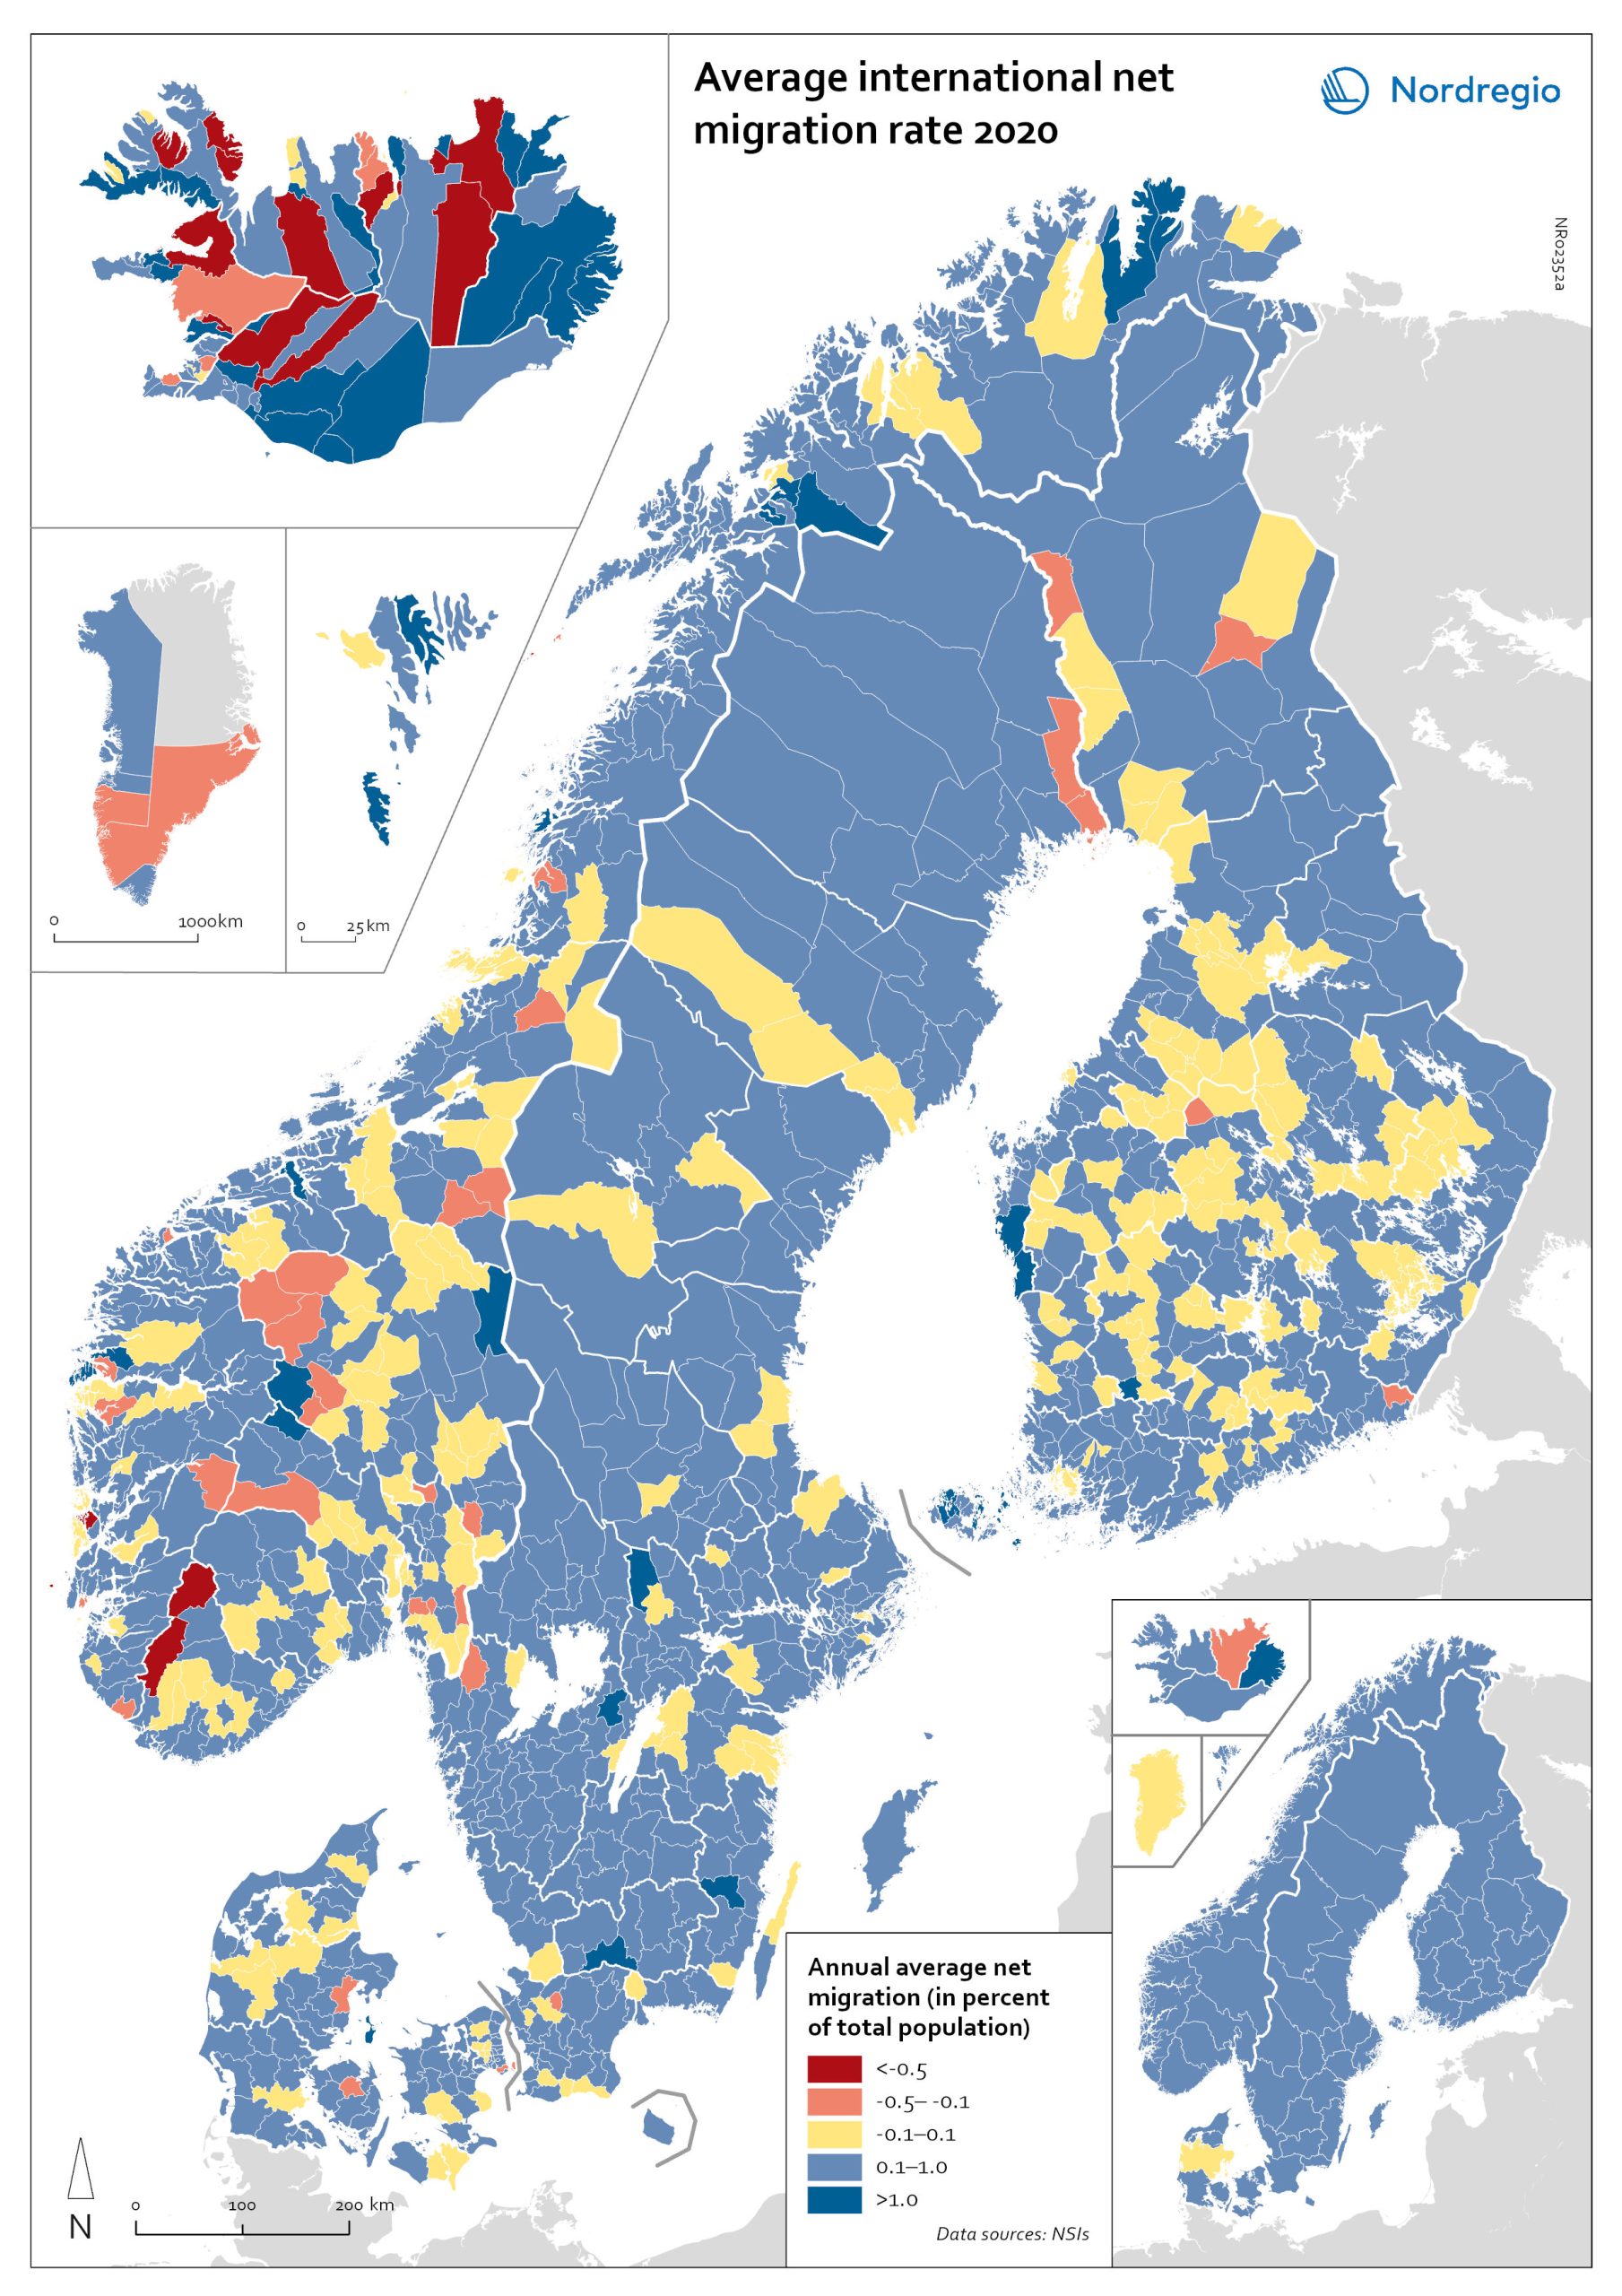
The map is related to the same map showing net migration in 2010-2019. At regional level, there are only minor changes between the net migration in 2010-2019 and 2020. All regions of Norway, all regions of Sweden except Gotland and Uppsala, and the regions of Österbotten in Finland, Midtjylland in Denmark and Norðurland eystra in Iceland experienced a slight decrease in international net migration I 2020 compared to 2010-2019. There is a more marked increase in net migration in the Faroe Islands, Greenland and the region of Norðurland vestra in Iceland, and a slight increase in the region of Austurland in Iceland. At municipal level, the maps show more changing patterns. In Denmark, Norway and Sweden, several municipalities – both in the capital, intermediate, and rural regions – had lower levels of international net migration in 2020 compared to 2010-2019. In Iceland and Finland, the picture is more balanced, with some municipalities showing a decrease, others an increase. In the Faroe Islands and Greenland, several municipalities/regions had an increase in international net migration.
