This map shows the voting turnout at the municipal and the regional level, at the latest held parliament elections. Municipalities have been divided into three categories; rural, intermediate, and urban.
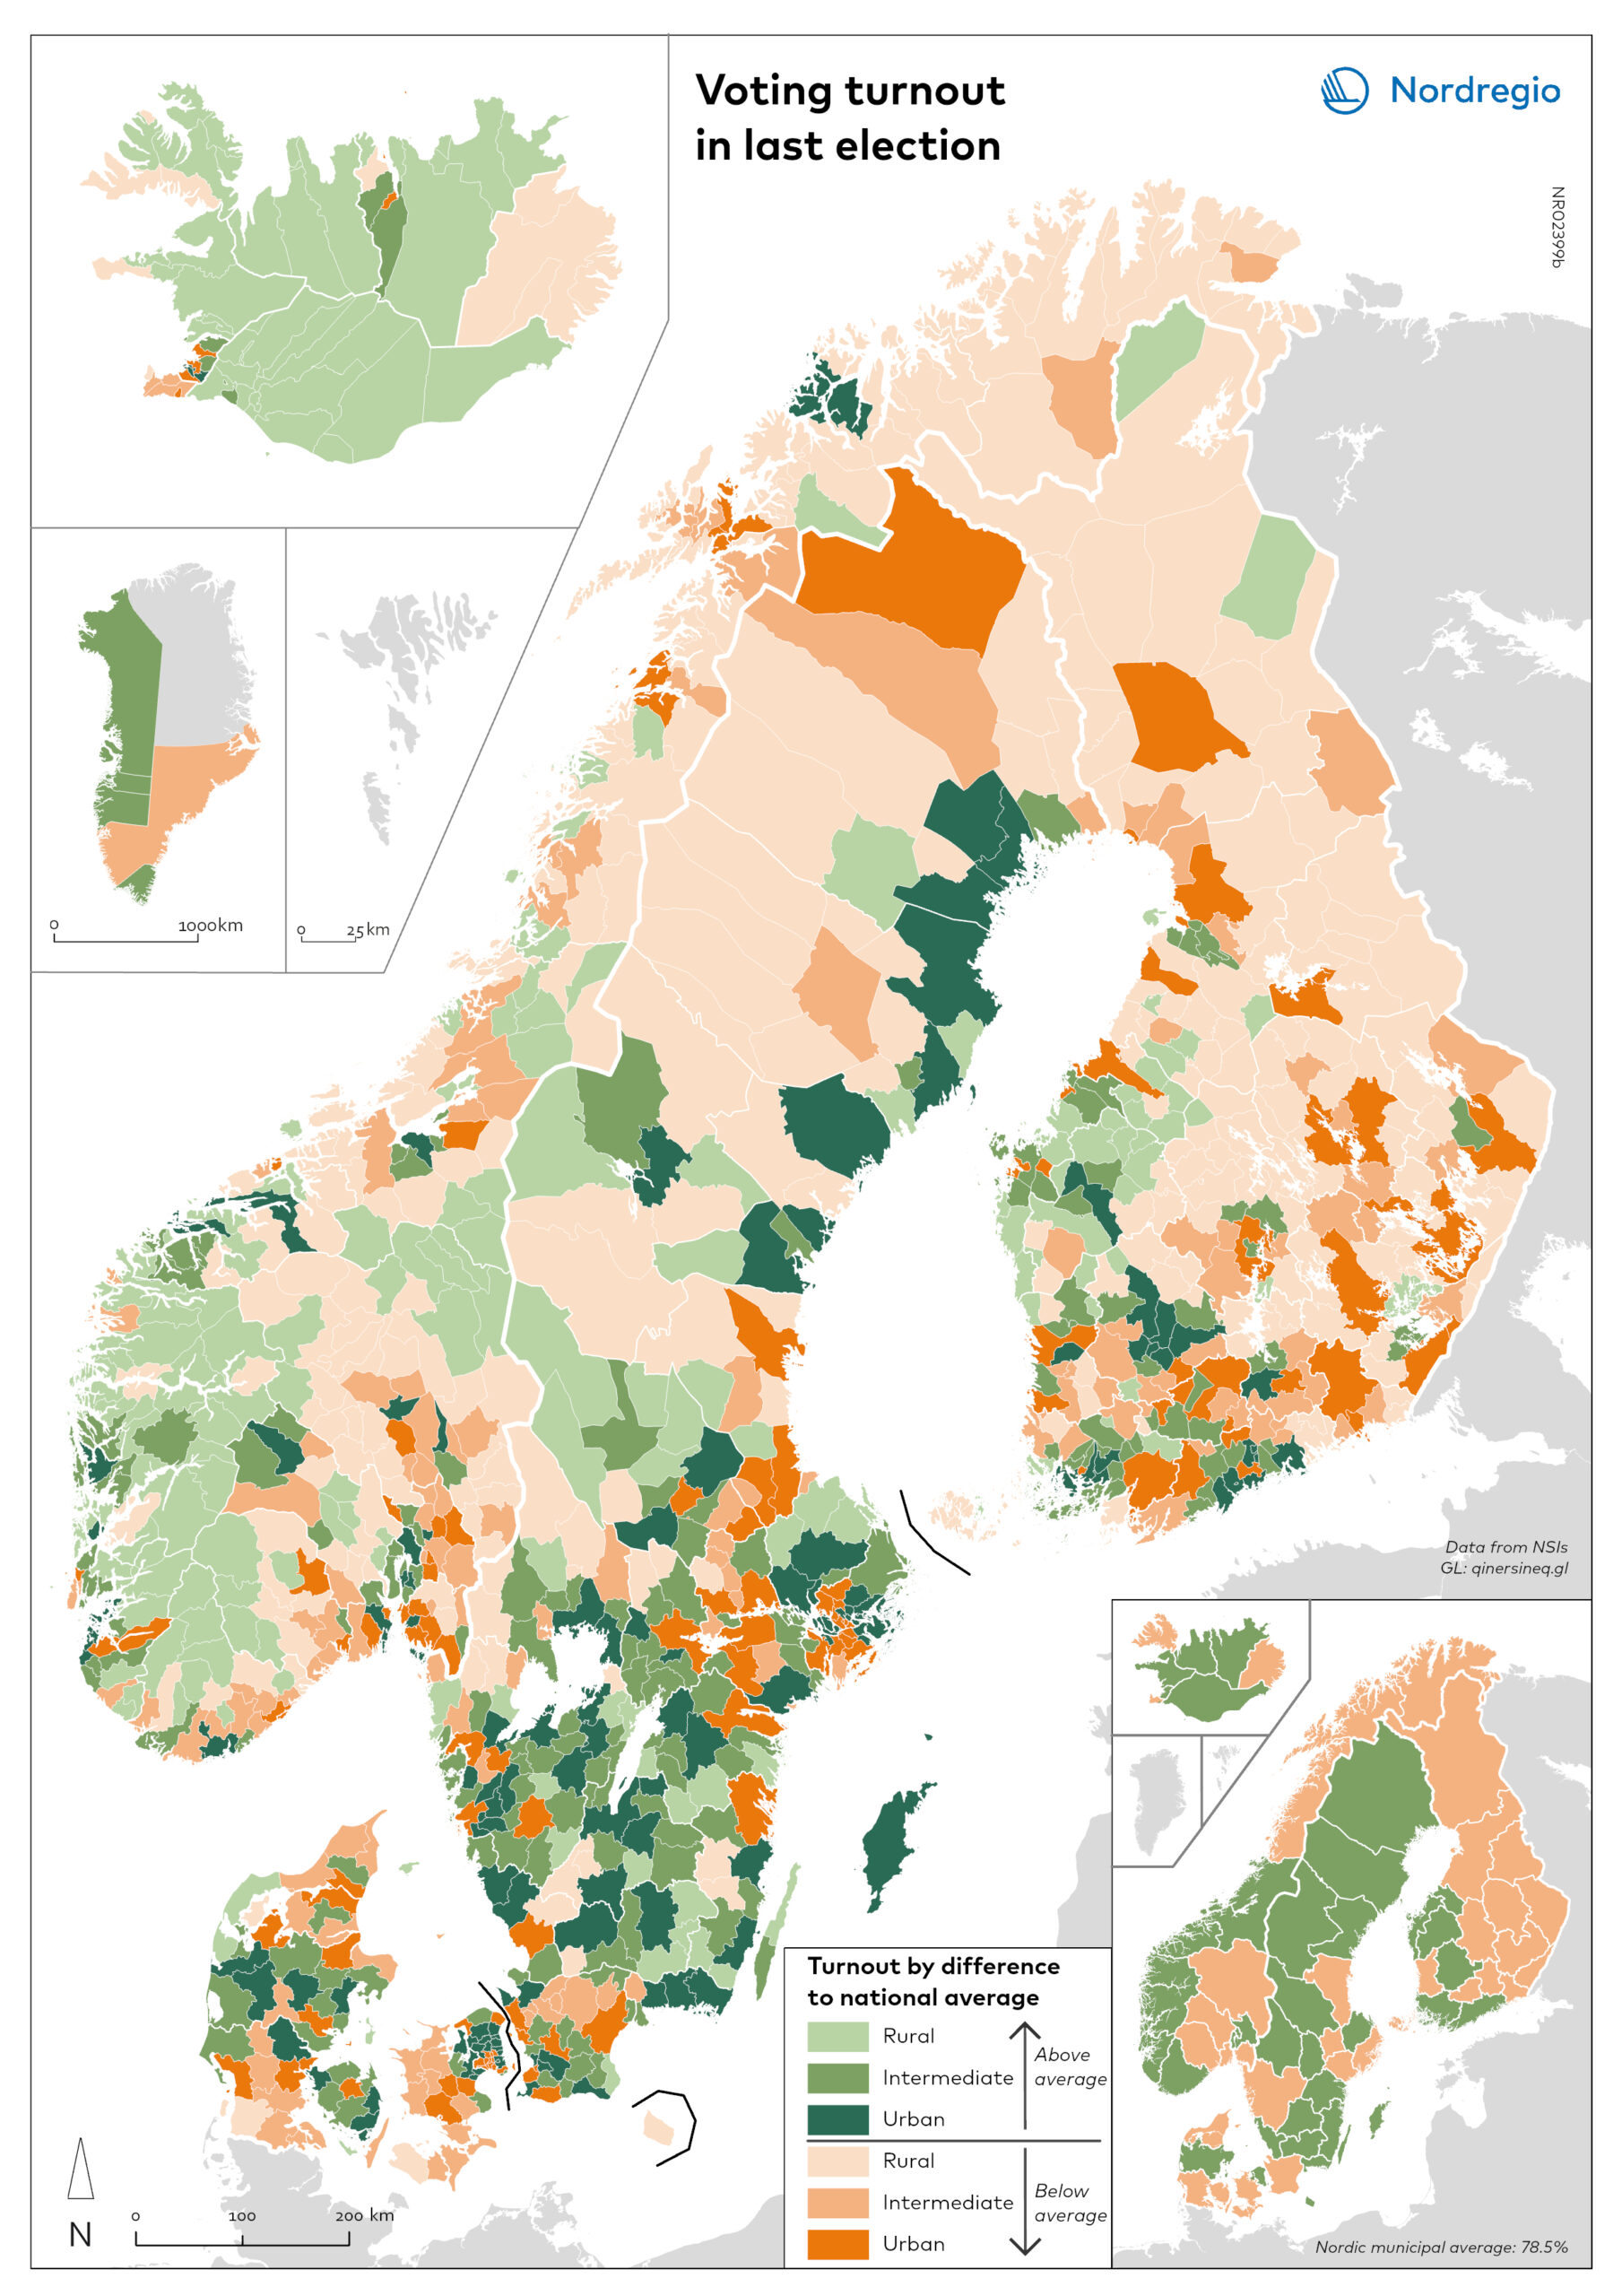
The categories are Nordregio’s own typologies based on population data. The municipalities in green are those who had an election turnout above their national average, and the shade of green indicates what type of municipality it is based on Nordregio’s typologies. The municipalities in the orange shades are municipalities that had a lower turnout than its respective national average.
The regional inset in the bottom corner indicates if the region presented values above or below the national average. The table below shows the average voting turnout for municipalities based on their country and typology.
| Rural | Intermediate | Urban | |
| Denmark | 81.8 % | 83.7 % | 84.2 % |
| Iceland | 79.9 % | 81.4 % | 80.2 % |
| Finland | 68.9 % | 71.4 % | 72.6 % |
| Norway | 77.4 % | 79.5 % | 79.9 % |
| Sweden | 84.2 % | 85.7 % | 83.8 % |
