The map shows the relative change of the OECD House Price Index from Q2 2020 to Q2 2021.
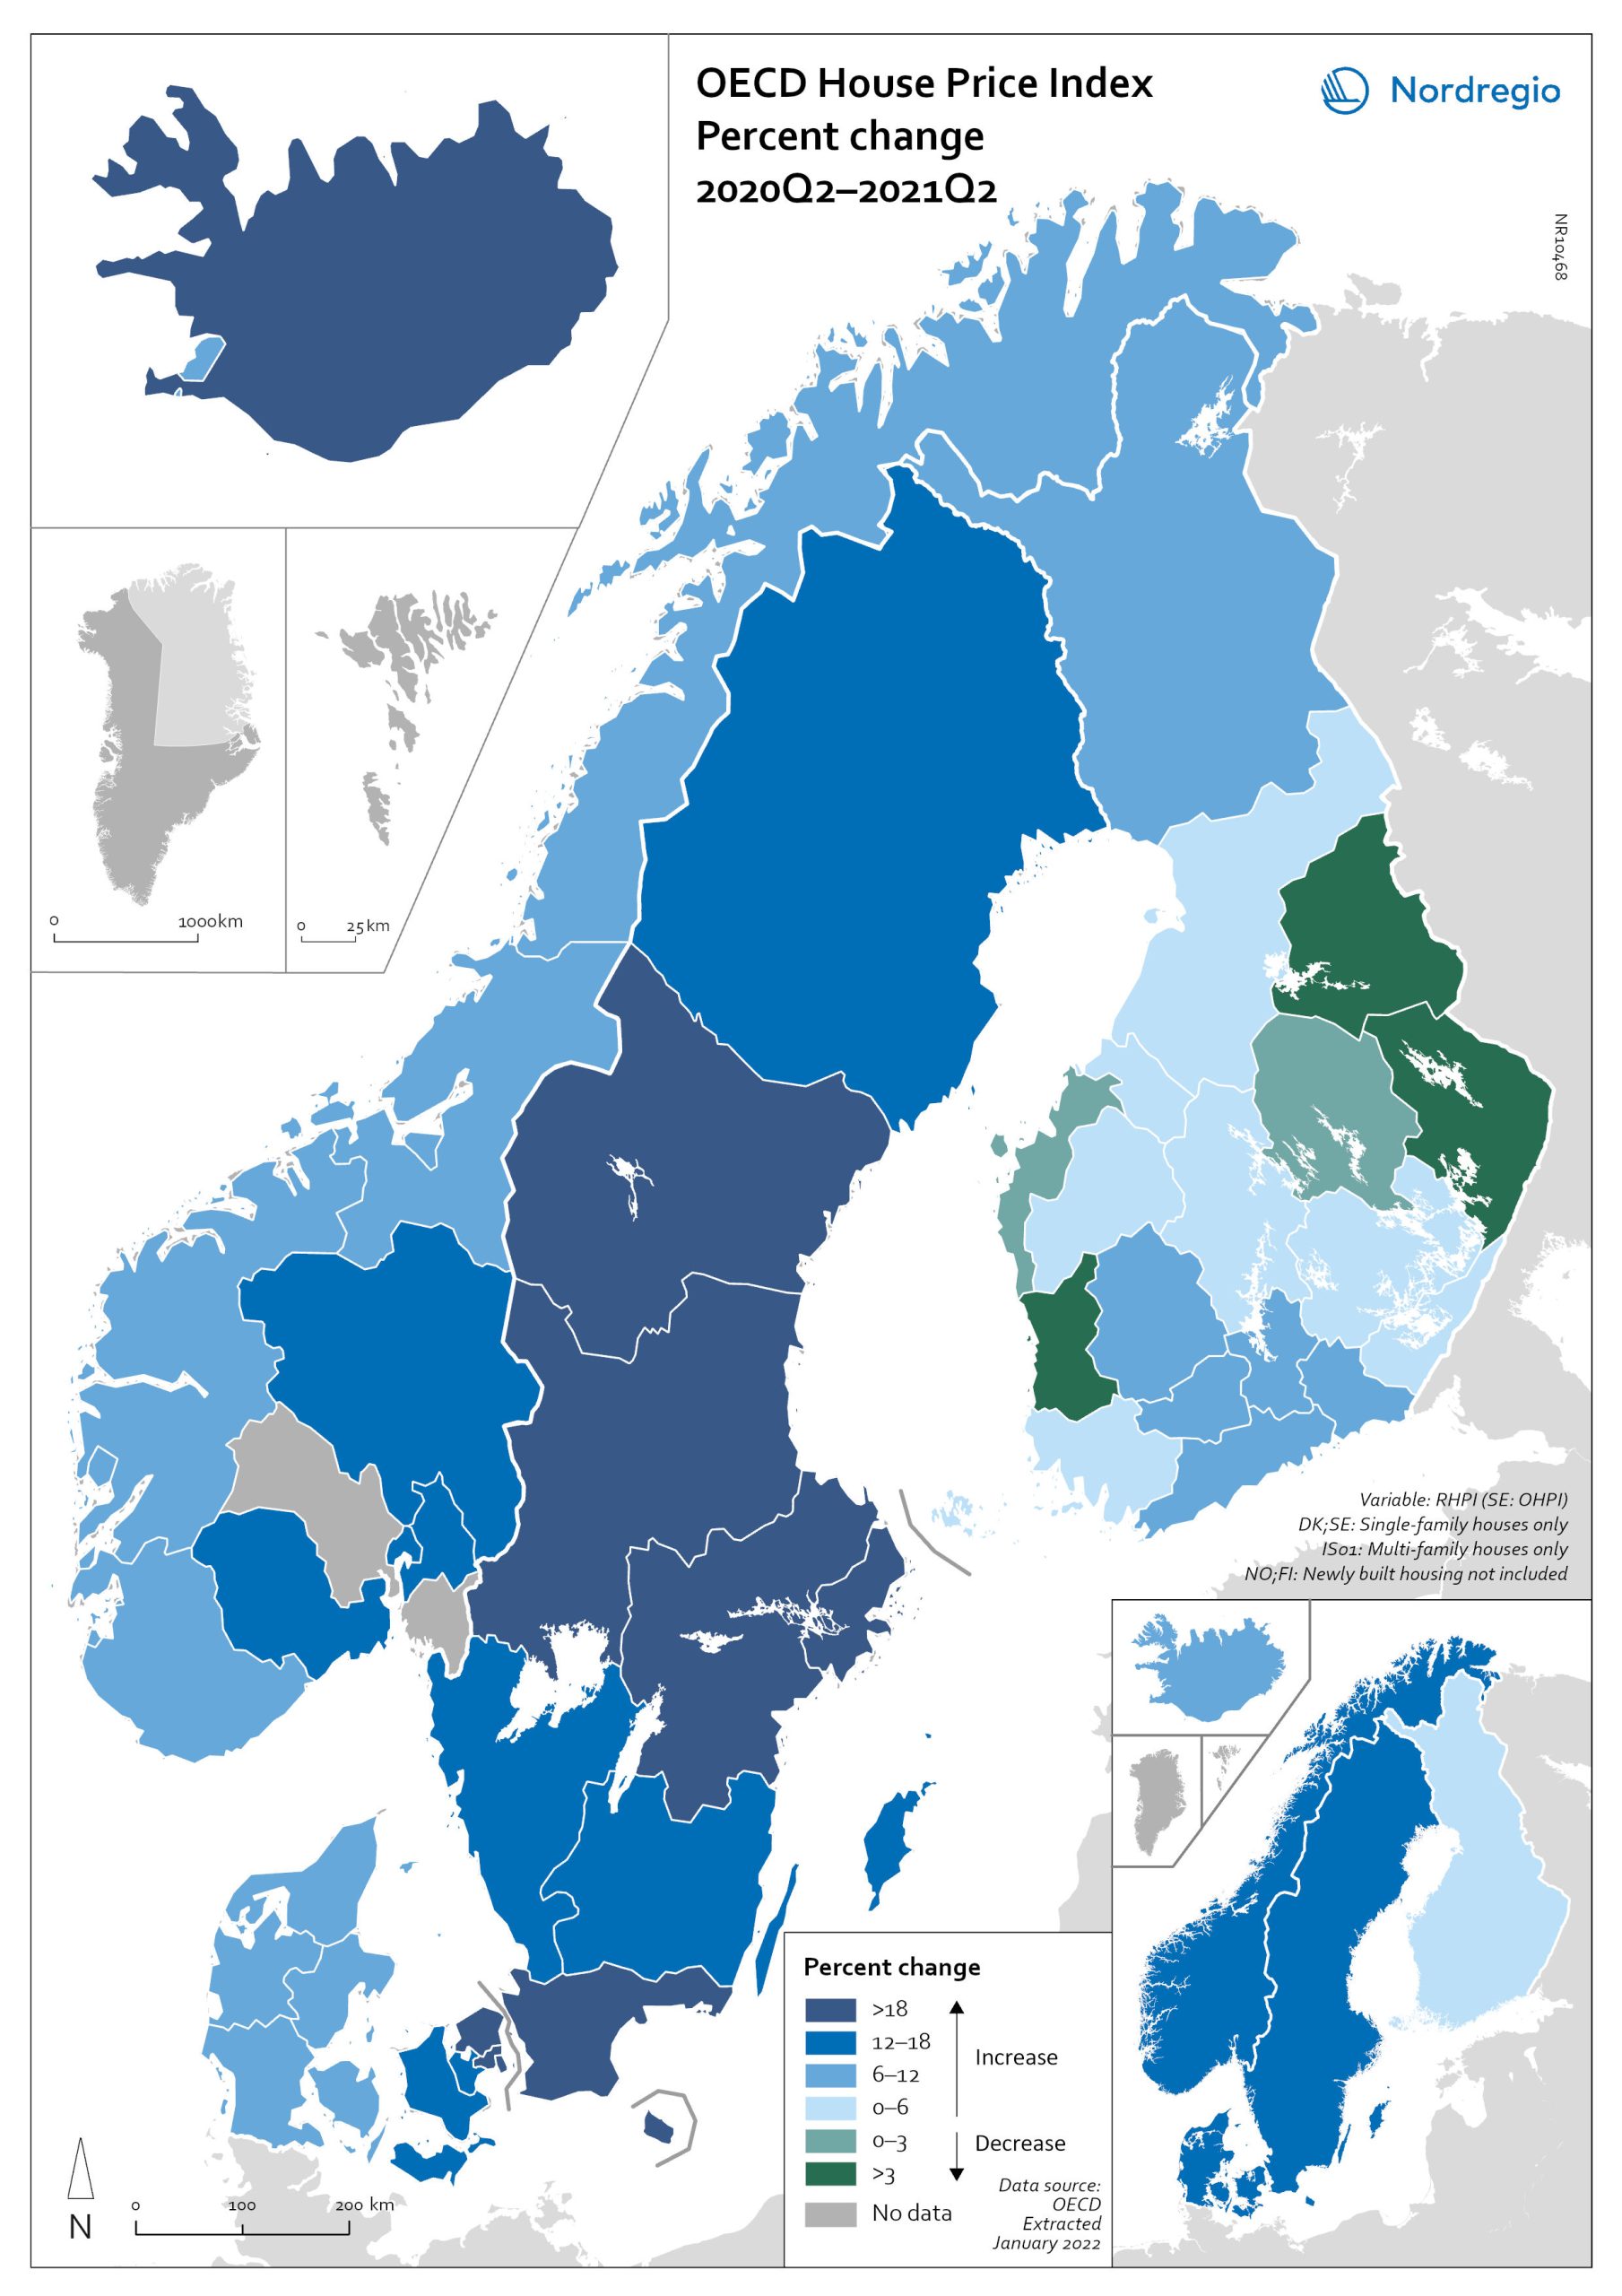
The map shows that the price development was not uniform within the countries. Iceland recorded the largest price increases overall, with the most marked price increases found outside of the capital region. All Swedish regions recorded increases above 20%, with the highest increases in the Stockholm and Malmö regions. All Norwegian regions showed price increases, though to a lesser extent than Swedish regions in most cases. In Denmark, Bornholm, Sjælland and the rural islands of Lolland and Falster recorded relatively high price increases, although many rural areas developed from low absolute prices in 2020. Finland was the only country where some regions saw property prices decrease. Moderate increases were still observed in some of the southern regions, where the major cities are located, and in the north.

