GIS AND CARTOGRAPHY
Maps
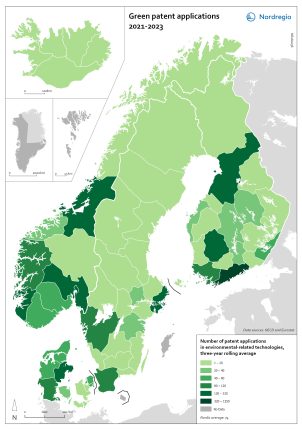
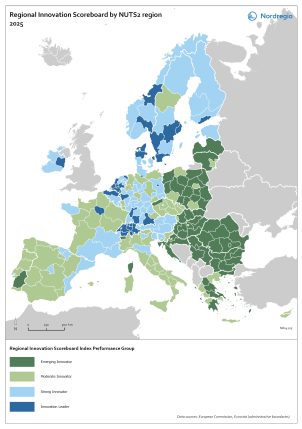
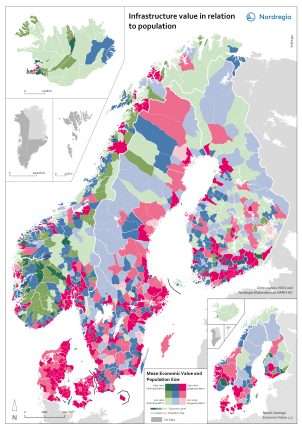
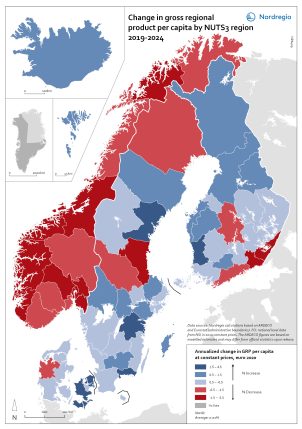
Explore Nordregio’s collection of maps and spatial analyses. Using statistical methods and geospatial tools, our maps reveal patterns and trends in regional development across the Nordic, Arctic and Baltic regions, supporting comparative studies and policy insights.