The map shows the type (positive or negative) and size of population change from 2010 to 2019 in all nordic municipalities.
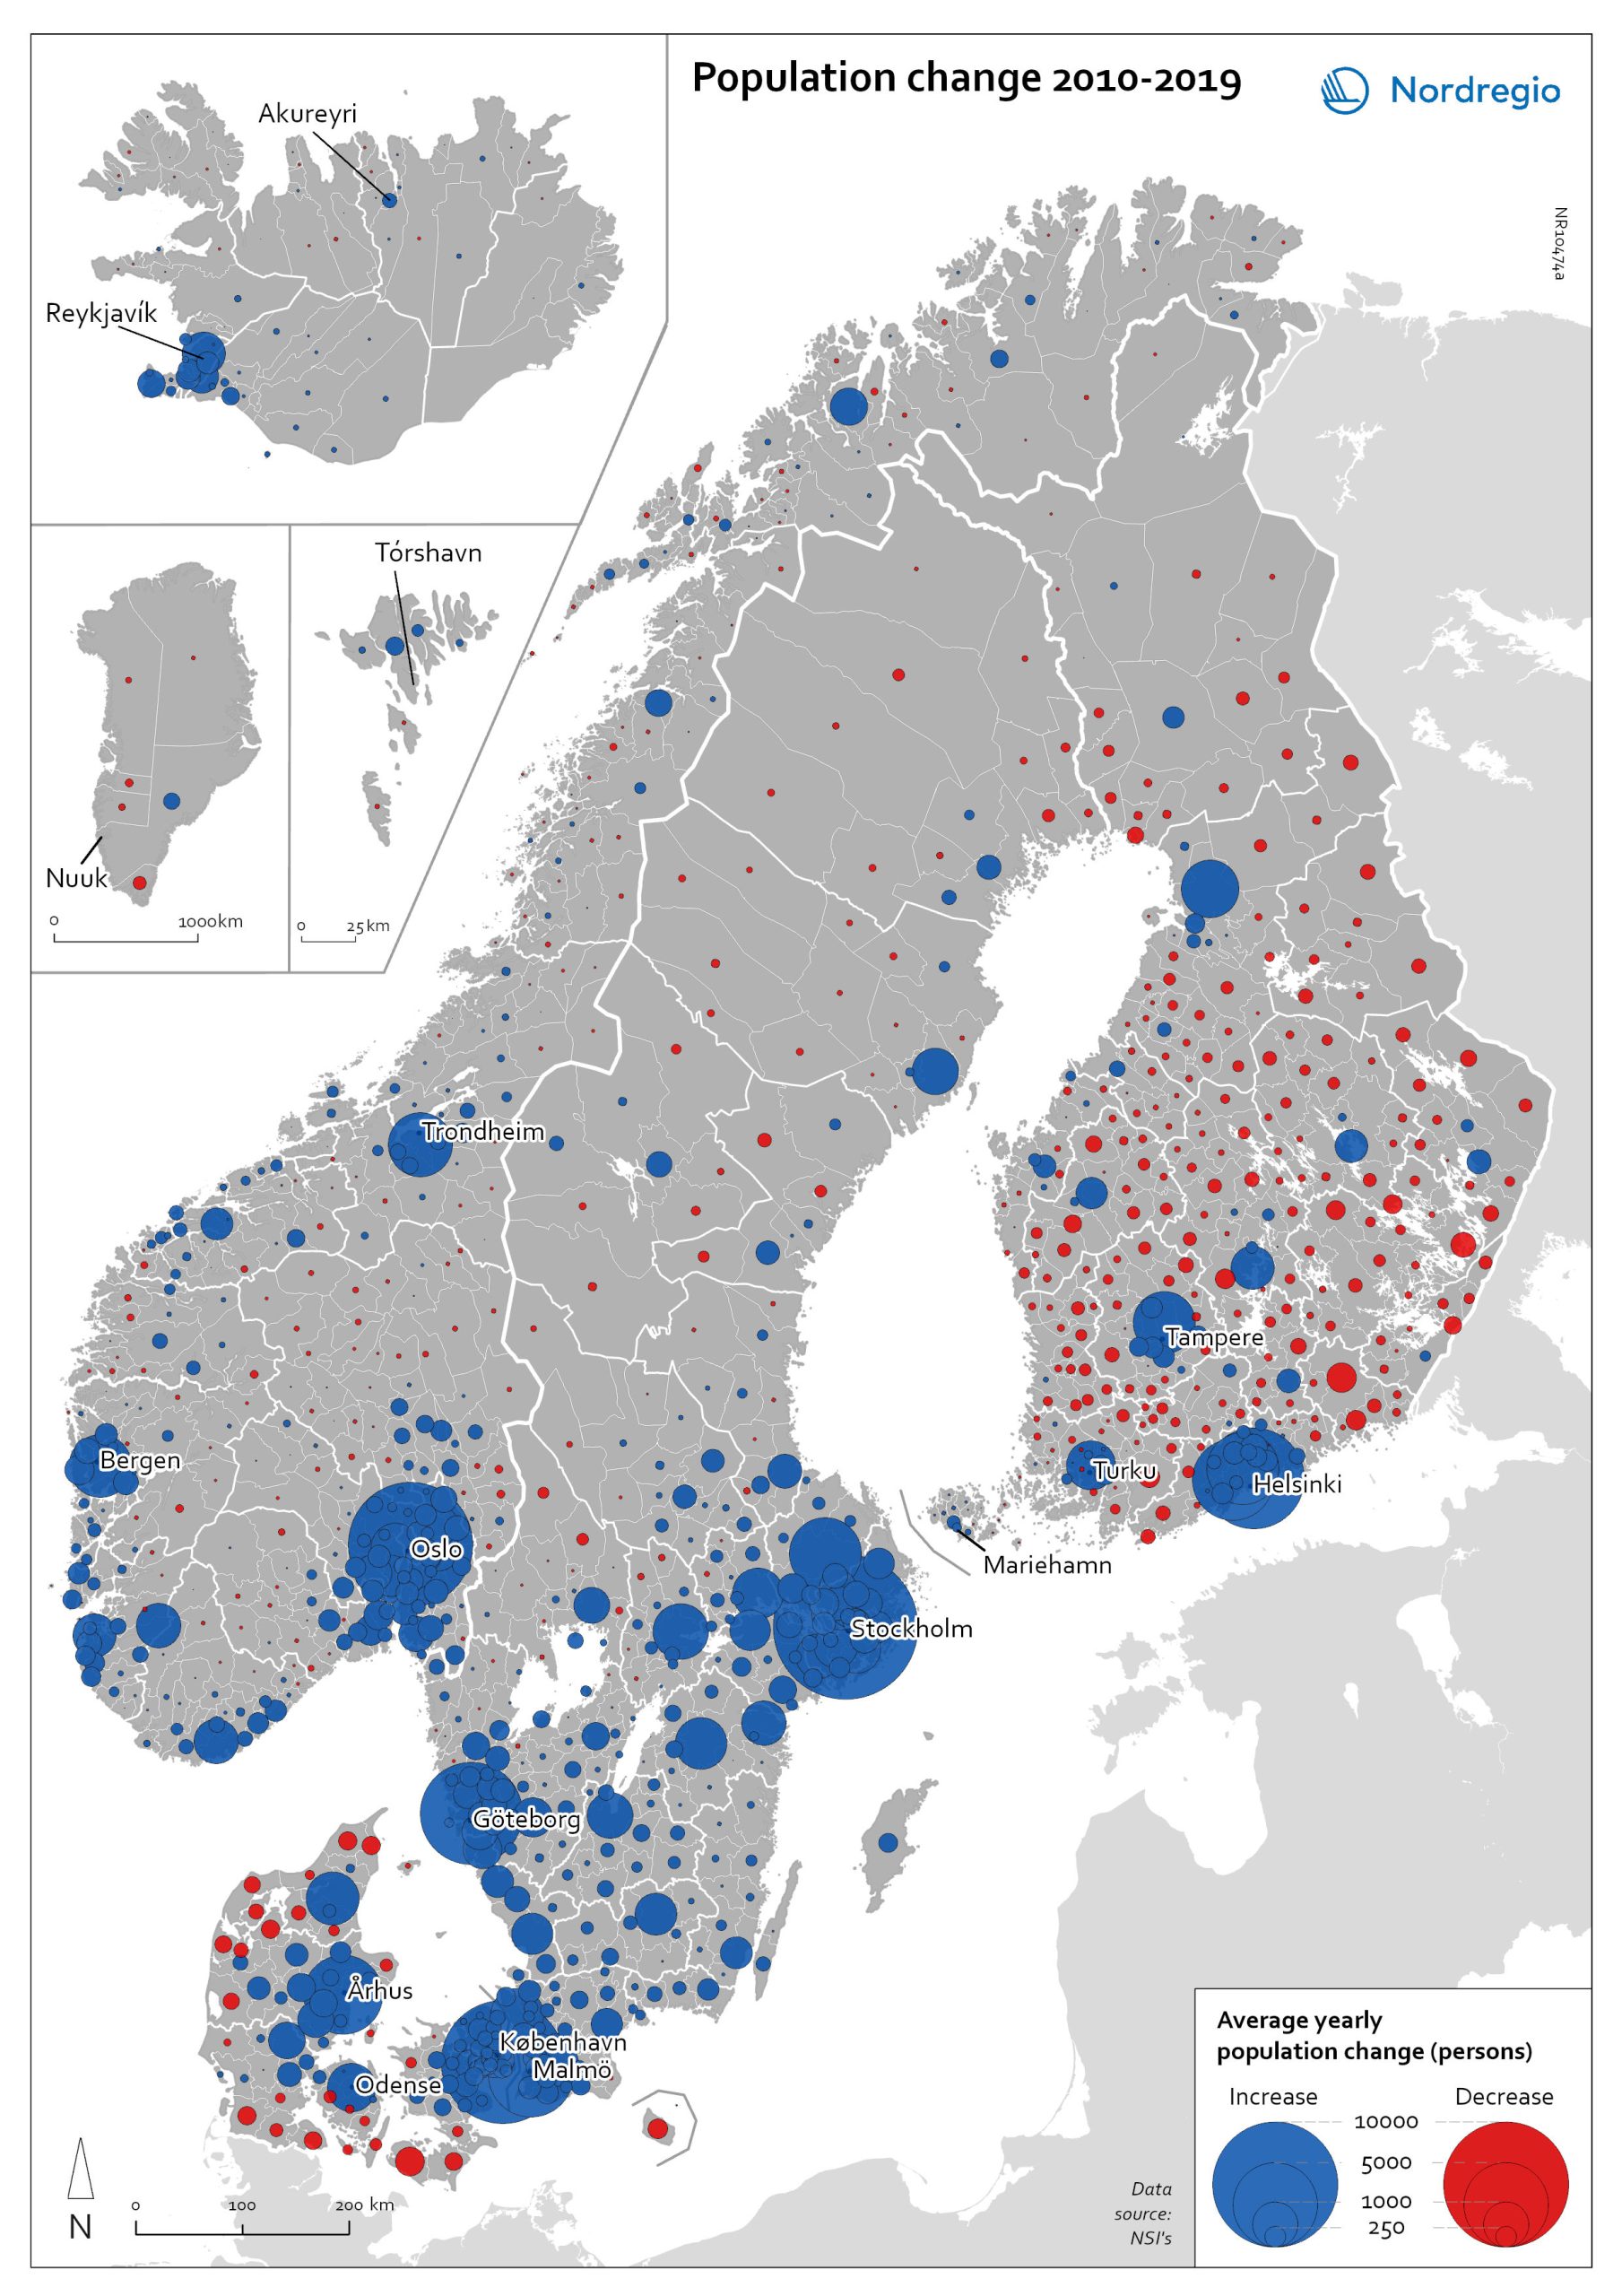
In Finland, Denmark, and Greenland there is a clear pattern of population growth in and around the larger cities and population decline in rural areas. Geographical and administrative differences mean that a much larger number of rural municipalities in Finland are dealing with population decline. Sweden experienced substantial population growth between 2010 and 2019, primarily due to high levels of international immigration. As a result, many rural areas also experienced population growth, particularly in the south of Sweden. However, in the more sparsely populated municipalities in the north of Sweden, the pattern is somewhat similar to that observed in Denmark and Finland, albeit with population decline in lower absolute numbers. Both Iceland and the Faroe Islands experienced substantial growth of their tourism industries within the period. This enabled some rural areas to maintain or even grow their populations. Norway exhibits more balanced population development in general, with a mix of population growth and decline in rural areas throughout the country.

