Nordregio maps recent population changes at the municipal and regional levels.
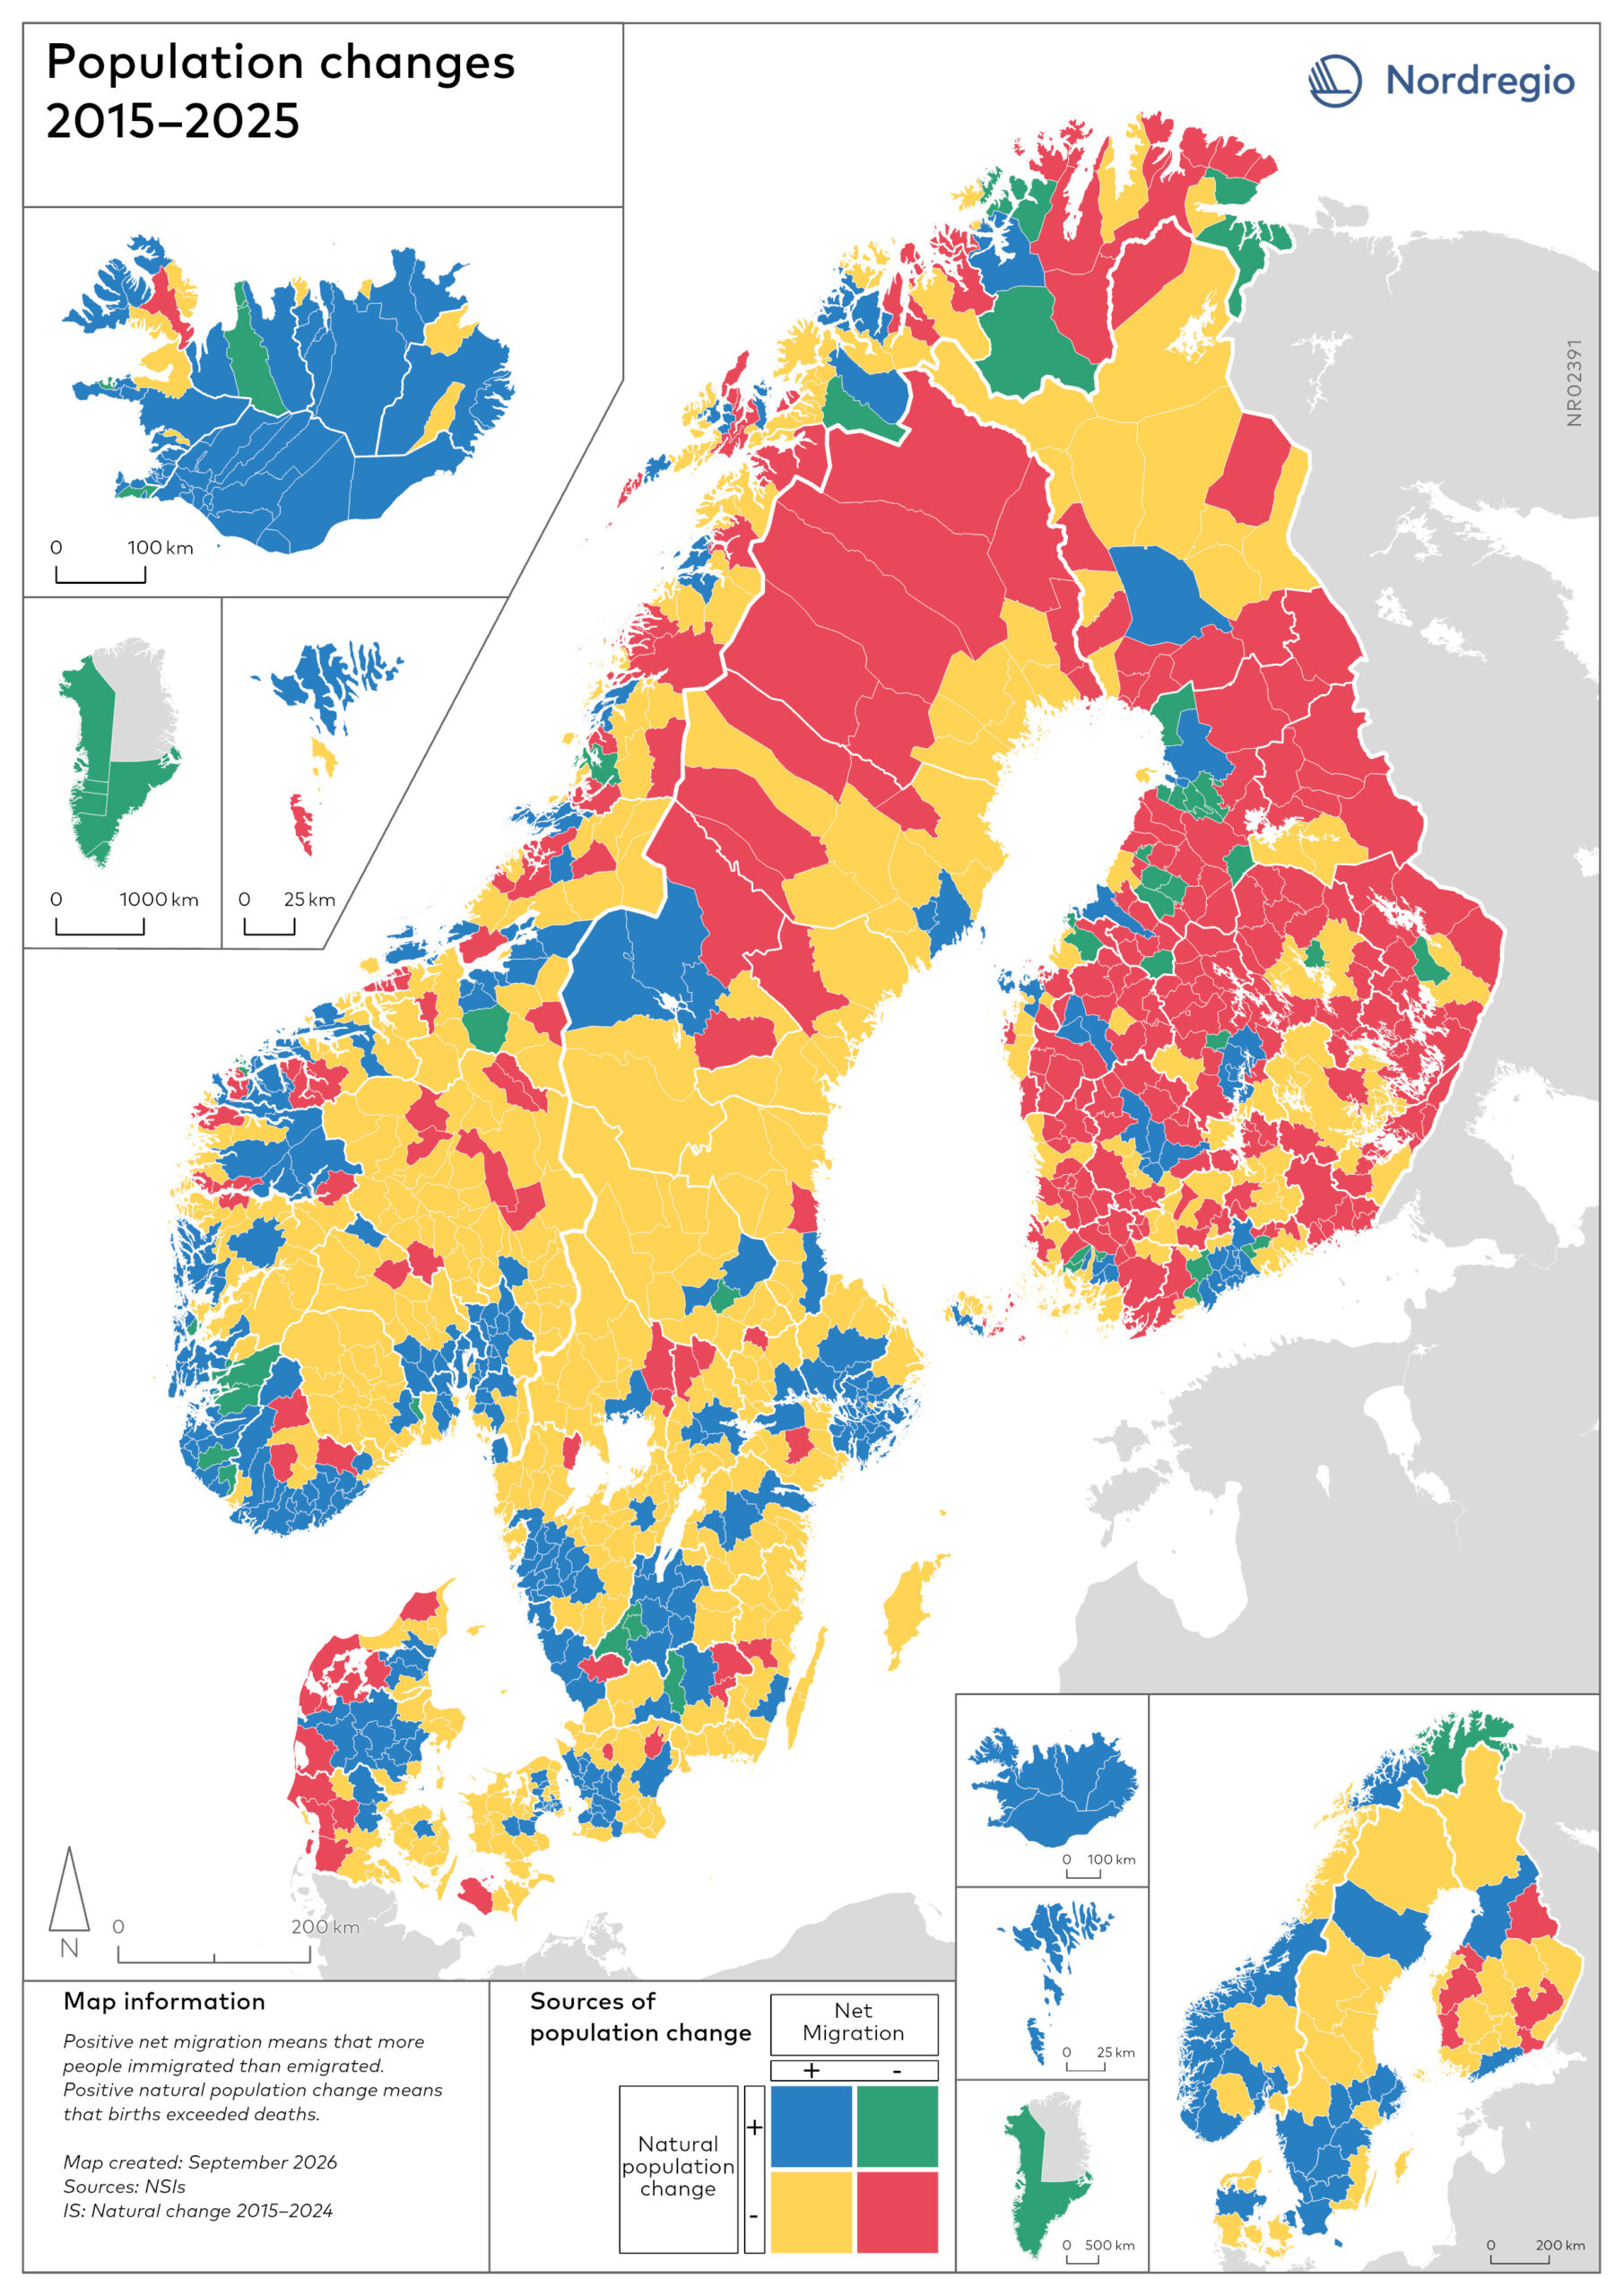
This map shows how population have changed during the years 2015–2025. Changes are presented by a positive or negative net migration, and by a positive or negative population change. A positive net migration means that more people have moved to the municipality than people have moved away from the municipality (+), while a negative net migration means that more people have moved out than moved in (-). Natural change is calculated by the number of births and deaths within each municipality (or region). A positive natural change means that more people were born than passed away, while a negative natural change means that deaths exceeded births. These combinations of changes are presented in four distinct colours.
The most common colour for a municipality is yellow, with 472 or 42%, meaning a combination of negative natural change and positive net migration. It is worth mentioning that net migration in this case includes international migration. International migration contributes to most of the municipalities (70%) having a positive net migration. 278 municipalities faced both a negative net migration and a negative natural change during the time period. 174 of them are located in Finland, highlighting the country’s demographic challenges. The combination of positive natural change and negative net migration is quite rare, with just 51 municipalities showing this change. This is shown in all of Greenland, at both levels. The only region with this type of change is Finnmark in northern Norway. Blue coloured municipalities tend to be located by larger cities, but not exclusively. Blue municipalities can be seen around Reykjavík, Bergen, Aarhus, Oslo, Copenhagen, Gothenburg, Stockholm, Tampere, and Helsinki.
