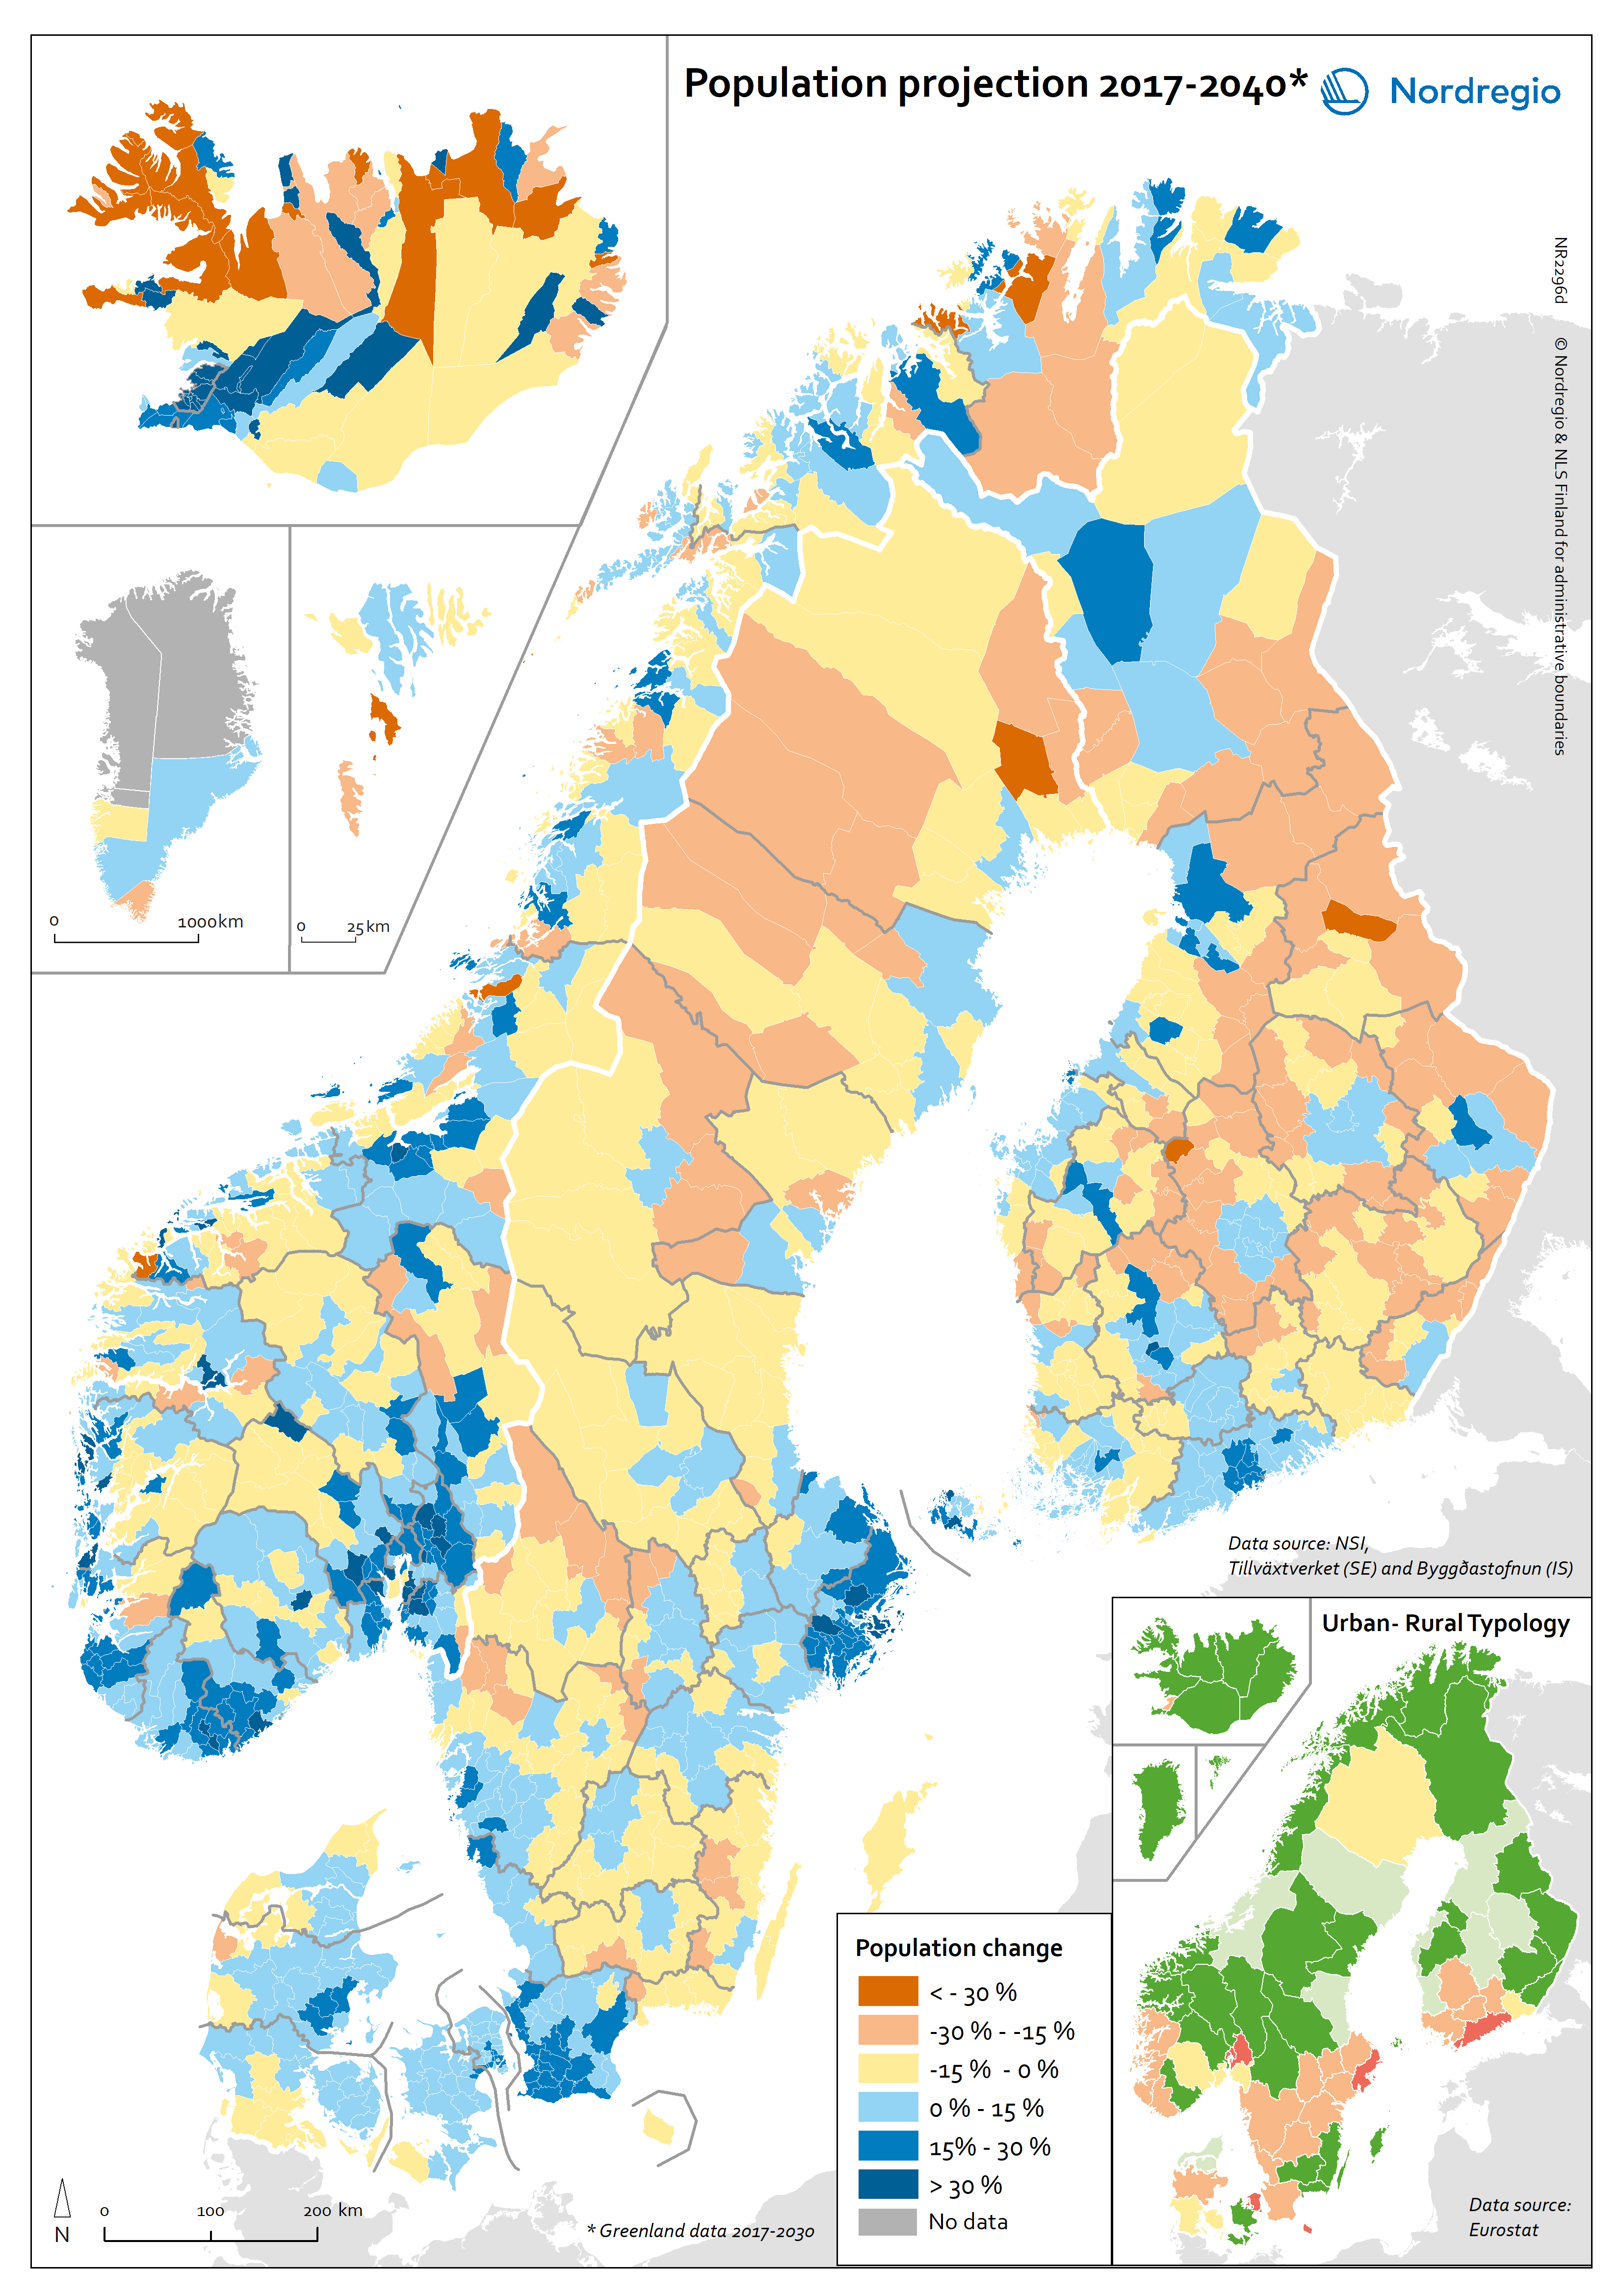
This map shows the expected population change in Nordic municipalities by looking at the change between 2017 and 2040.
The colours on the main map indicates the percentage of population change at municipal level between 2017 and 2040. Shades of red indicate a population decline, whereas shades of blue indicate a population increase. The colours on the regional map (bottom-right corner) indicates the type of region according to the Eurostat’s urban-rural typology (see: http://nordregio.org/maps/urban-rural-typology-of-nordic-regions/): shades of red indicate predominantly urban regions, yellow for intermediate regions and shades of green for predominantly rural regions.
In the two types of regions classified as predominantly rural (“light green” and „dark green“ regions), population growth largely remains concentrated in larger towns and their suburbs. This is particularly the case in Sweden and Finland. For instance, the regional capitals Östersund in Jämtland (SE) and Seinäjoki in South Ostrobothnia (FI) are expected to have larger populations in 2040 than today, while most other municipalities in these regions will decline. In Norway and Iceland, a somewhat more nuanced pattern applies. Here population growth is not only expected in regional capitals and other larger towns, but also in some smaller and more remote municipalities. In Denmark, finally, population growth is expected for large parts of the country until 2040, in more rural and urban areas alike. Population loss is only expected in some of the most remote municipalities at the Northern, Eastern and Southern borders of the country. While the population loss in rural regions is hence expected to continue across the Nordic Region, it appears to be more pronounced in some countries than in others. In the predominantly urban (“red”) regions, the opposite pattern applies: With very few exceptions, municipalities in these regions are expected to experience a growth in population numbers until 2040.