This map shows the general fertility rate at municipality level for the time period 2016-2018
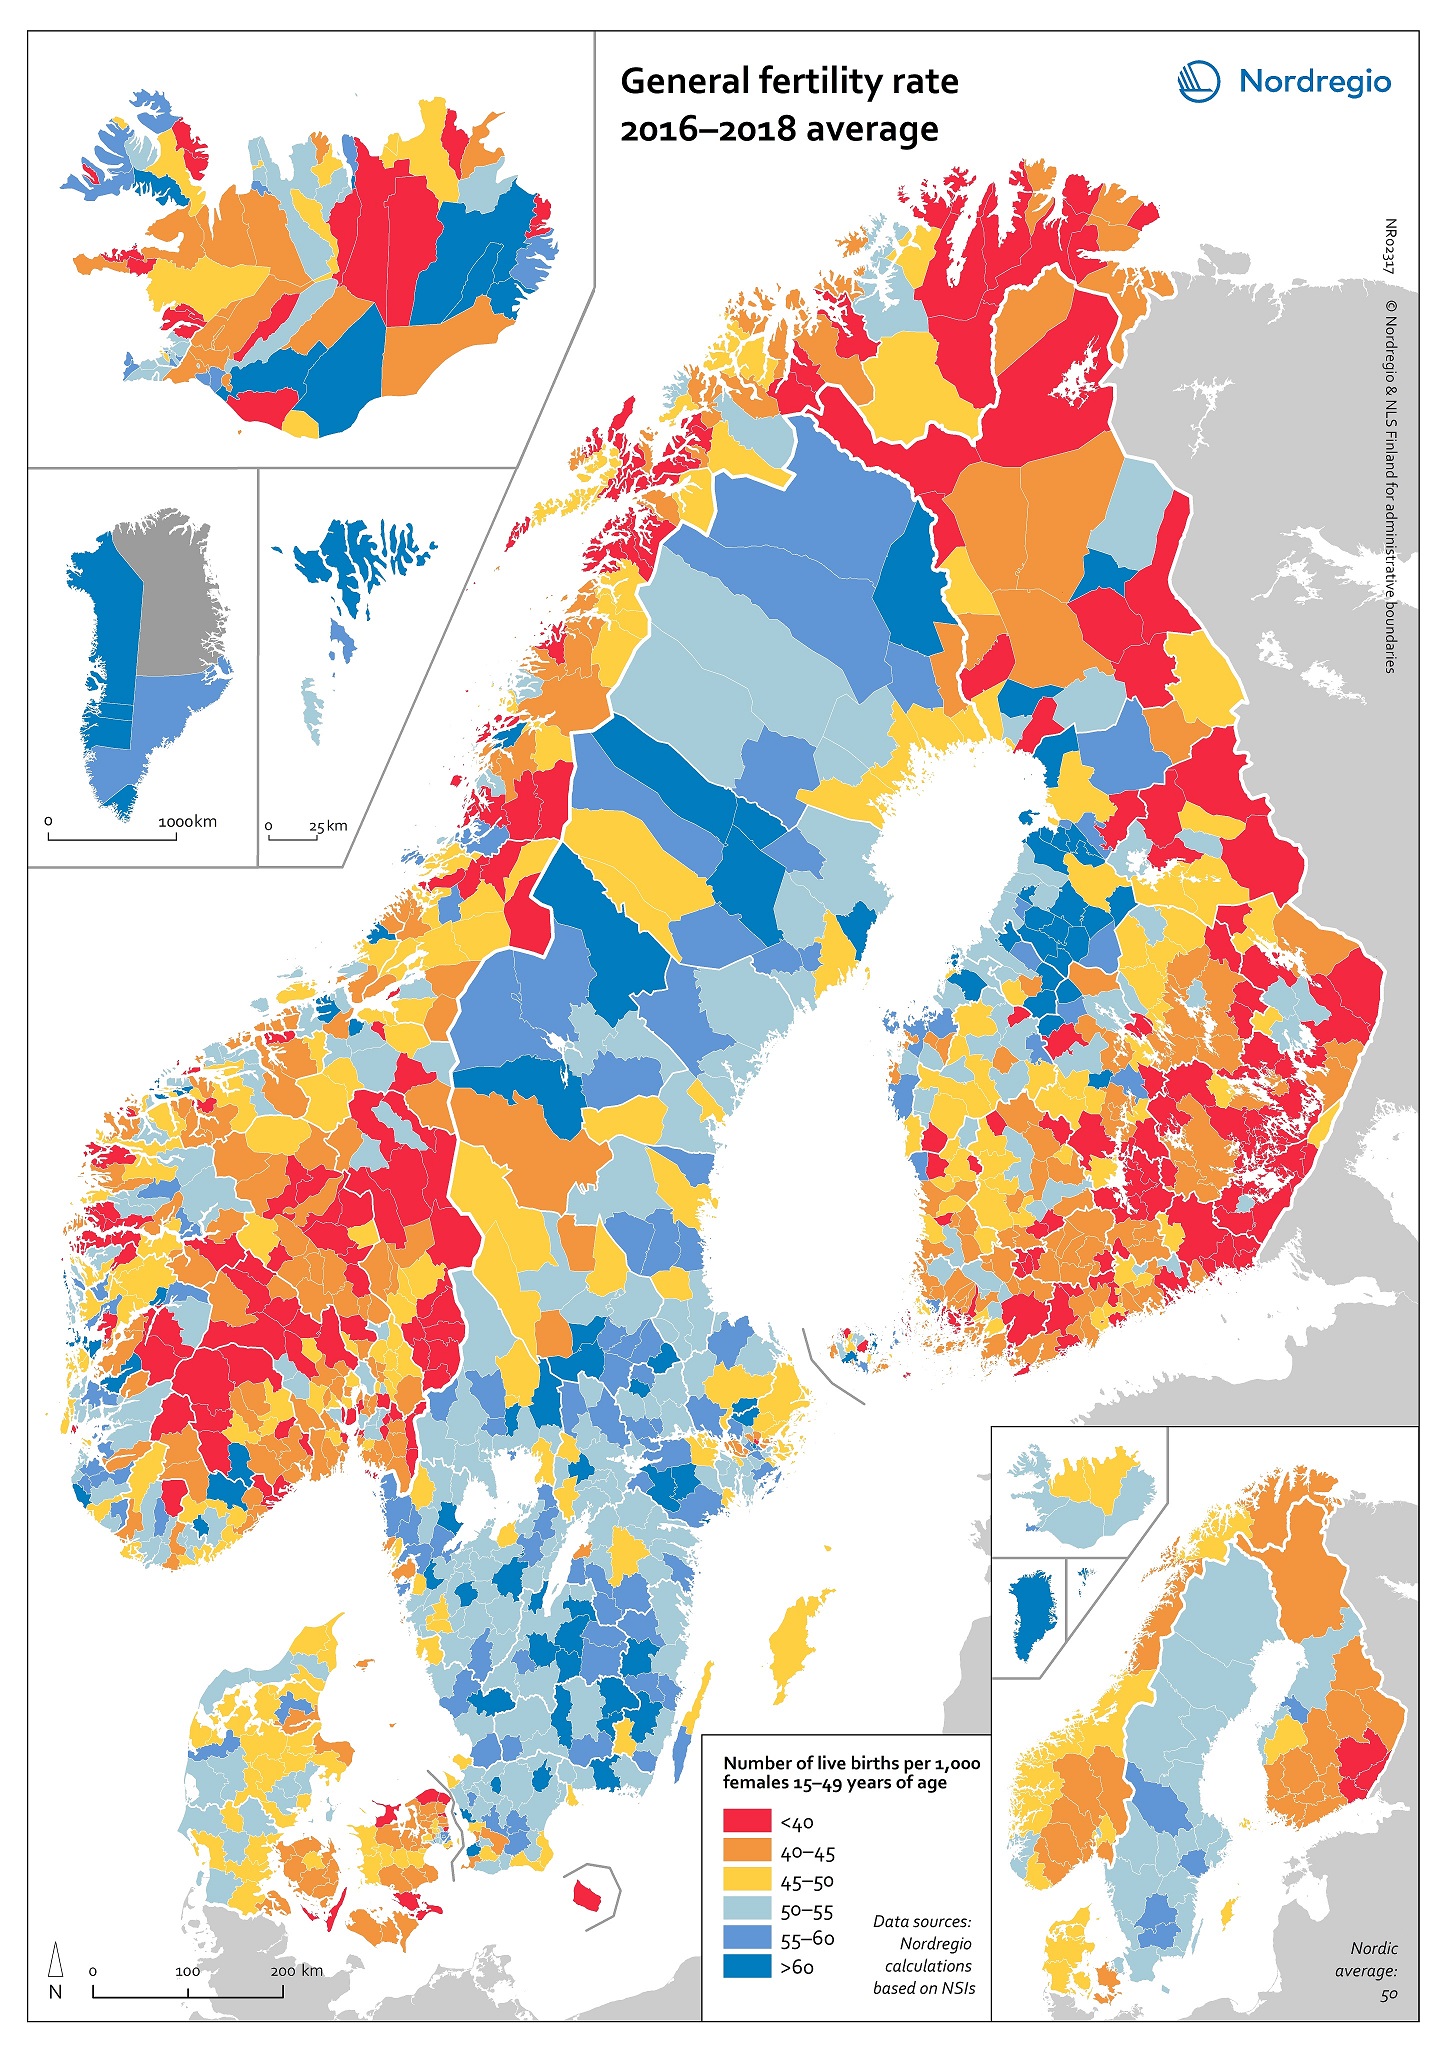
The general fertility rate measures the ratio of the number of live births to the number of women who are in their childbearing years during a given year. In order to balance temporal variations for smaller municipalities, the map is displaying a three-year-average. Red colour indicates lower fertility while blue colour indicates higher fertility.
The number of children that families have is influenced by a variety of political, economic and cultural factors. Over the past decade, there has been a decline in fertility in most Nordic countries, with quite a steep decline in Finland, Norway and Iceland. The map reflects these national differences in fertility but also show some internal regional variation. While most of Finnish municipalities have a general fertility rate below the Nordic average of 50 births, some parts of Keski-Pohjanmaa and Pohjois-Pohjanmaa have more than 60 births per woman in childbearing age.
Read the digital publication here.