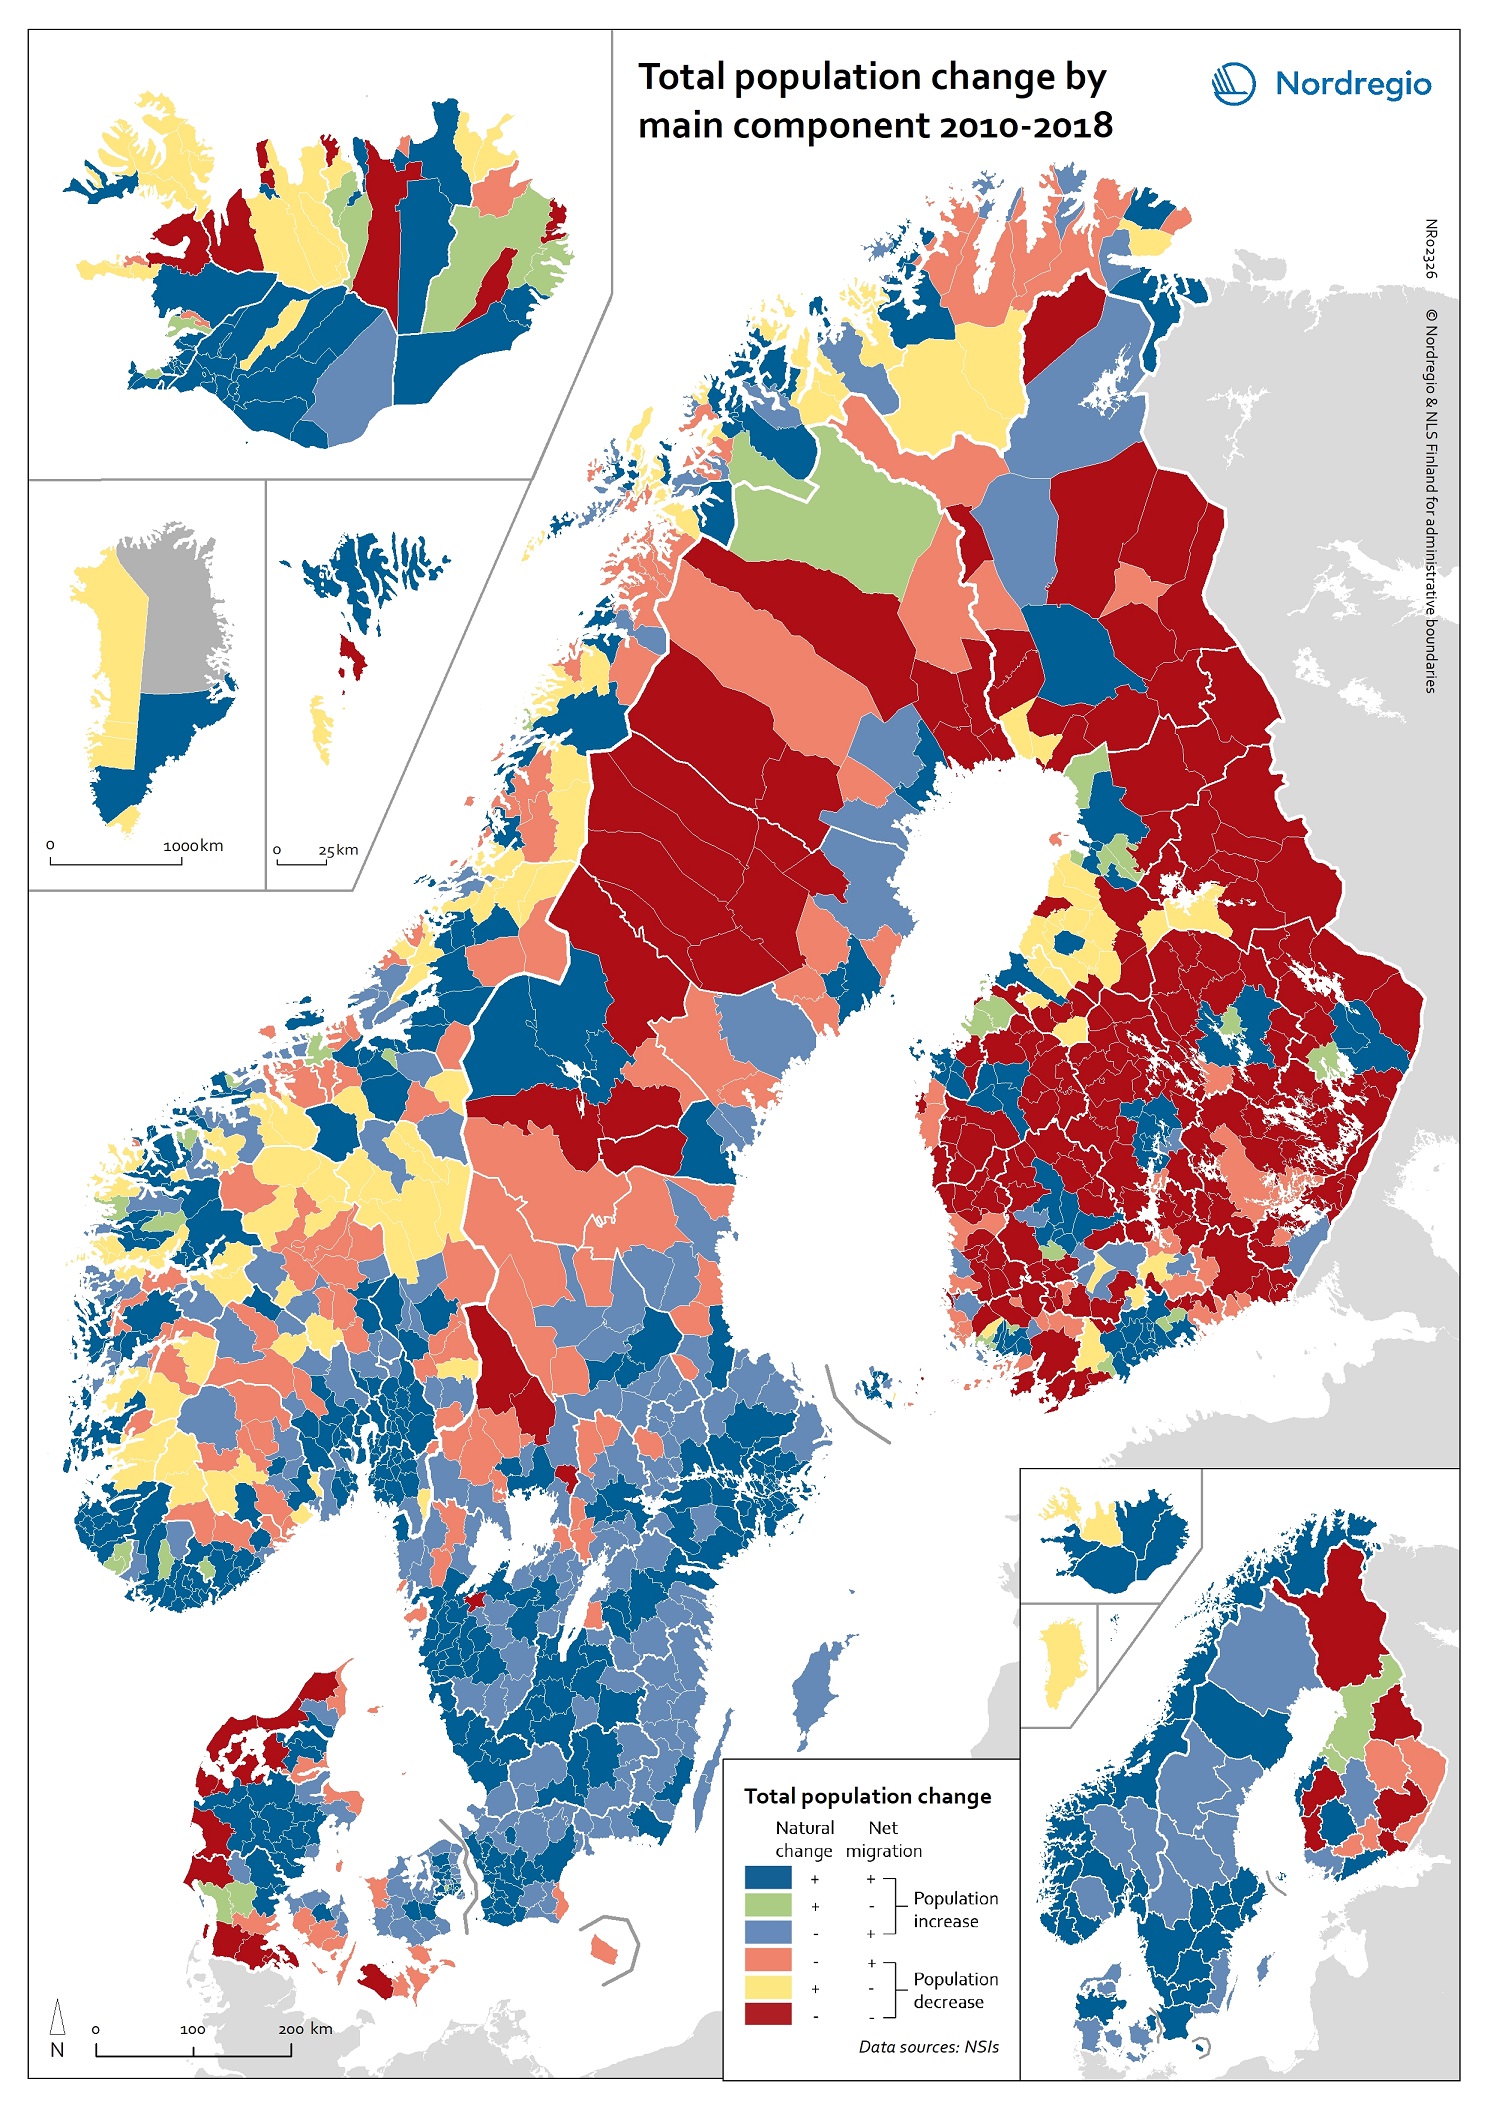
This map shows total population change by main component at the municipal and regional level in 2010-2018. The two components of population change are natural change and net migration.

As the map shows, all regions in Denmark, Norway and Sweden experienced population increase due to either a combination of natural increase and net migration or through net migration alone between 2010-2018. In Iceland, all regions experienced both positive natural increase and positive net migration, except for Vestfirðir and Norðurland vestra, which experienced population decline despite experiencing more births than deaths over the period. The regional picture in Finland was more varied, with population decline most pronounced in the east and the north.
At the municipal level, the highest overall population growth can be found mostly in the capital regions and bigger cities (e.g. Tampere and Turku in Finland), Central Jutland (Denmark), coastal areas of Norway, southern Iceland, southern Sweden, the northern municipalities of the Faroe Islands and Sermersooq Municipality (Greenland), which contains the capital of Nuuk. The highest overall population decline can be found mostly in the western and southern parts of Denmark, the majority of Finnish municipalities and most inland municipalities in northern Sweden. While the map shows a snapshot of population change for one decade, these trends of population increase in urban regions and municipalities and decline and ageing in periphery regions and municipalities have been underway for some time and are expected to continue into the foreseeable future.
Read the digital publication here.


