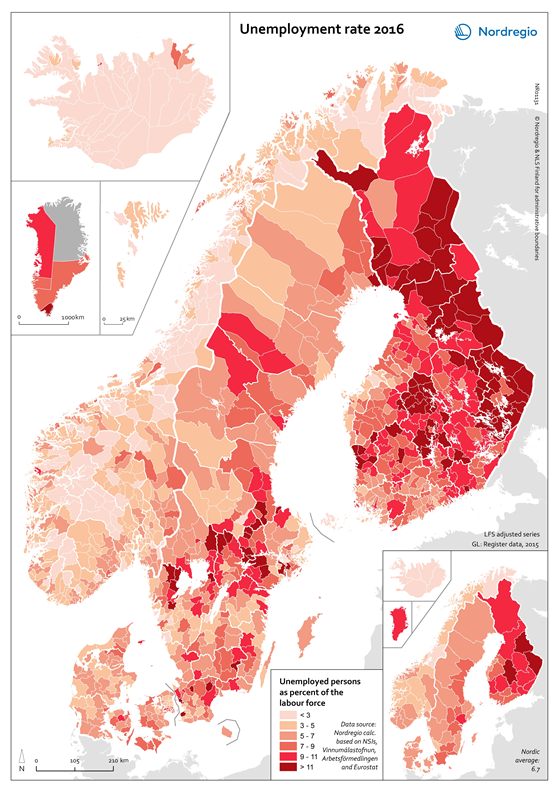
This map shows the unemployment rate for all municipalities in the Nordic Region, calculated as the total number of employed persons as a share of the working age population (15–64 years). The small map shows the unemployment rate for all Nordic regions.
The red tones indicate differences in unemployment rate between Nordic municipalities in 2016. The darker the red, the higher the unemployment rate.
The Nordic economies have recovered from the financial crisis and this is visible in their recorded unemployment rates. However, regional variation in the unemployment rate shows a striking east-west pattern, with the highest unemployment rates found in Eastern Finland and the lowest in Norway, the Faroe Islands and Iceland. Greenland is an exception to this pattern with high rates in all municipalities. The Finnish regions with the highest rates include Lappi (10.9%), Keski-Suomi (11.4%) and Kainuu (11.6%). High rates (above 13%) can also be found in some Swedish municipalities, for example, Södertälje, Fagersta, Norberg, Kungsör, Arboga, Åmål and Hällefors. The majority of these places are rust belt sites (old industrial towns which have been hurt by the loss of industry). Outside of Finland, Sweden and Greenland, Ishøj, in the Copenhagen Region, is the only municipality with an unemployment rate above 10%. The overall number of municipalities with an unemployment rate over 15% has however reduced since 2015.