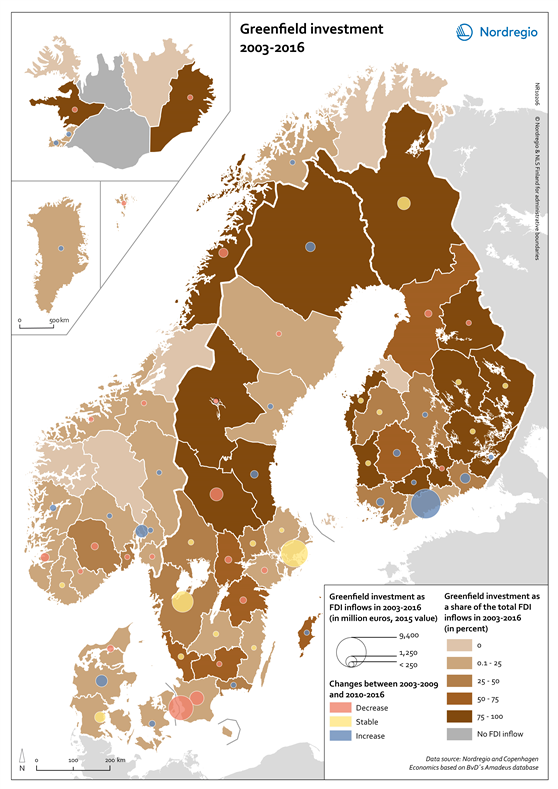
This map shows the value of greenfield investment as Foreign Direct Investment (FDI) inflow in million euros, and the greenfield investment as a share of the total FDI inflow in the Nordic regions between 2003 and 2016.
Greenfield investments and mergers and acquisitions are fundamentally different forms of FDI, implying that their effect on host economies differs substantially. Consensus does however exist around the notion that the short-term effect should be greater when a foreign company’s penetration occurs through greenfield investment.
The brown shading indicates different shares of greenfield investment related to the total FDI inflows in the regions between 2003 and 2016. The lighter the shade, the lower the share of the greenfield. The grey colour indicates regions with no FDI inflow data. The circles indicate the greenfield investment in million euros (2015 value) in the regions between 2003 and 2016. The larger the circle, the greater the value. The colour in the circles indicate changes in the greenfield investment between 2003 and 2016. The blue colour indicates an increase in deal value in the second period (>60% of the inflows of 2003–2016 took place in 2010–2016), yellow indicates a stable value in inflows between the two periods (40–60% of the inflows of 2003– 2016 took place in 2010–2016), while red indicates a decrease over time between the two periods (<40% of the inflows of 2003–2016 took place in 2010–2016).
Examined by regions with the largest share of greenfield investment during the period 2003–2016, the administrative regions of Helsinki (EUR 9,402m), Stockholm (EUR 7,896m) and Copenhagen (EUR 6,601m) emerge as Nordic leaders in attracting this form of foreign investment. Due to their innovation-based economies and booming start-up scenes, both Västra Götaland and Skåne (Sweden) have also performed exceptionally well in attracting greenfield investment securing deal value totals of EUR 4,809m and EUR 2,175m respectively. Similarly, some peripheral and rural regions in Denmark, Finland and Sweden have also attracted a substantial amount of greenfield investment (above EUR 1,000m in deal value terms) namely Dalarna (EUR 1,815m), Lappi (EUR 1,799m), Midtjylland (EUR 1,532m), Syddanmark (EUR 1,340m), Kymenlaakso (EUR 1,102m) and Norrbotten (EUR 1,010m). The dominance of greenfield capital in these regions is partially explained by their regional industrial structures and easy access to raw materials as well as by the recent transformations in traditional, resource-based industries which has opened a world of new possibilities for foreign investors.
The share of greenfield investment in total FDI inflows has varied between zero and 100% in the Nordic regions over the period 2003–2016. Regions such as Oppland (Norway), Åland and Vestfirðir (Iceland) did not attract any greenfield investment during the period 2003–2016. In contrast, in Etelä-Karjala (100%), Satakunta (99.6%) and Österbotten (99.2%) the majority of FDI takes place through greenfield investments rather than through M&A activity. In general, the largest share of greenfield investments is concentrated in the Nordic peripheral regions. In the period 2003–2009 greenfield investments completely dominated the FDI scene (100%) in some regions including Österbotten, Satakunta, Etelä-Savo (Finland), Vesturland and Austurland (Iceland) and Jämtland (Sweden). The picture changed somewhat in the period 2010–2016 (fewer regions with 100%) either due to increased M&A inflow or reduced (or even absent) FDI activity.