HomeMapsNordic Electricity Production Patterns in 2013
Total Electricity production by production type and per inhabitant in 2013
Map Facts
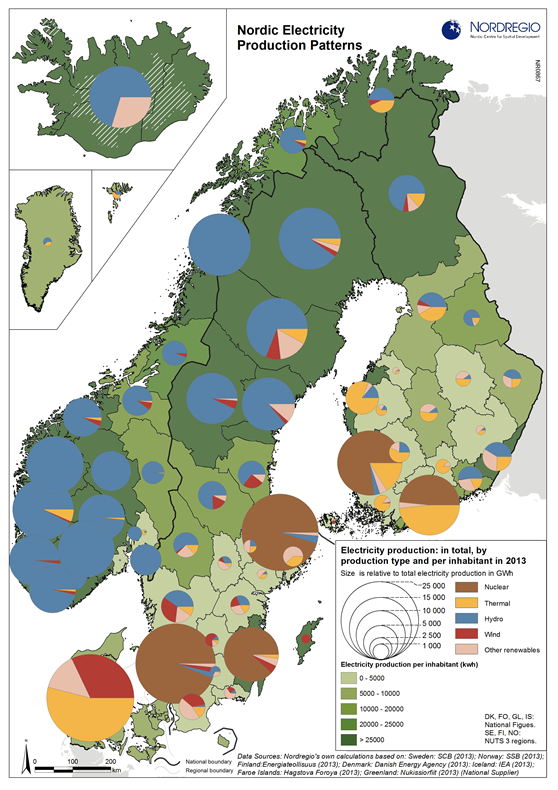
The map shows the spatial distribution of Nordic energy production per capita, by volume and by source type. A number of issues and patterns are evident. First and foremost, we see the high amount of electricity being produced for the five nuclear facilities in the Nordic Region. Second, a substantial volume of hydro-electricity is produced in southern Norway, throughout Iceland, Northern Sweden and Northern Finland. As a result, over half of Nordic electricity is produced from hydropower. There are some impressive results in terms of the production of wind power at the regional level. Regional wind power production has been strengthened in the past three years throughout much of Denmark, Sweden, and to a lesser extent in Norway and Finland.
Data source
Nordregio’s own calculations based on: Sweden: SCB (2013); Norway: SSB (2013); Finland: Energiateollisuus (2013); Denmark: Danish Energy Agency (2013): Iceland: IEA (2013); Faroe Islands: Hagstova Foroya (2013); Greenland: Nukissiorfiit (2013) (National Supplier)
Published 16 February 2016
Terms of use
All images are the property of Nordregio. They may be freely used as long as the logo of Nordregio is clearly visible and the source is cited accordingly. Please give also the cartographer/designer/author credit and give full recognition to the data sources if named in the graphic.