Total population change in European regions 2000-2013
HomeMapsTotal population change in European regions 2000-2013
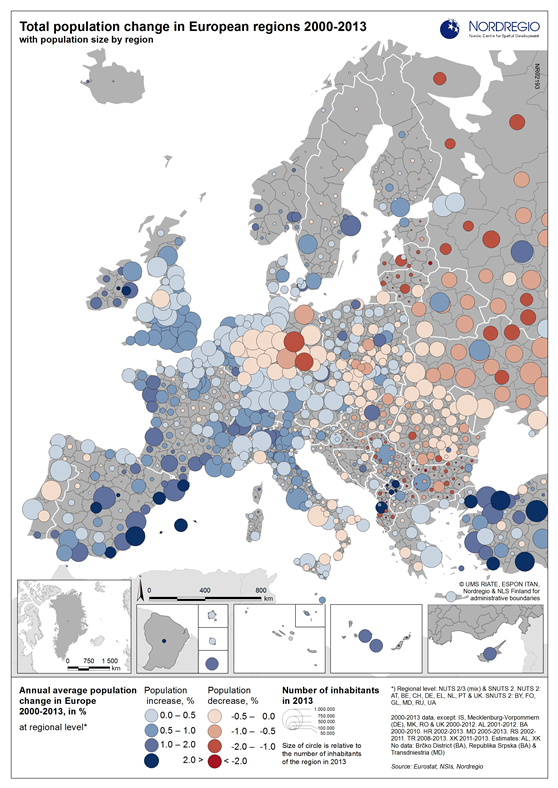
with population size by region
Map Facts
The map displays the long-term, annual average population change in Europe’s regions between years 2000 and 2013. Furthermore, the map shows the population size of each region.
In the Nordic countries, the largest city regions are also those which have seen a positive population change, while many smaller regions experienced a negative change. Western Europe is largely characterised by population increase, but exceptions exist, such as some of Eastern Germany, parts of Portugal and Southern Italy.
The populated regions on Spain’s Mediterranean coast and Western Turkey witnessed striking population increases during these years.
In Eastern Europe, the capitals and certain major metropolitan areas stand out with positive population change. In some particular cases, such as around Romania’s capital, it’s Ilfov, the region which borders the actual capital region Bucharest, which has the only positive change in the area.
Map ID: 02193
Designer/Cartographer
Linus Rispling
Data source
Eurostat, NSIs, Nordregio
Published 25 February 2015
Terms of use
All images are the property of Nordregio. They may be freely used as long as the logo of Nordregio is clearly visible and the source is cited accordingly. Please give also the cartographer/designer/author credit and give full recognition to the data sources if named in the graphic.