The map presents a typology of internal net migration in regions by considering average annual internal net migration in 2020-2021 alongside the same figure for 2018-2019.
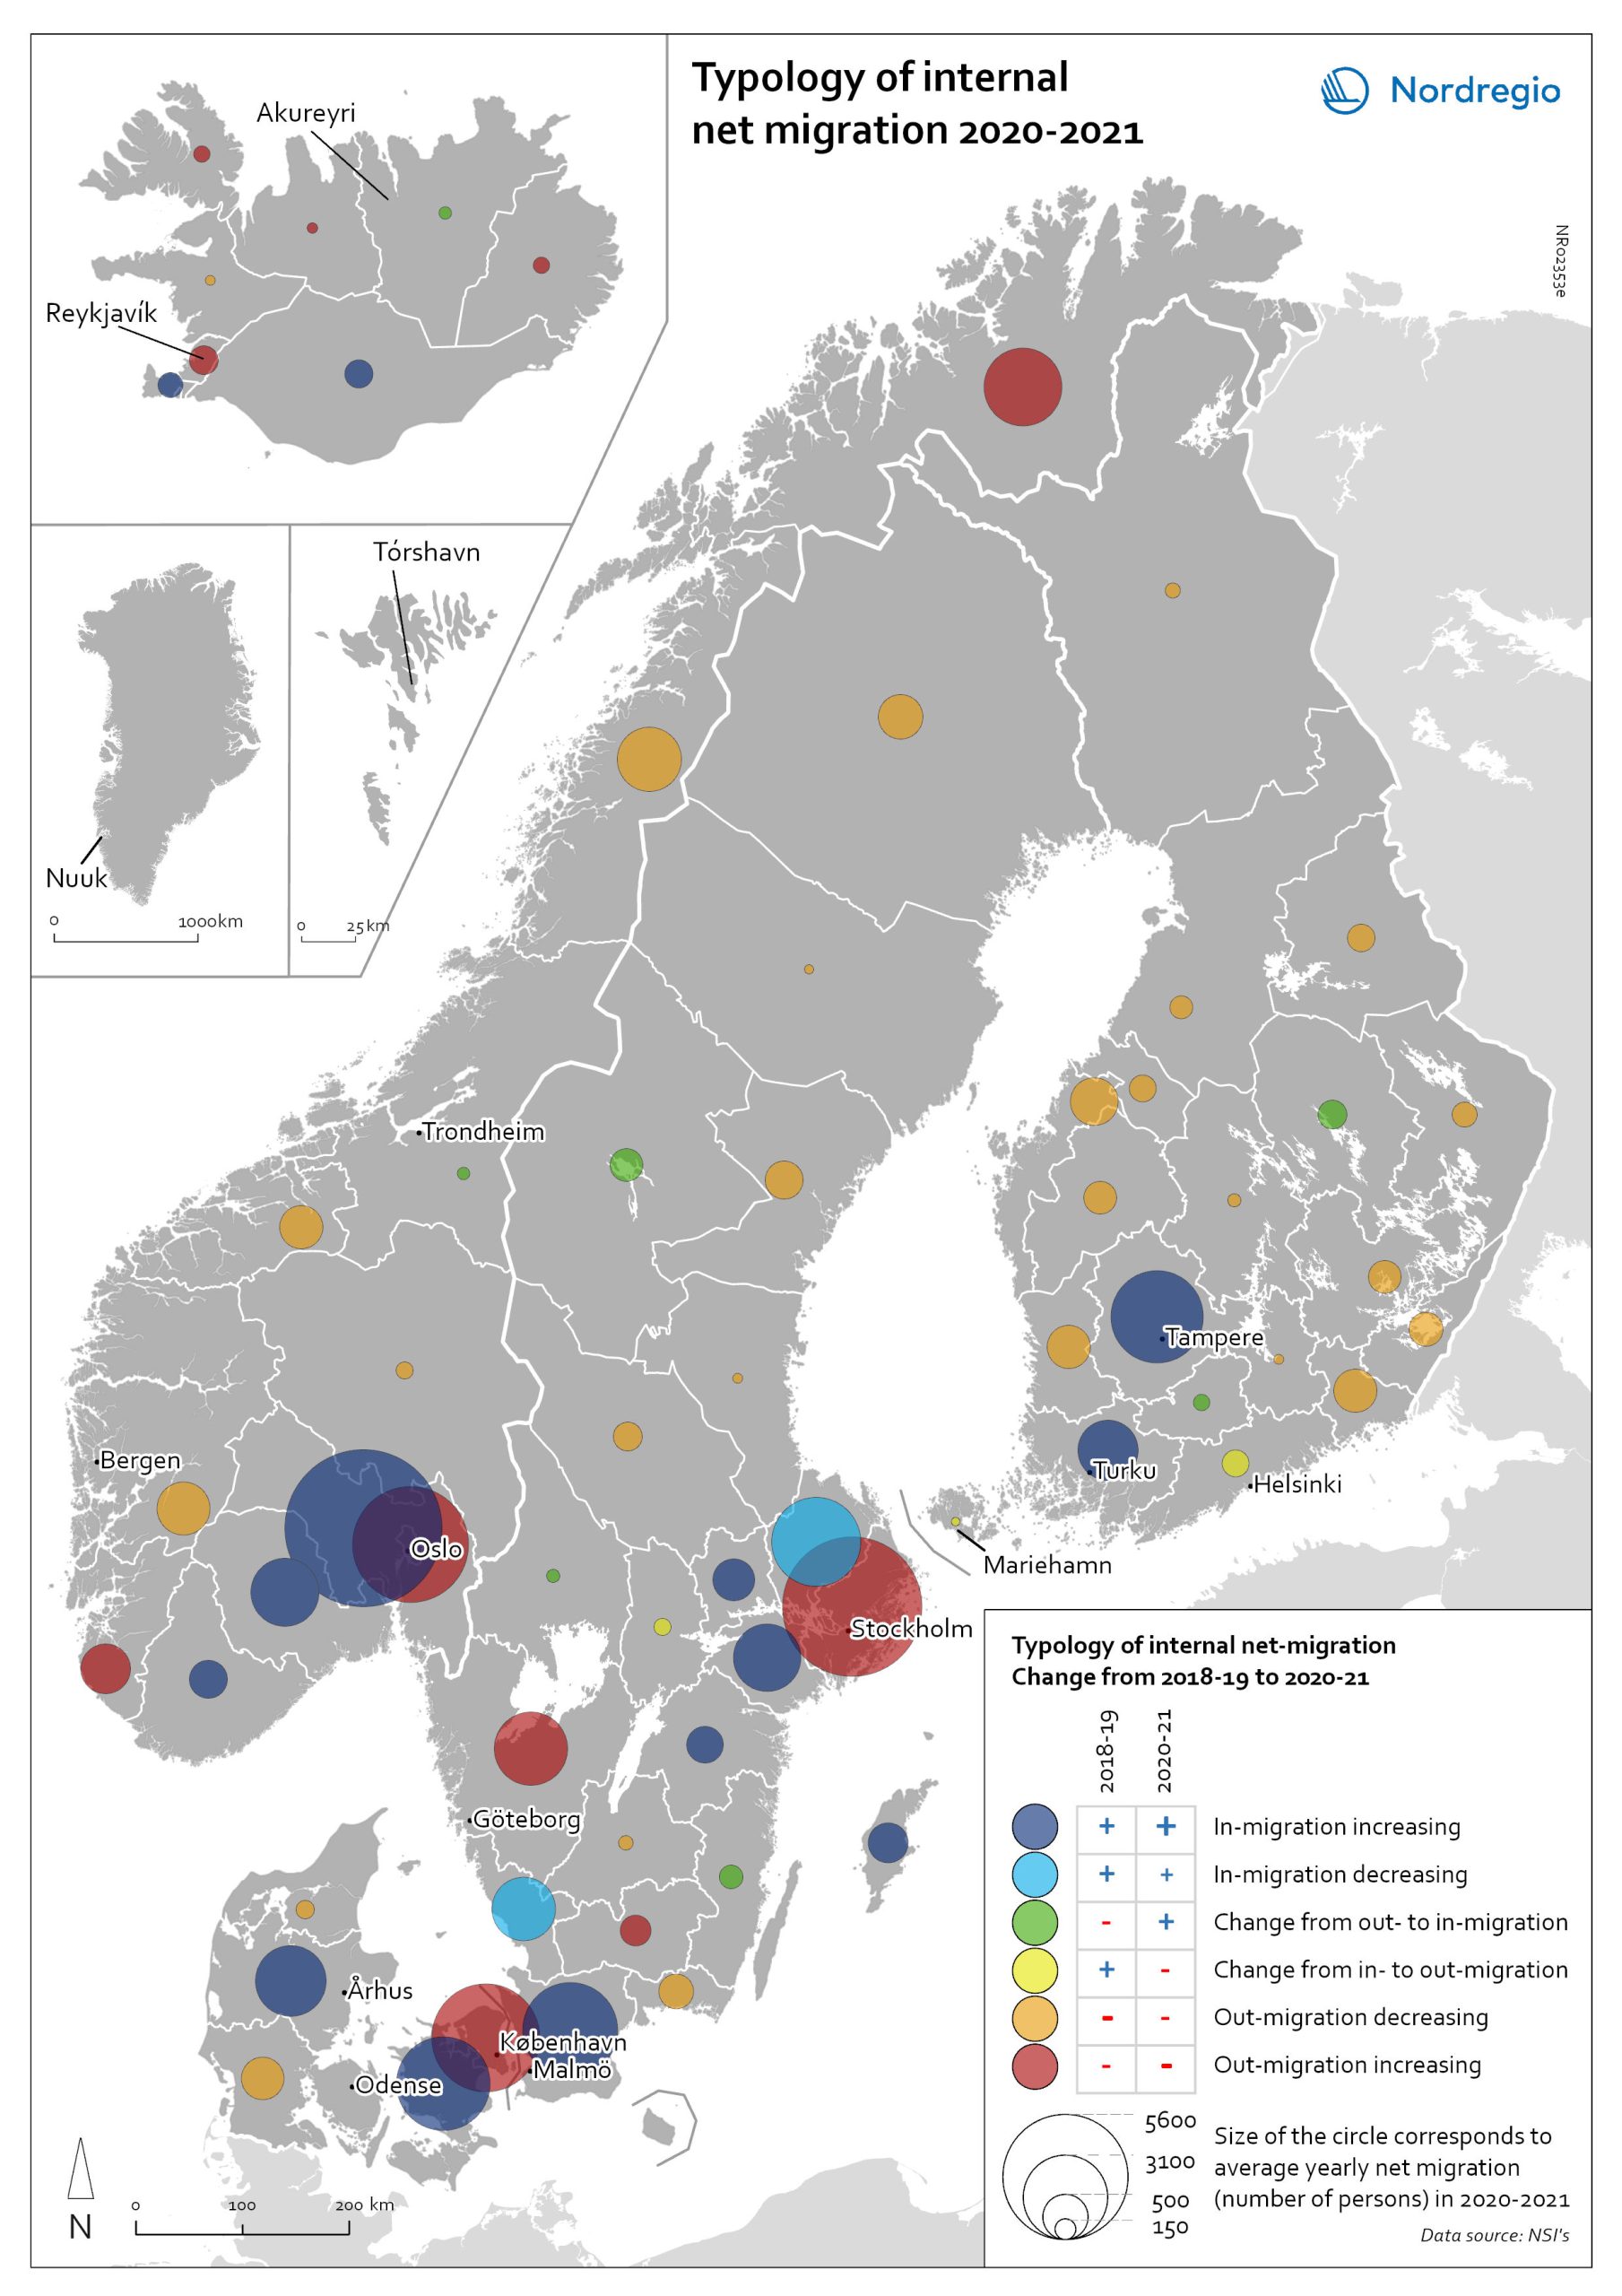
The colours on the map correspond to six possible migration trajectories:
- Dark blue: Internal net in migration as an acceleration of an existing trend (net in-migration in 2020-2021 + increase compared to 2018-2019)
- Light blue: Internal net in migration but at a slower rate than previously (net in-migration in 2020-2021 + decrease compared to 2018-2019)
- Green: Internal net in migration as a new trend (net in-migration in 2020-2021 + change from net out-migration compared to 2018-2019)
- Yellow: Internal net out migration as a new trend (net out-migration in 2020-2021 + change from net in-migration compared to 2018-2019)
- Orange: Internal net out migration but at a slower rate than previously (net out-migration in 2020-2021 + decrease compared to 2018-2019)
- Red: Internal net out migration as a continuation of an existing trend (net out-migration in 2020-2021 + increase compared to 2018-2019)
