The data excludes emissions from land use, land use change or forestry (LULUCF). The regional data has been adjusted to UNFCCC national data. The data for Denmark, Iceland and Greenland is on national level. It should be noted that displaying emissions on a territorial basis may be skewed due to the inter-regional dynamics of energy processes, natural resource distributions and concentrations of industrial activities.
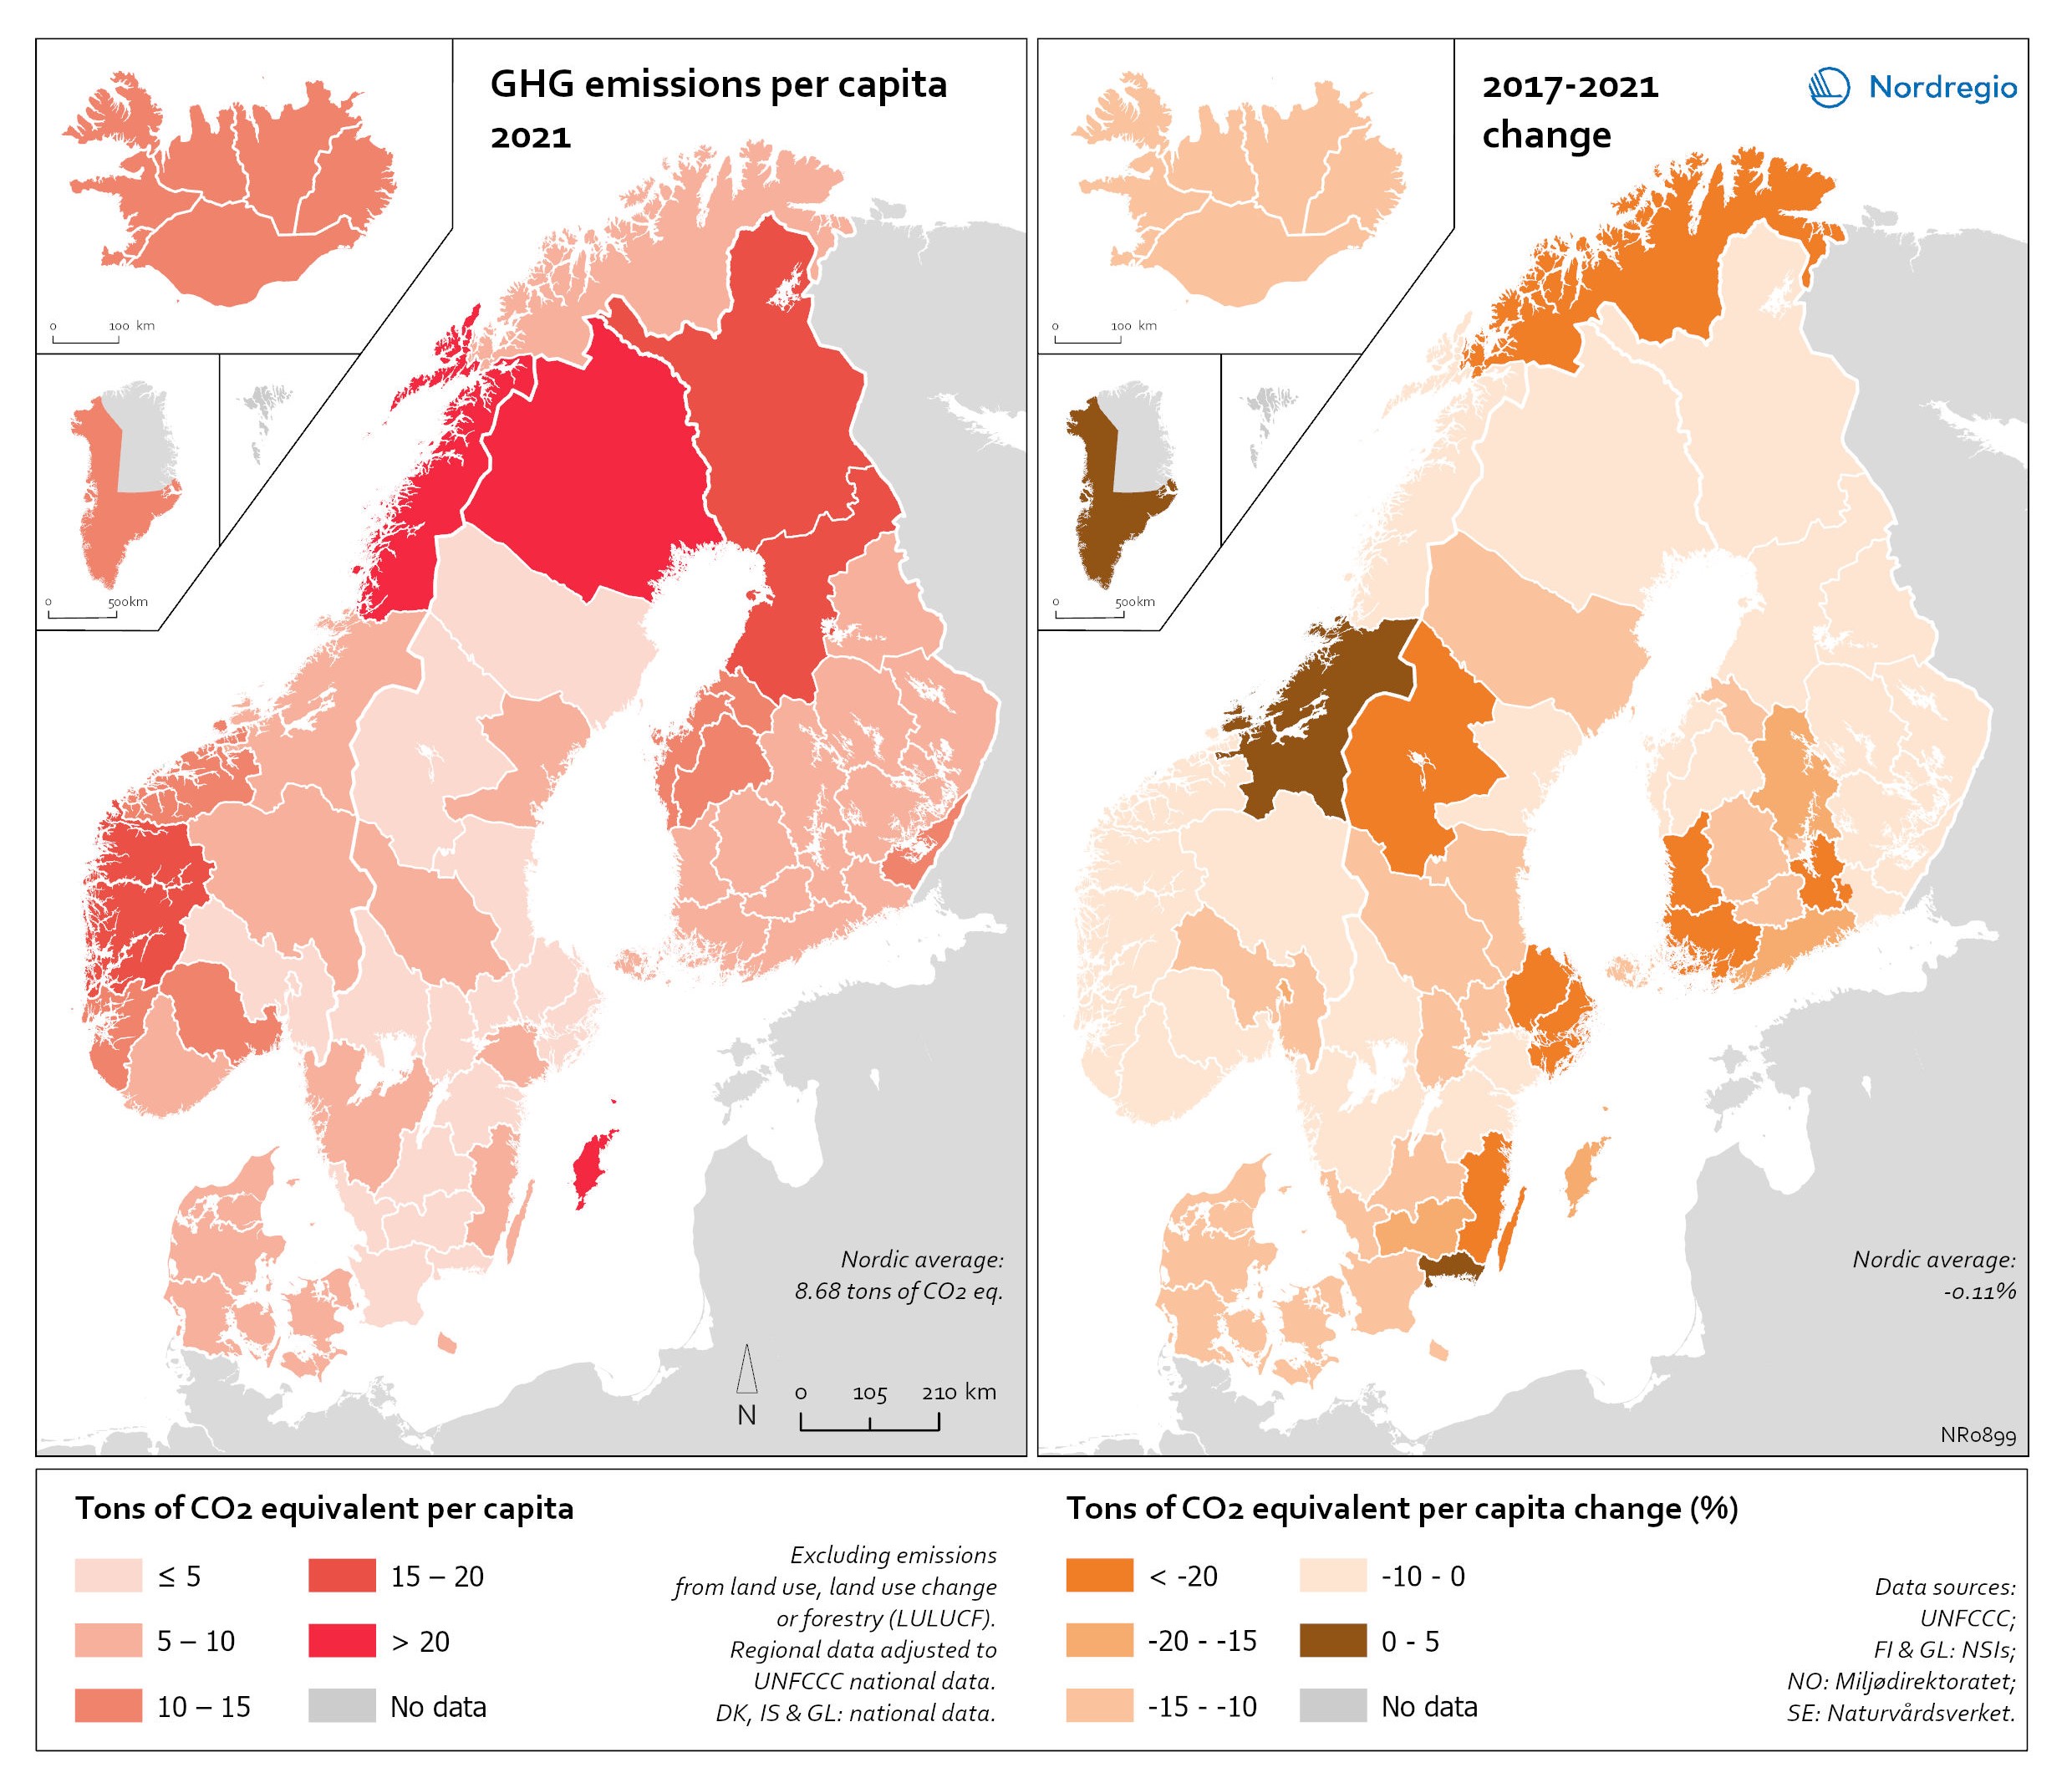
From 2017 to 2021, the Nordic regions cut their per-capita GHG emissions by on average 11.3%, with an overall Nordic average fall of 8.7% over the same period. In regions historically reliant on fossil fuels for heat and power generation, emissions have continued to decline. This trend is evident in Denmark, as well as in Southern Sweden and Southern Finland – densely populated areas that have taken steps toward expanding district heating coverage and reducing carbon intensity. The largest decrease in GHG emissions per capita was found in Troms and Finnmark, with a 42.3% decrease, Satakunta with a 30.2% decrease and Päijät-Häme – Päijänne-Tavastland with a 29.2% decrease. Only three regions (Greenland, Trøndelag and Blekinge) saw an increase in GHG emissions per capita.
At an aggregated level, industrial-related emissions decreased throughout the Nordic Region, but this trend does not hold true for regions in Norway with intensive offshore oil and gas operations. For instance, Nordland, Vestland, Møre og Romsdal, Vestfold and Telemark exhibited the highest per capita emissions in 2021. Between 2017 and 2021, emissions were increasing in many Norwegian regions with intensive offshore oil and gas activity, but also in Norrbotten in Sweden (21.2 tonnes of CO2 equivalent per capita) and Gotland (33.6 tonnes of CO2 equivalent per capita) due to intensive activity in the metal and cement industries, respectively, as well as in several Finnish regions. At the other end of the scale, the lowest emissions were seen in Oslo (1.32 tonnes of CO2 equivalent per capita), which is characterised by hydropower-based heating and a prevalence of electric cars. These tendencies align with OECD (2023), in which rural regions that specialise in natural resource extraction emissions were seen to be declining more slowly.

