As digital services become essential for everything from education to public health, it is more important than ever to understand who is being left behind and why.
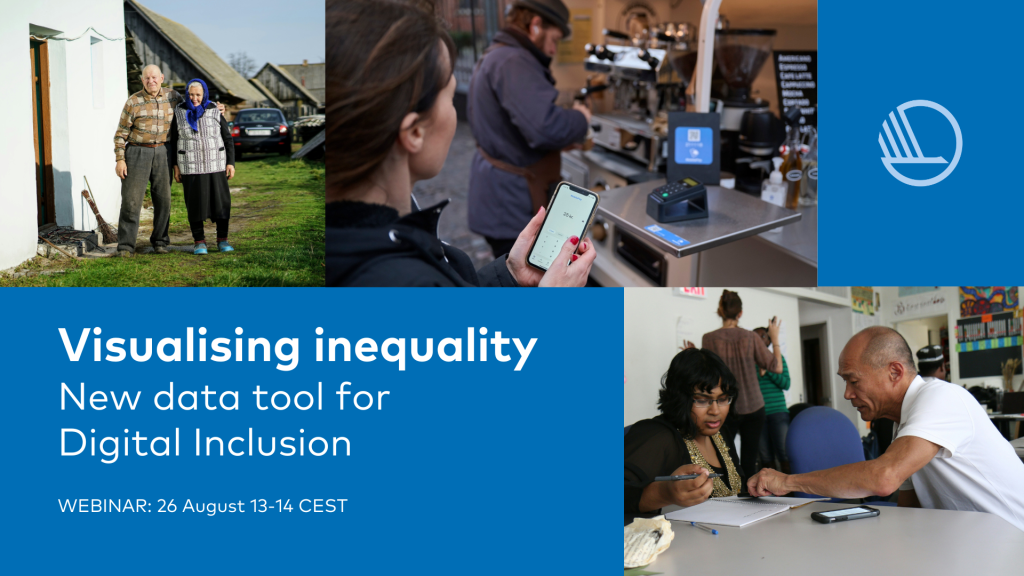
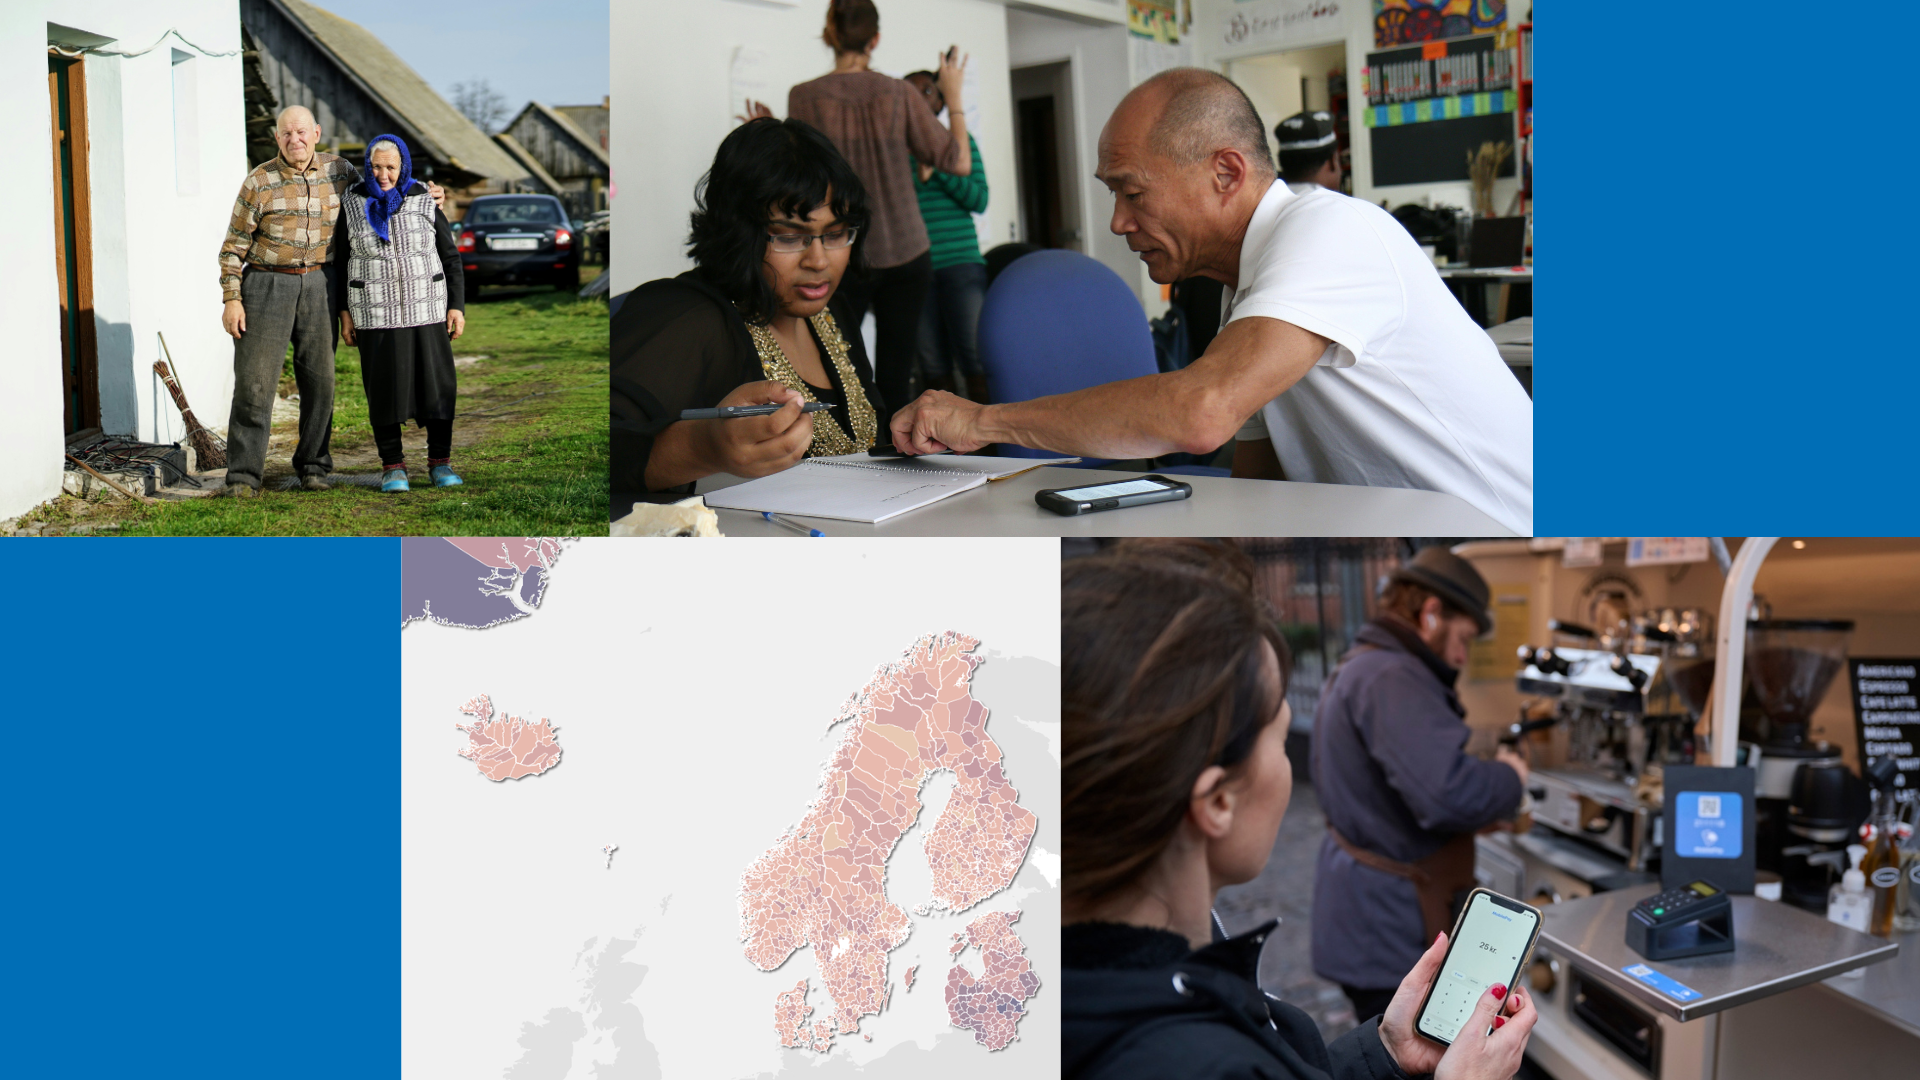
On 26 August, Nordregio and the Digital Inclusion in Action project launched the new Digital Inclusion Tool, an interactive data platform that helps identify where digital exclusion risks appear across the Nordic and Baltic regions. The tool brings together multiple socio-economic indicators, including education, age, digital skills, economic resources, and more, to provide a clear picture of digital vulnerabilities at the regional and local levels.
This one-hour webinar featured:
- A live demonstration of the tool
- Insights into how spatial data can support inclusive policy
- An interactive session for discussion, questions, and audience input
Why a digital inclusion tool?
- Learn how to bring spatial data into your digital inclusion strategies
- Expand your toolbox to compare trends, see where digital vulnerabilities appear highest, and learn how to target them
Speakers
- Maria Bobrinskaya, Senior GIS Analyst, Nordregio
Why Digital Inclusion Needs a Map - Anna Vasilevskaya, GIS Analyst and Tool Developer, Nordregio
Live Demo: Using the Digital Inclusion Index Tool - Maja Brynteson, Research Fewllow, Nordregio
Why the Digital Inclusion in Action Project


