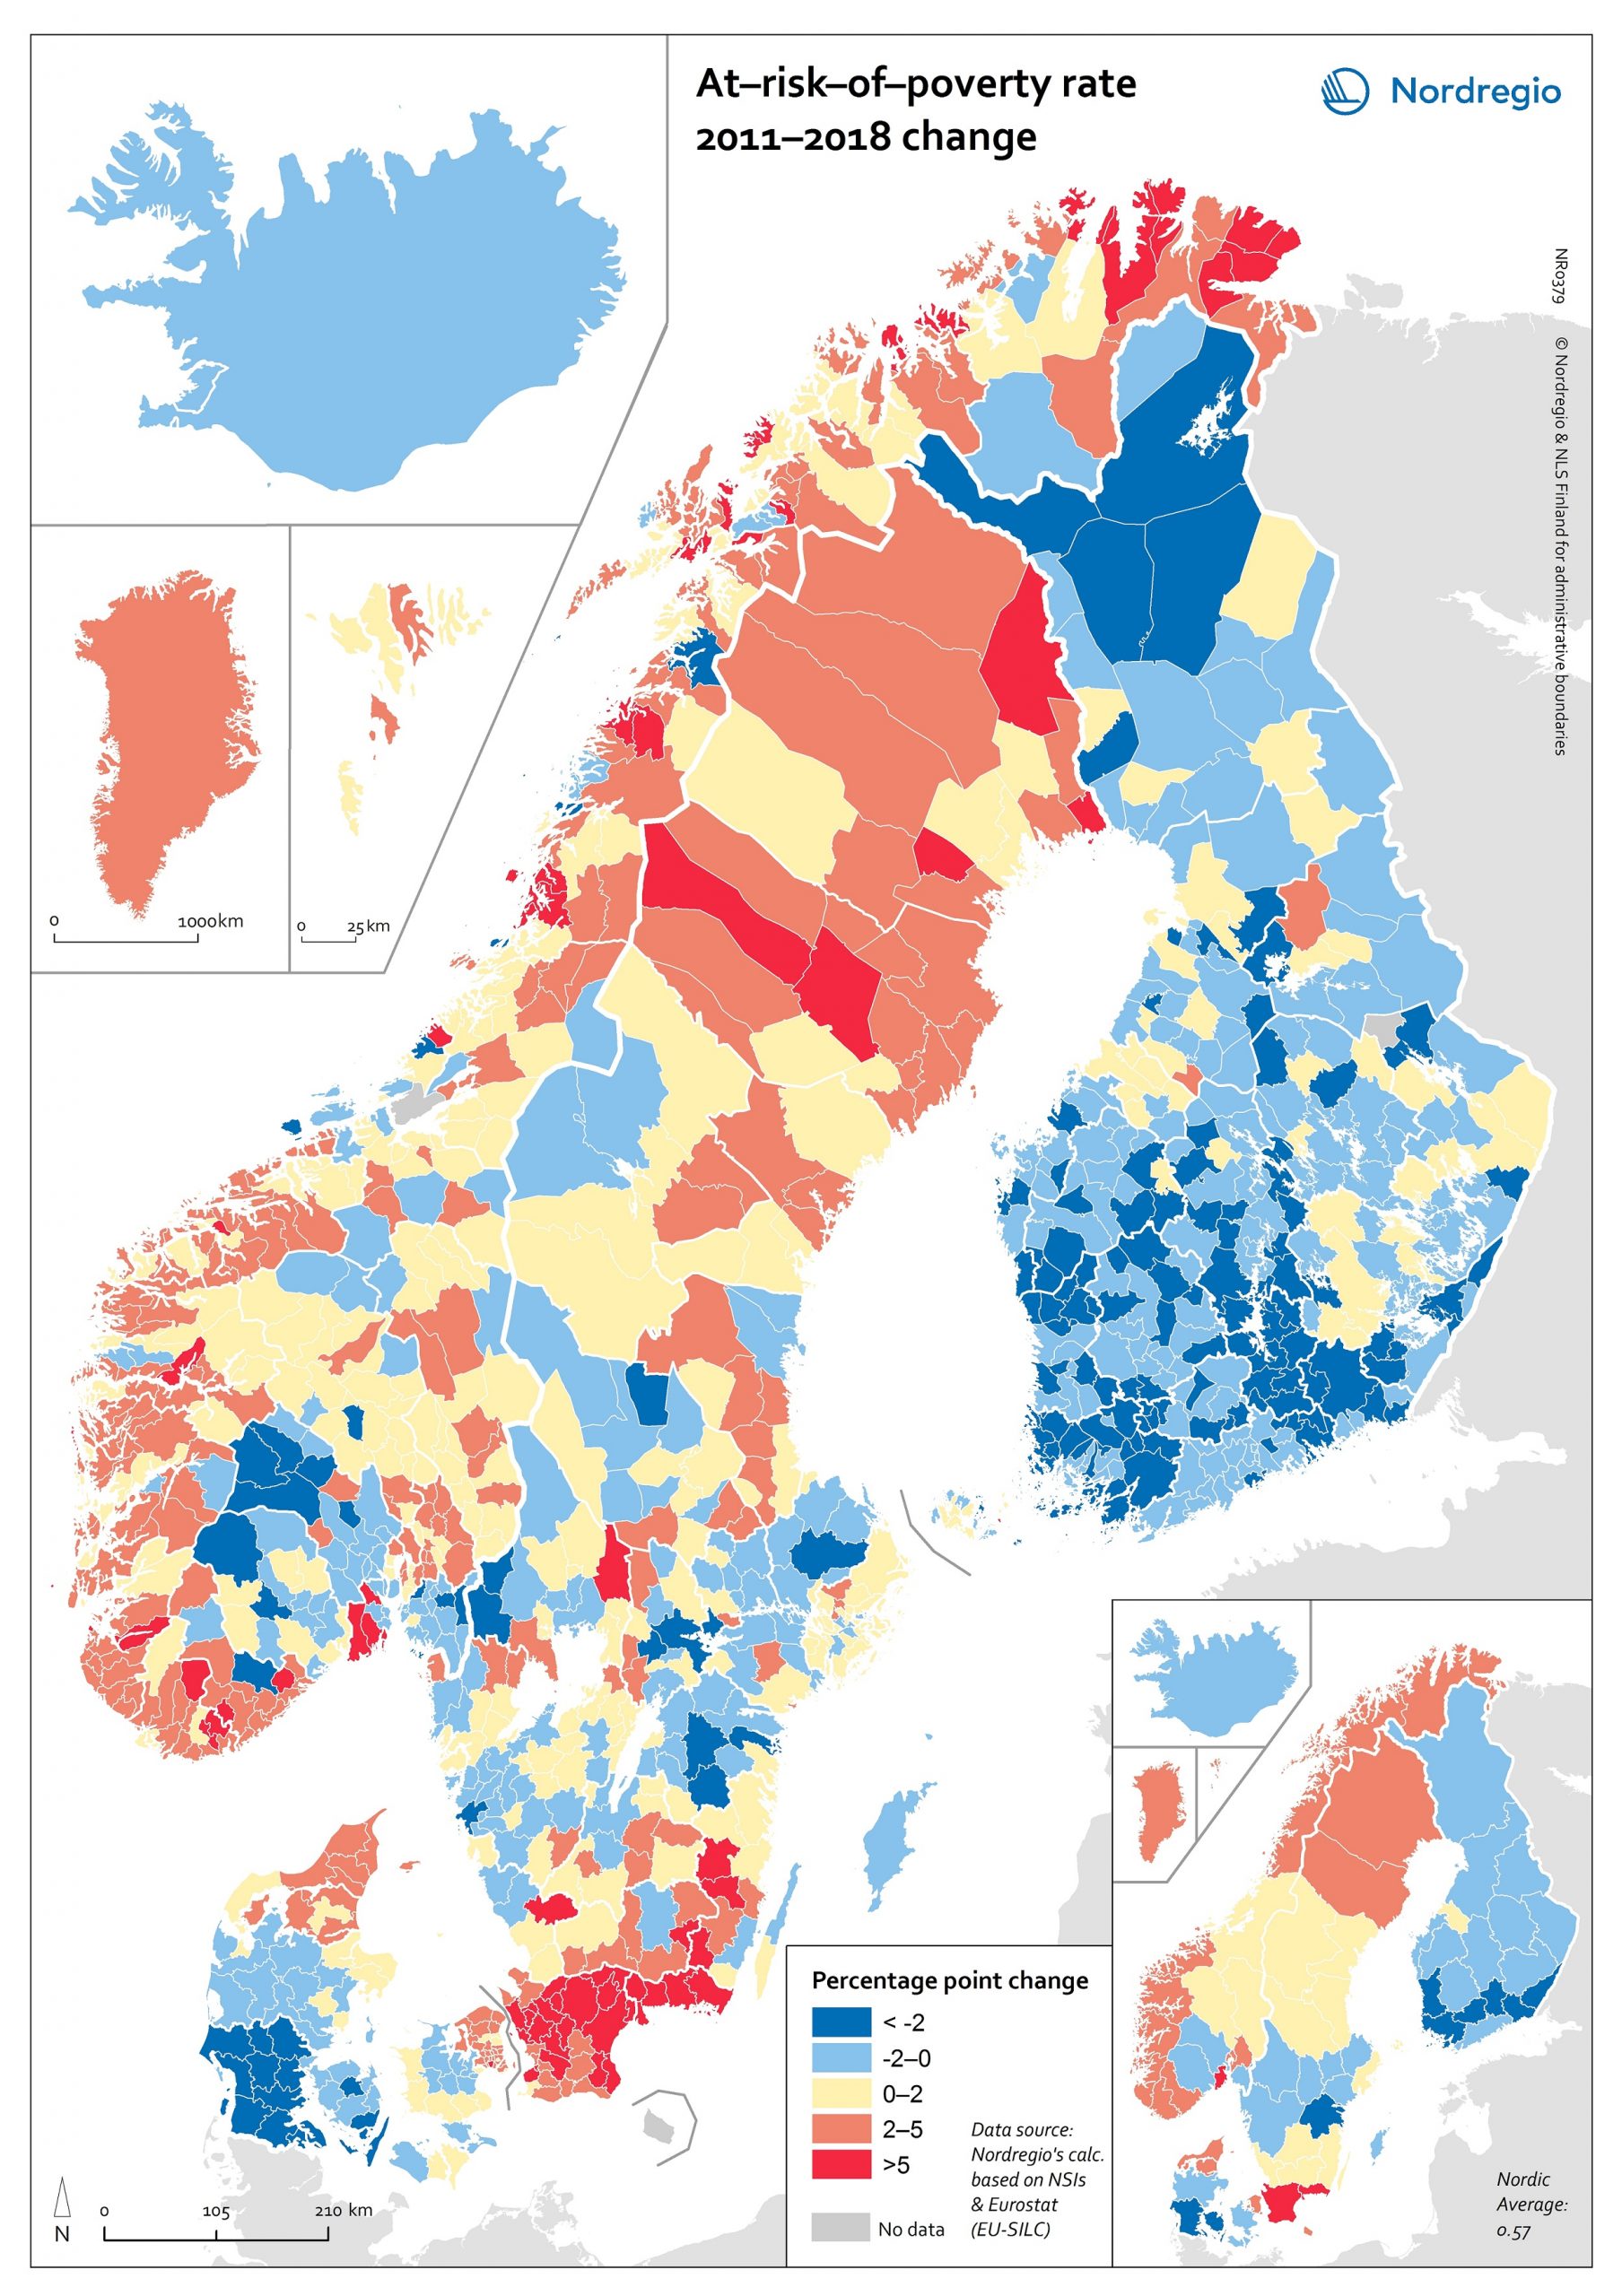
The map shows the “at-risk-of-poverty” (AROP) rate in the Nordic Region.
For the period from 2004 to 2018, the AROP rate increased in all Nordic countries except Iceland. This trend was strongest in Sweden. In Finland the AROP rate has been decreasing during the past few years, in line with what has previously been indicated – namely, on account of economic turmoil. This points to one of the weaknesses of using the AROP rate alongside several other measures of inequality. That is, while people have become poorer due to the economic crisis, the at-risk-of-poverty rate has paradoxically gone down. In addition, the AROP rate for Finland is higher in 2018 than it was in 2004.
Looking at these trends on a regional level over a period of time (between 2011 and 2018), we can see that the AROP rate has decreased in almost all areas of Finland, whereas the pattern is rath er more varied in the other Nordic countries (we can also see a cohesive area in the south of Denmark where the AROP rate has decreased.) Again, Sweden has the most regions displaying increases in the AROP rate. Finland and Sweden contain the largest differences between the regions with the highest and lowest AROP rate. Hence the greatest regional differences are to be found in Sweden and Finland. Sweden also has the highest average AROP rate.
About the At-risk-of-poverty
The at-risk-of-poverty rate is a common measure of relative poverty and social inclusion. Most notably, it has been used for monitoring the EU2020 goal of inclusive growth. The at-risk-of-poverty rate is normally defined as “the share of people with an equivalised disposable income (after social transfer) below the at-risk-of-poverty threshold, which is set at 60% of the national median equivalised disposable income after social transfer.” (Eurostat). The indicator is based on household income. That it is “equivalised” means that it has been adjusted according to household size. The at-riskof-poverty rate measures disposable income, i.e. income after taxes and social transfers. To obtain the at-risk-of-poverty rate, the number of households below 60% of the median income is divided by the total number of households. With the exception of Iceland, all national statistical institutes (NSIs) in the Nordic Region have data on at-risk-of-poverty at a municipal level.
These statistics are intended to be similar to the indicator from Eurostat. However, while national indicators also track the proportion of people with incomes below 60%, there are some differences regarding how in come and households have been defined. We have therefore harmonised data from the NSIs with the EU Statistics on Income and Living Conditions (SILC) to make the data more comparable. Since it is based on a survey, there are a number of uncertainties regarding the data. Another weakness is that the data does not include incomes of cross border commuters. Municipalities with a high proportion of cross-border commuters might therefore have a higher proportion of people at risk of poverty than would otherwise be the case. This is mainly the case for some Swedish municipalities bordering Norway and Denmark, as well as for the Swedish-Finnish border around Haparanda-Tornio.

