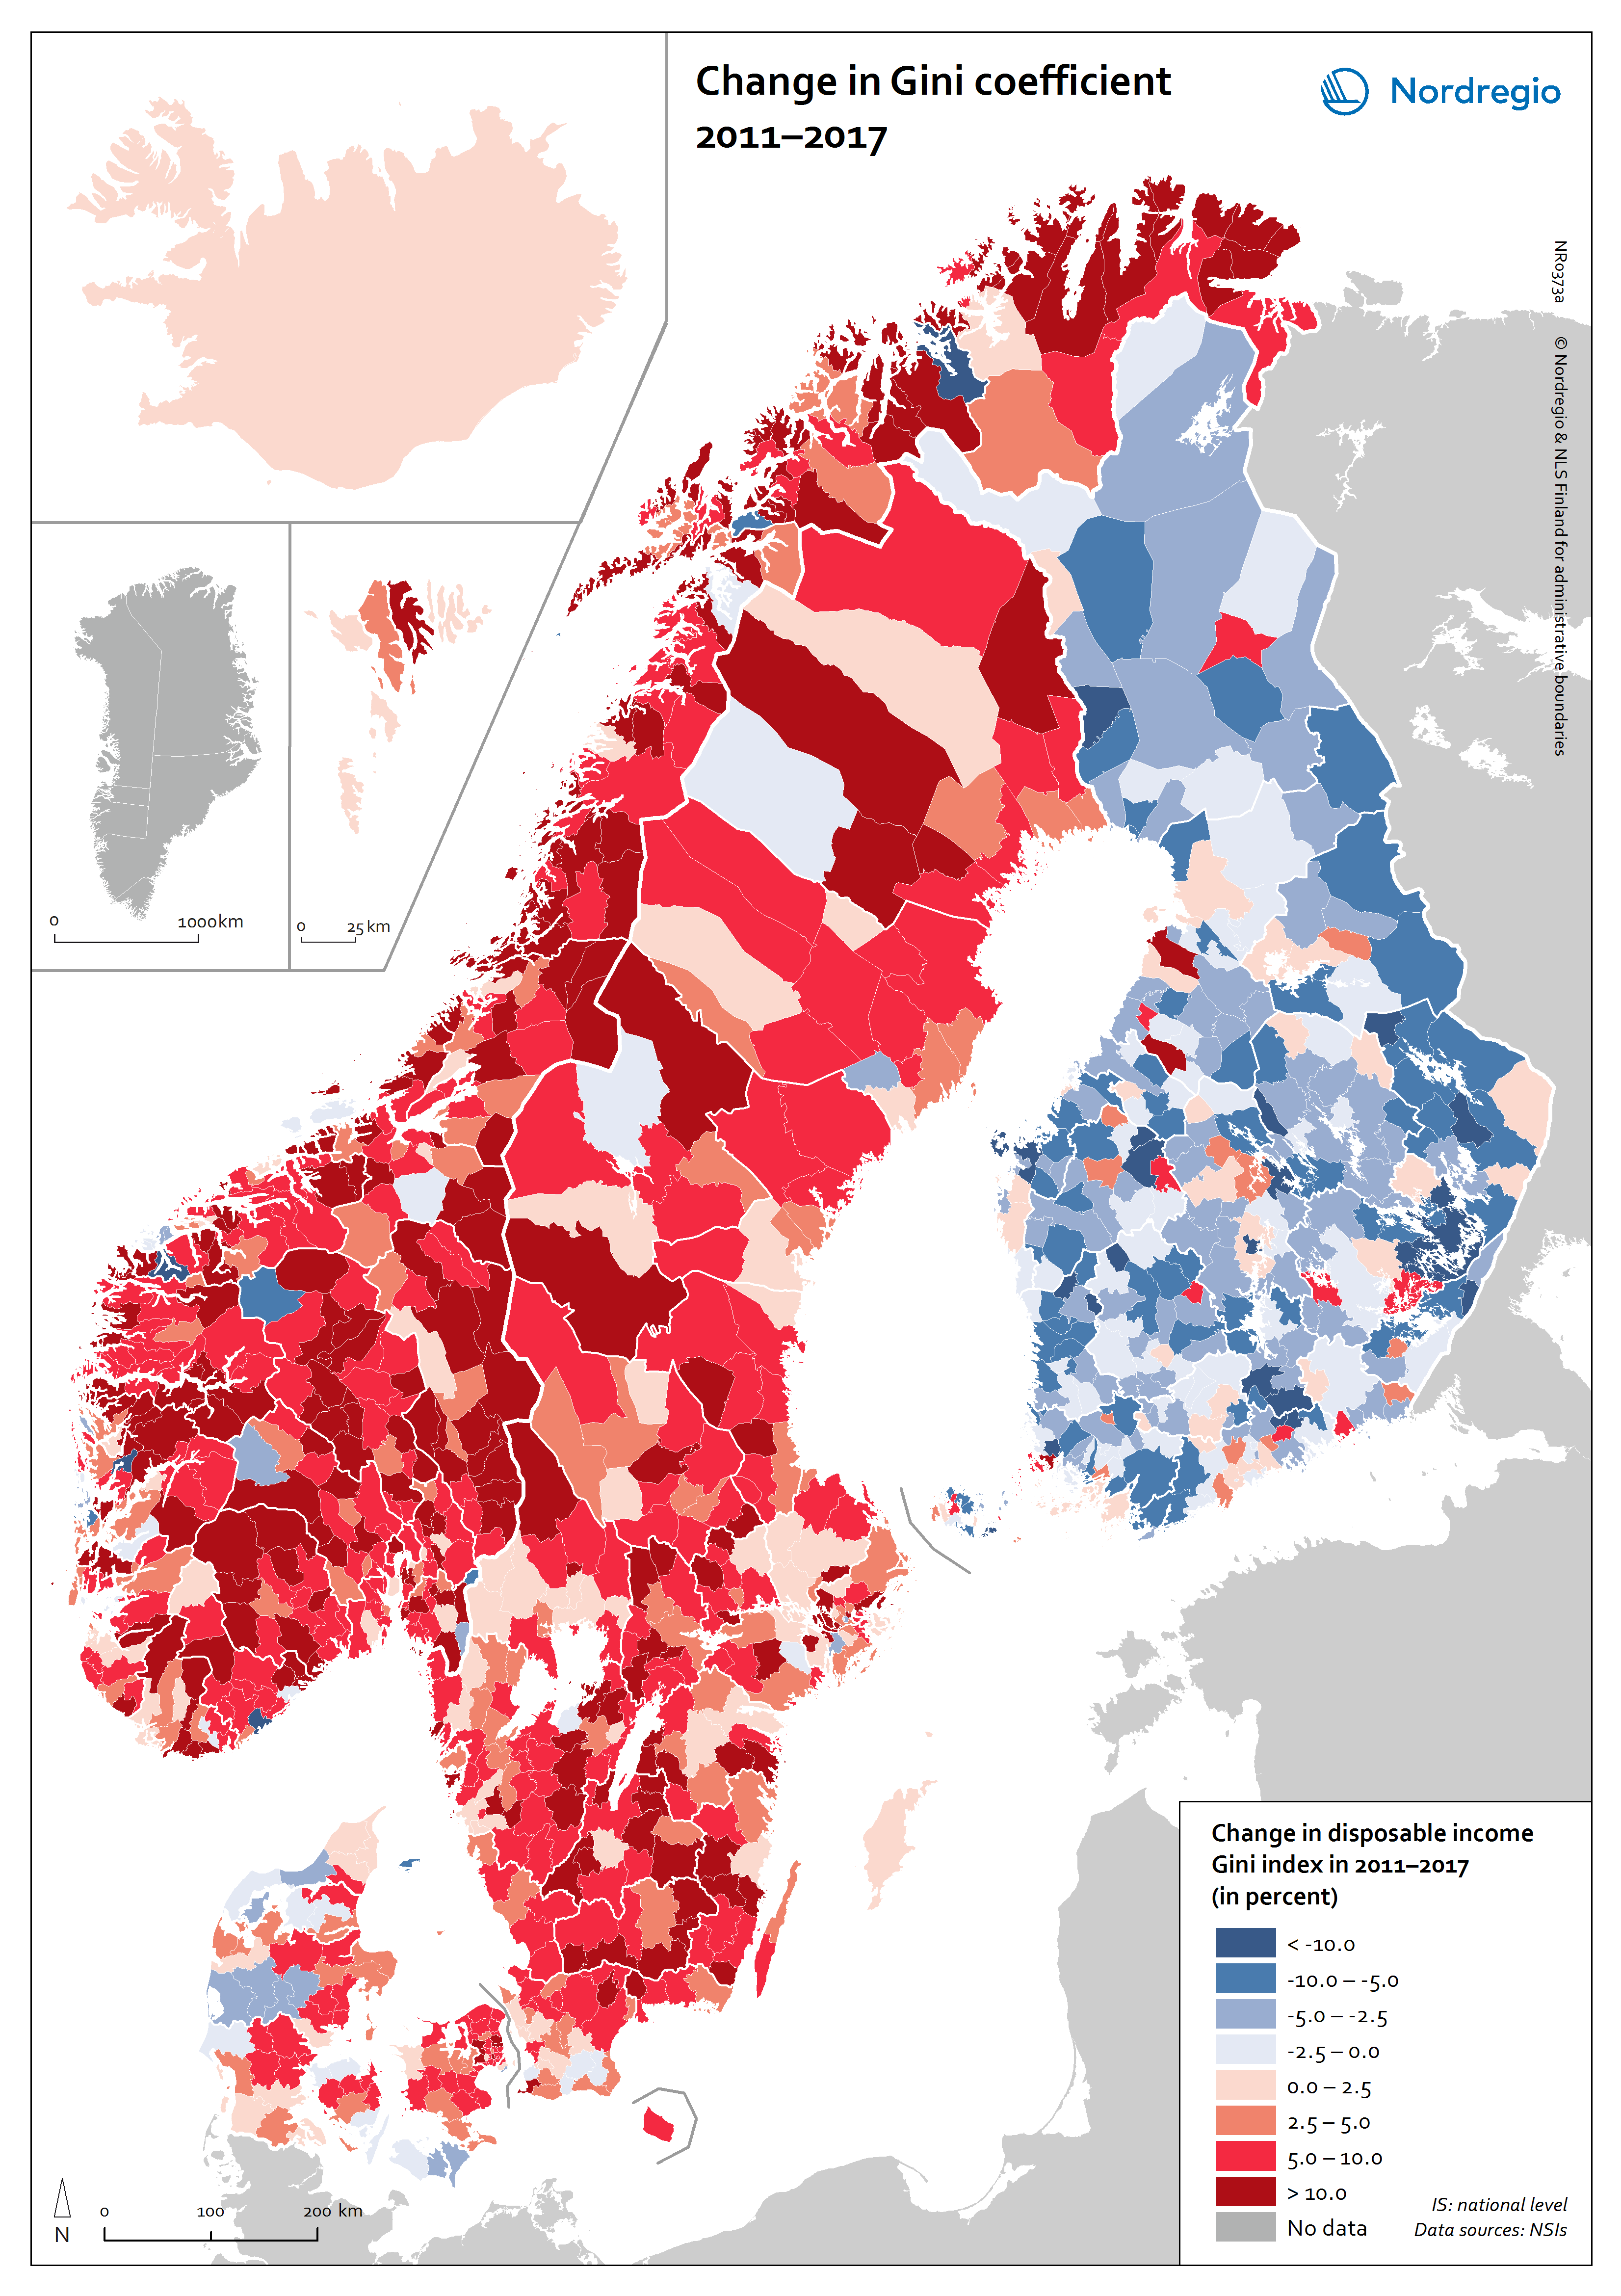
This map shows the change in disposable income Gini index at the municipal level during the period 2011-2017.

The blue shades indicating a decrease in income inequality and the red shades indicating an increase in income inequality.
The figure reveals that the situation is very different across the municipalities and countries of the Nordic Region. Income inequality increased between 2011 and 2017 in the vast majority of municipalities across the Nordic Region. The greatest increases are found in rural areas in both Norway and Sweden. These increases are largely explained by an increase in income for households that already had a high income in 2011. However, income inequality decreased in almost a quarter of the municipalities in the Nordic Region during the same period. These municipalities are mainly located in Finland and Åland. The narrowing of the household income gap in many municipalities across Finland is mainly due to the prolonged economic recession in the early 2010s combined with demographic changes (e.g. out-migration and ageing).
Read the digital publication here.


