Nordregio is an international research institute established by the Nordic Council of Ministers

25 March, 2026

Change in gross regional product per capita by NUTS3 region 2019–2024

This map shows the annualised percent change in regional GDP per-capita during the 2019–2024 period (constant prices, euros 2020).

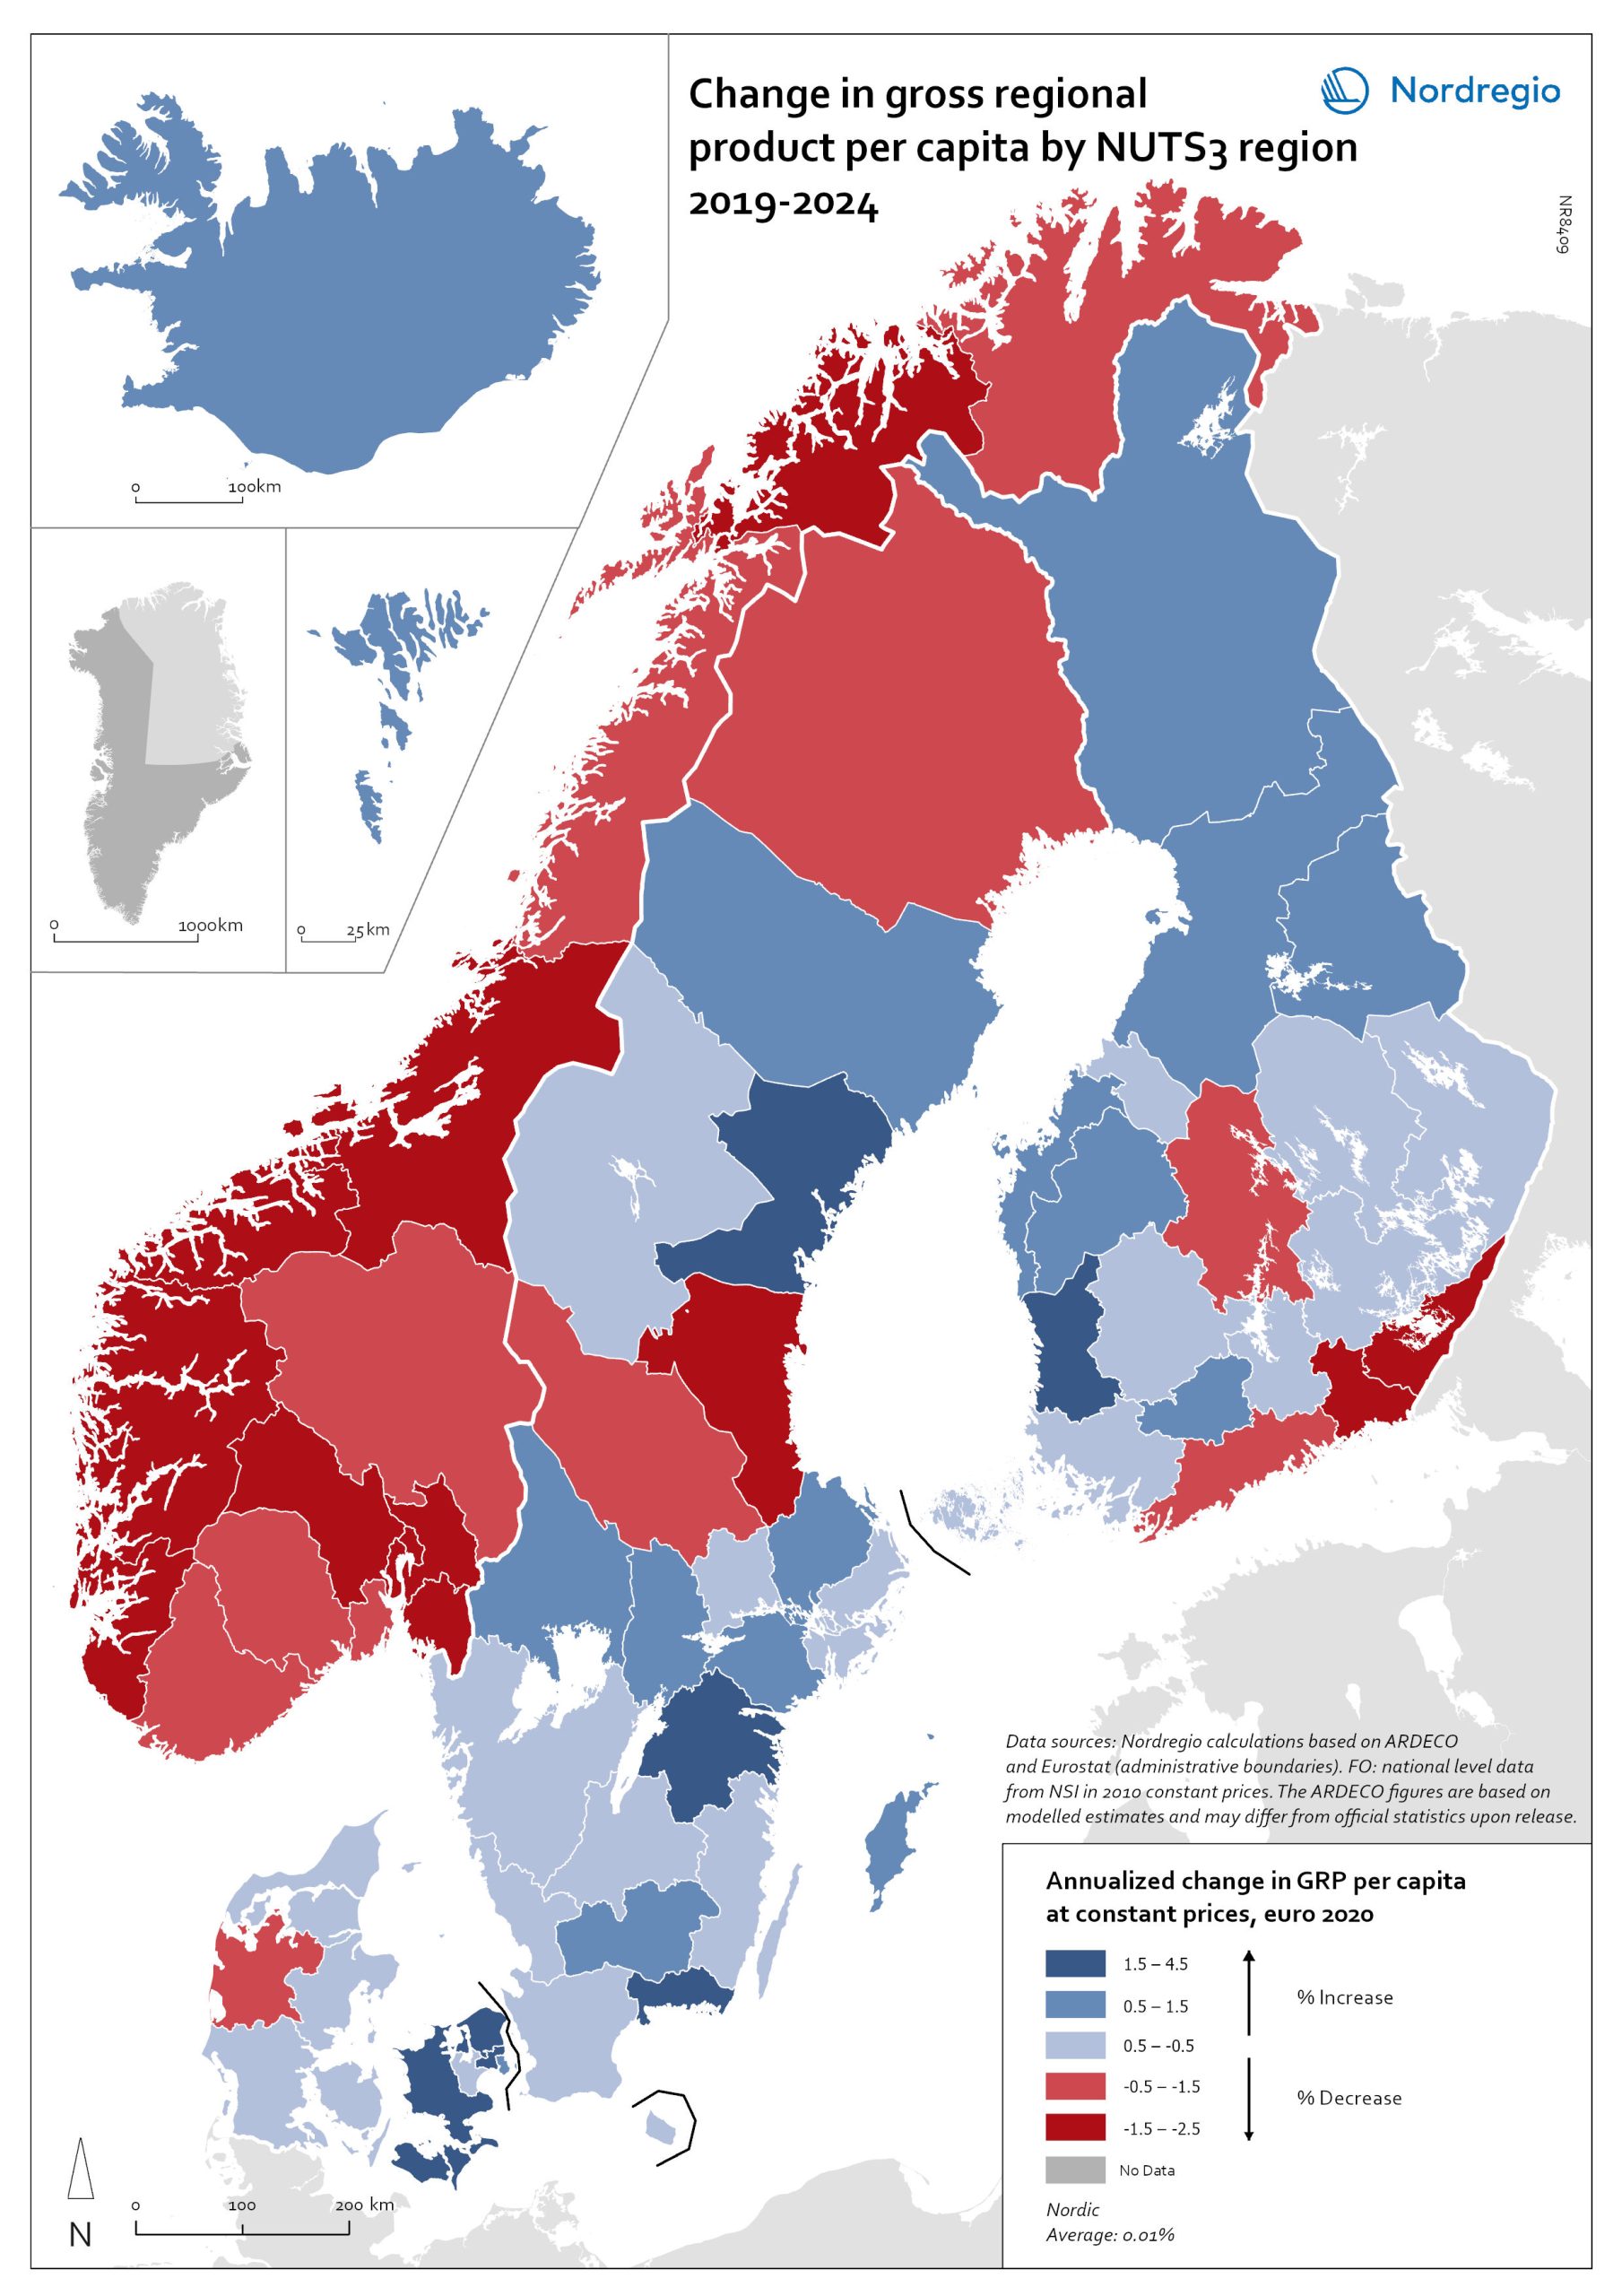
The map is included in the State of the Nordic Region 2026 report (Chapter 1).

Map Facts

The map is included in the State of the Nordic Region 2026 report.

Designer/Cartographer

Cartographer / GIS analyst

Terms of use

All images are the property of Nordregio. They may be freely used as long as the logo of Nordregio is clearly visible and the source is cited accordingly. Please give also the cartographer/designer/author credit and give full recognition to the data sources if named in the graphic.

If you have any questions, contact us:

Email: maps@nordregio.org

Phone: + 46 8 463 54 00

Source: Nordregio at www.nordregio.org