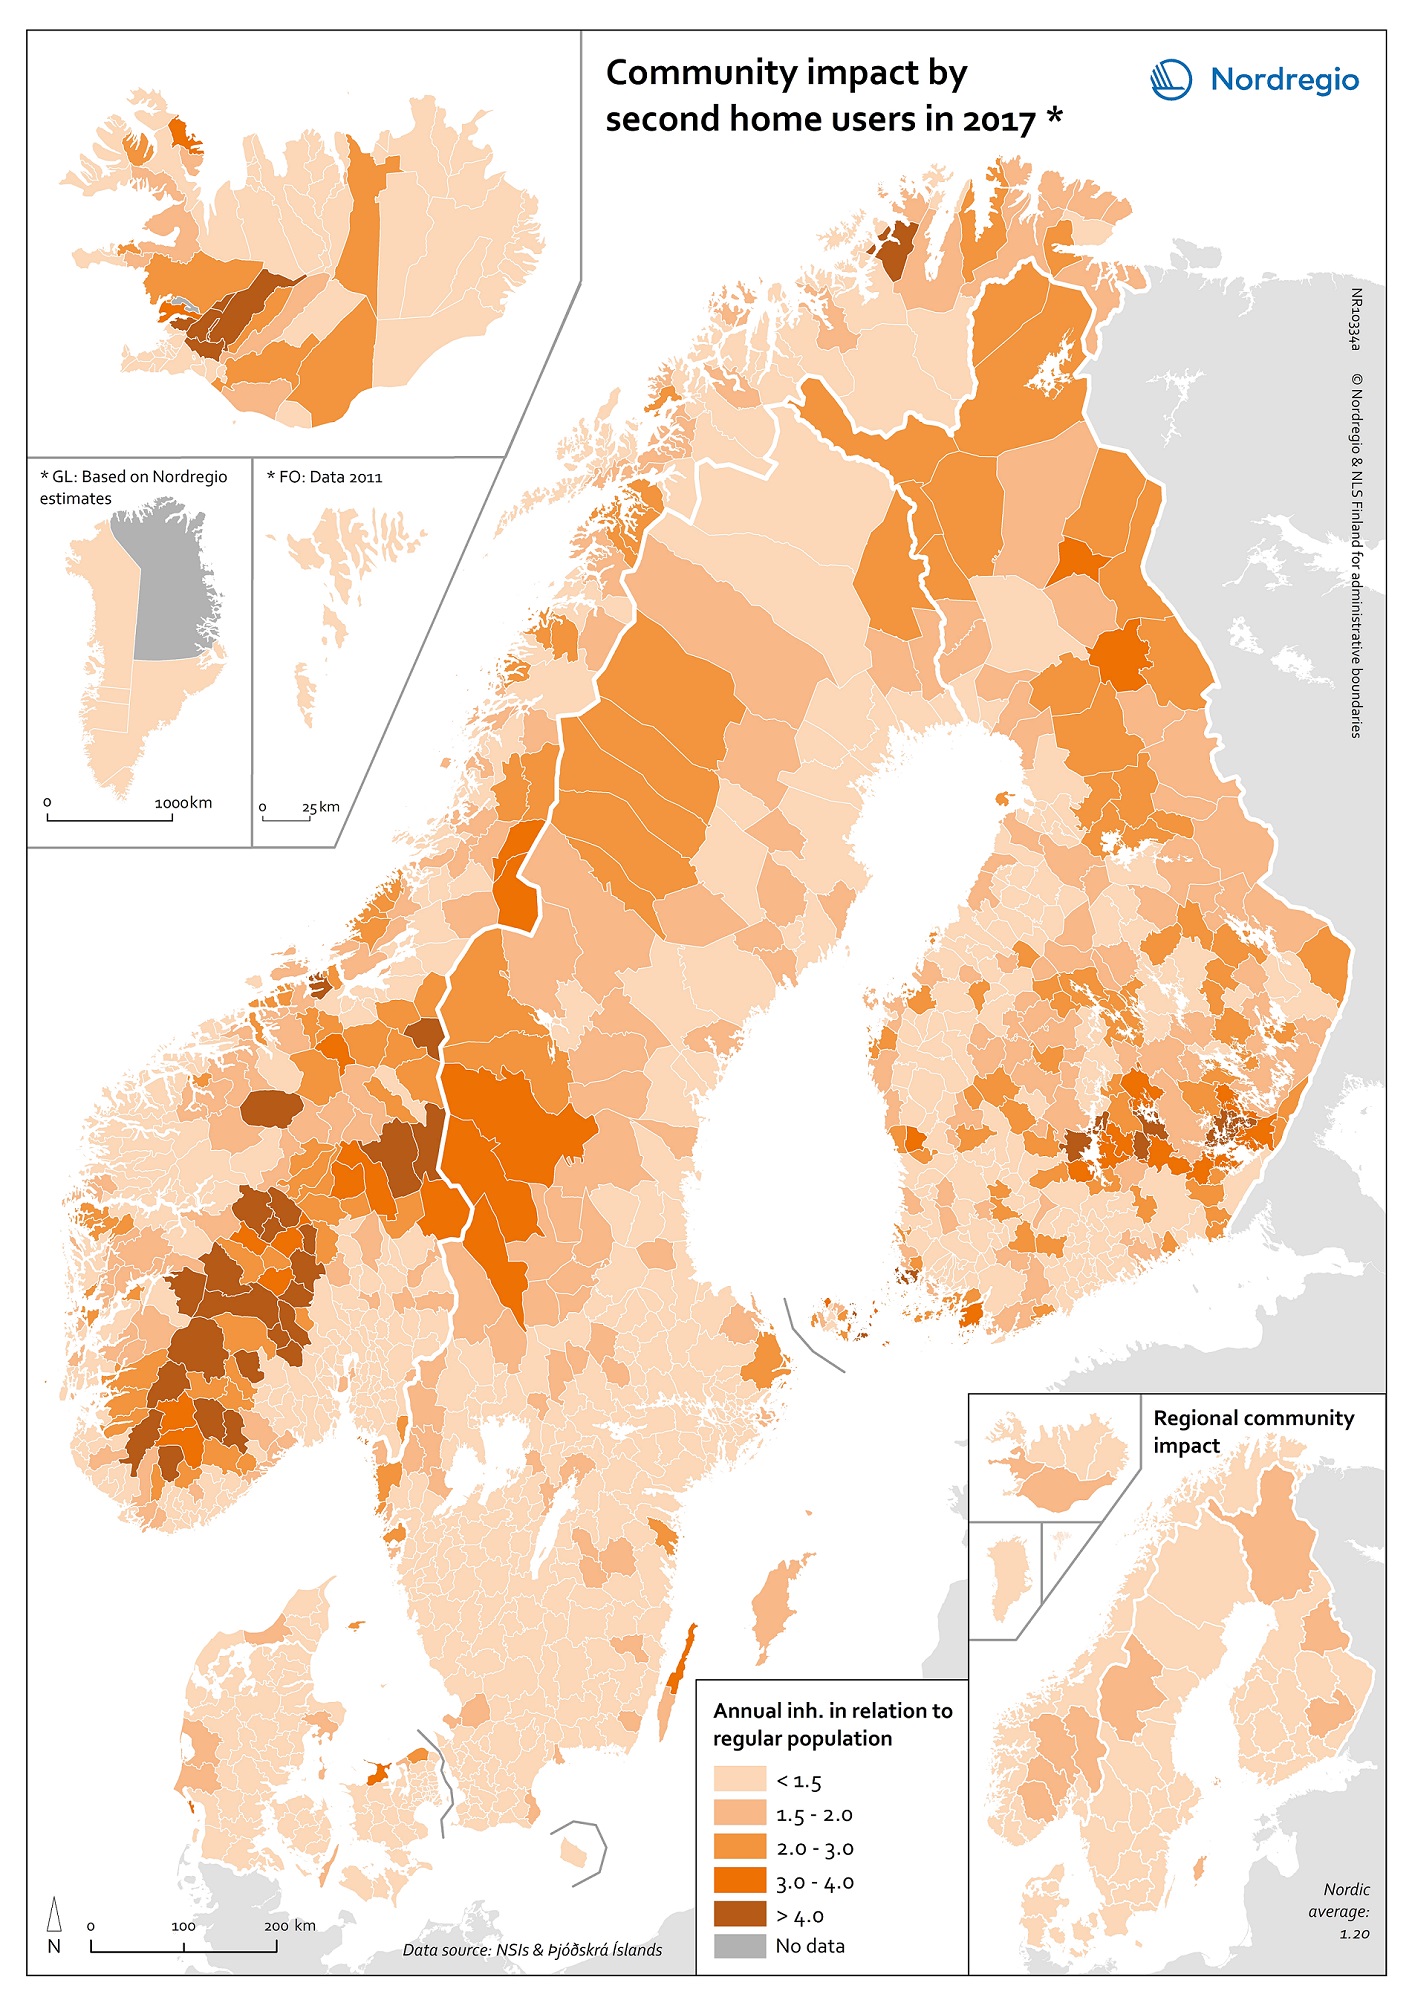
This map depicts the community impact (CI) of second home users in 2017[1].
The indicator illustrates the impact of occasional second home visitors to the municipality.CI is defined as the ratio between annual inhabitants (AI) and regular population (CI= AI/Regular population). AI is a statistical variable that estimates the overall population of the municipalities, both the permanent inhabitants but also the seasonal second home visitors that also utilize the local infrastructure, welfare and planning resources. AI is defined as three times the number of second homes plus the regular population. (AI= Regular population + 3 x number of second homes). Number three represents the estimate of average household size that visits the second home.
Dark orange tones indicate high impact of seasonal inhabitants and light orange indicates lower impact of the seasonal variation. In populous municipalities with few recreational homes the two population measures (AI & regular population) will be almost identical, yielding a ratio approaching 1. The ratio between the regular population and the calculated annual population is large in municipalities with relatively few inhabitants and a high number of second homes. Nordic average for community impact by second home users was 1.2.
Southern Savonia in Finland was the region with highest regional community impact. From other Nordic countries, the regions of Suðurland in Iceland, Oppland in Norway and Jämtland Härjedalen in Sweden also stood out with higher ratios. On a municipal level the highest community impact can be found from Skorradalshreppur (28.9) in Iceland. Moreover, Grímsnes- og Grafningshreppur (19.2) (IS) and Kustavi (11.3) (FI) were the municipalities where the community impact also exceeded the ratio of 10.
A large amount of second homes implies that there is a significant flow of people who are not permanently registered in these areas. This flow of people has both highly positive and negative impacts on the municipalities. This map has been developed in the Nordregio project “Urban-rural flows of seasonal tourists – local planning challenges and strategies”. The analyses in the study suggest that the community impact (CI) can be used to further include the annual population in spatial planning. For instance, the map can be utilized as basis for dialogue between public administration on municipal, regional and national levels.


