Females and males in the Nordic Arctic 2014 and 2015
HomeMapsFemales and males in the Nordic Arctic 2014 and 2015
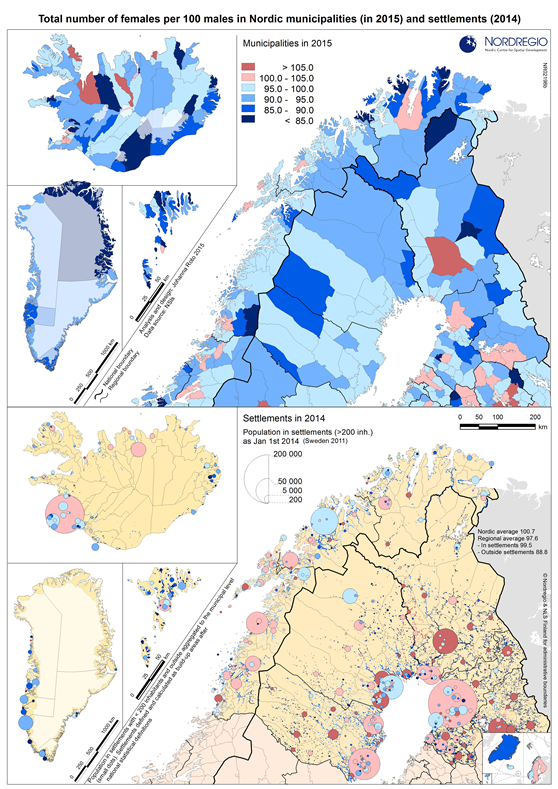
Total number of female per 100 male in Nordic Arctic municipalities (2015) and settlements (2014).
Map Facts
The rather skewed gender ratios in the Nordic Arctic are shown in the map at municipal and settlement level. Areas in blue are those with the highest male dominated gender ratio. The map on top shows the gender balance at municipal level and the map below shows the balance in settlements and outside settlements. At the municipal level the male dominance in the Arctic Nordic region is clearly visible. In the lion’s share of the rural municipalities there are less than 90 females per 100 males whereas a number of the regional centres with their commuting catchment areas – especially university towns – can be seen as pink in the map, showing the female dominance. At settlement level, the diversification of the imbalances between women living in the larger settlements and men living in smaller settlements and outside settlements is even more pronounced. As the sizes of the settlements are shown as proportional circles, it is also easy to identify the main concentrations of population in the Nordic Arctic.
Designer/Cartographer
Johanna Roto
Data source
National statistical institutes
Published 31 August 2015
Terms of use
All images are the property of Nordregio. They may be freely used as long as the logo of Nordregio is clearly visible and the source is cited accordingly. Please give also the cartographer/designer/author credit and give full recognition to the data sources if named in the graphic.