The map shows the change in regional Gross Value Added (GVA) from 2019 to 2020 (in fixed prices).
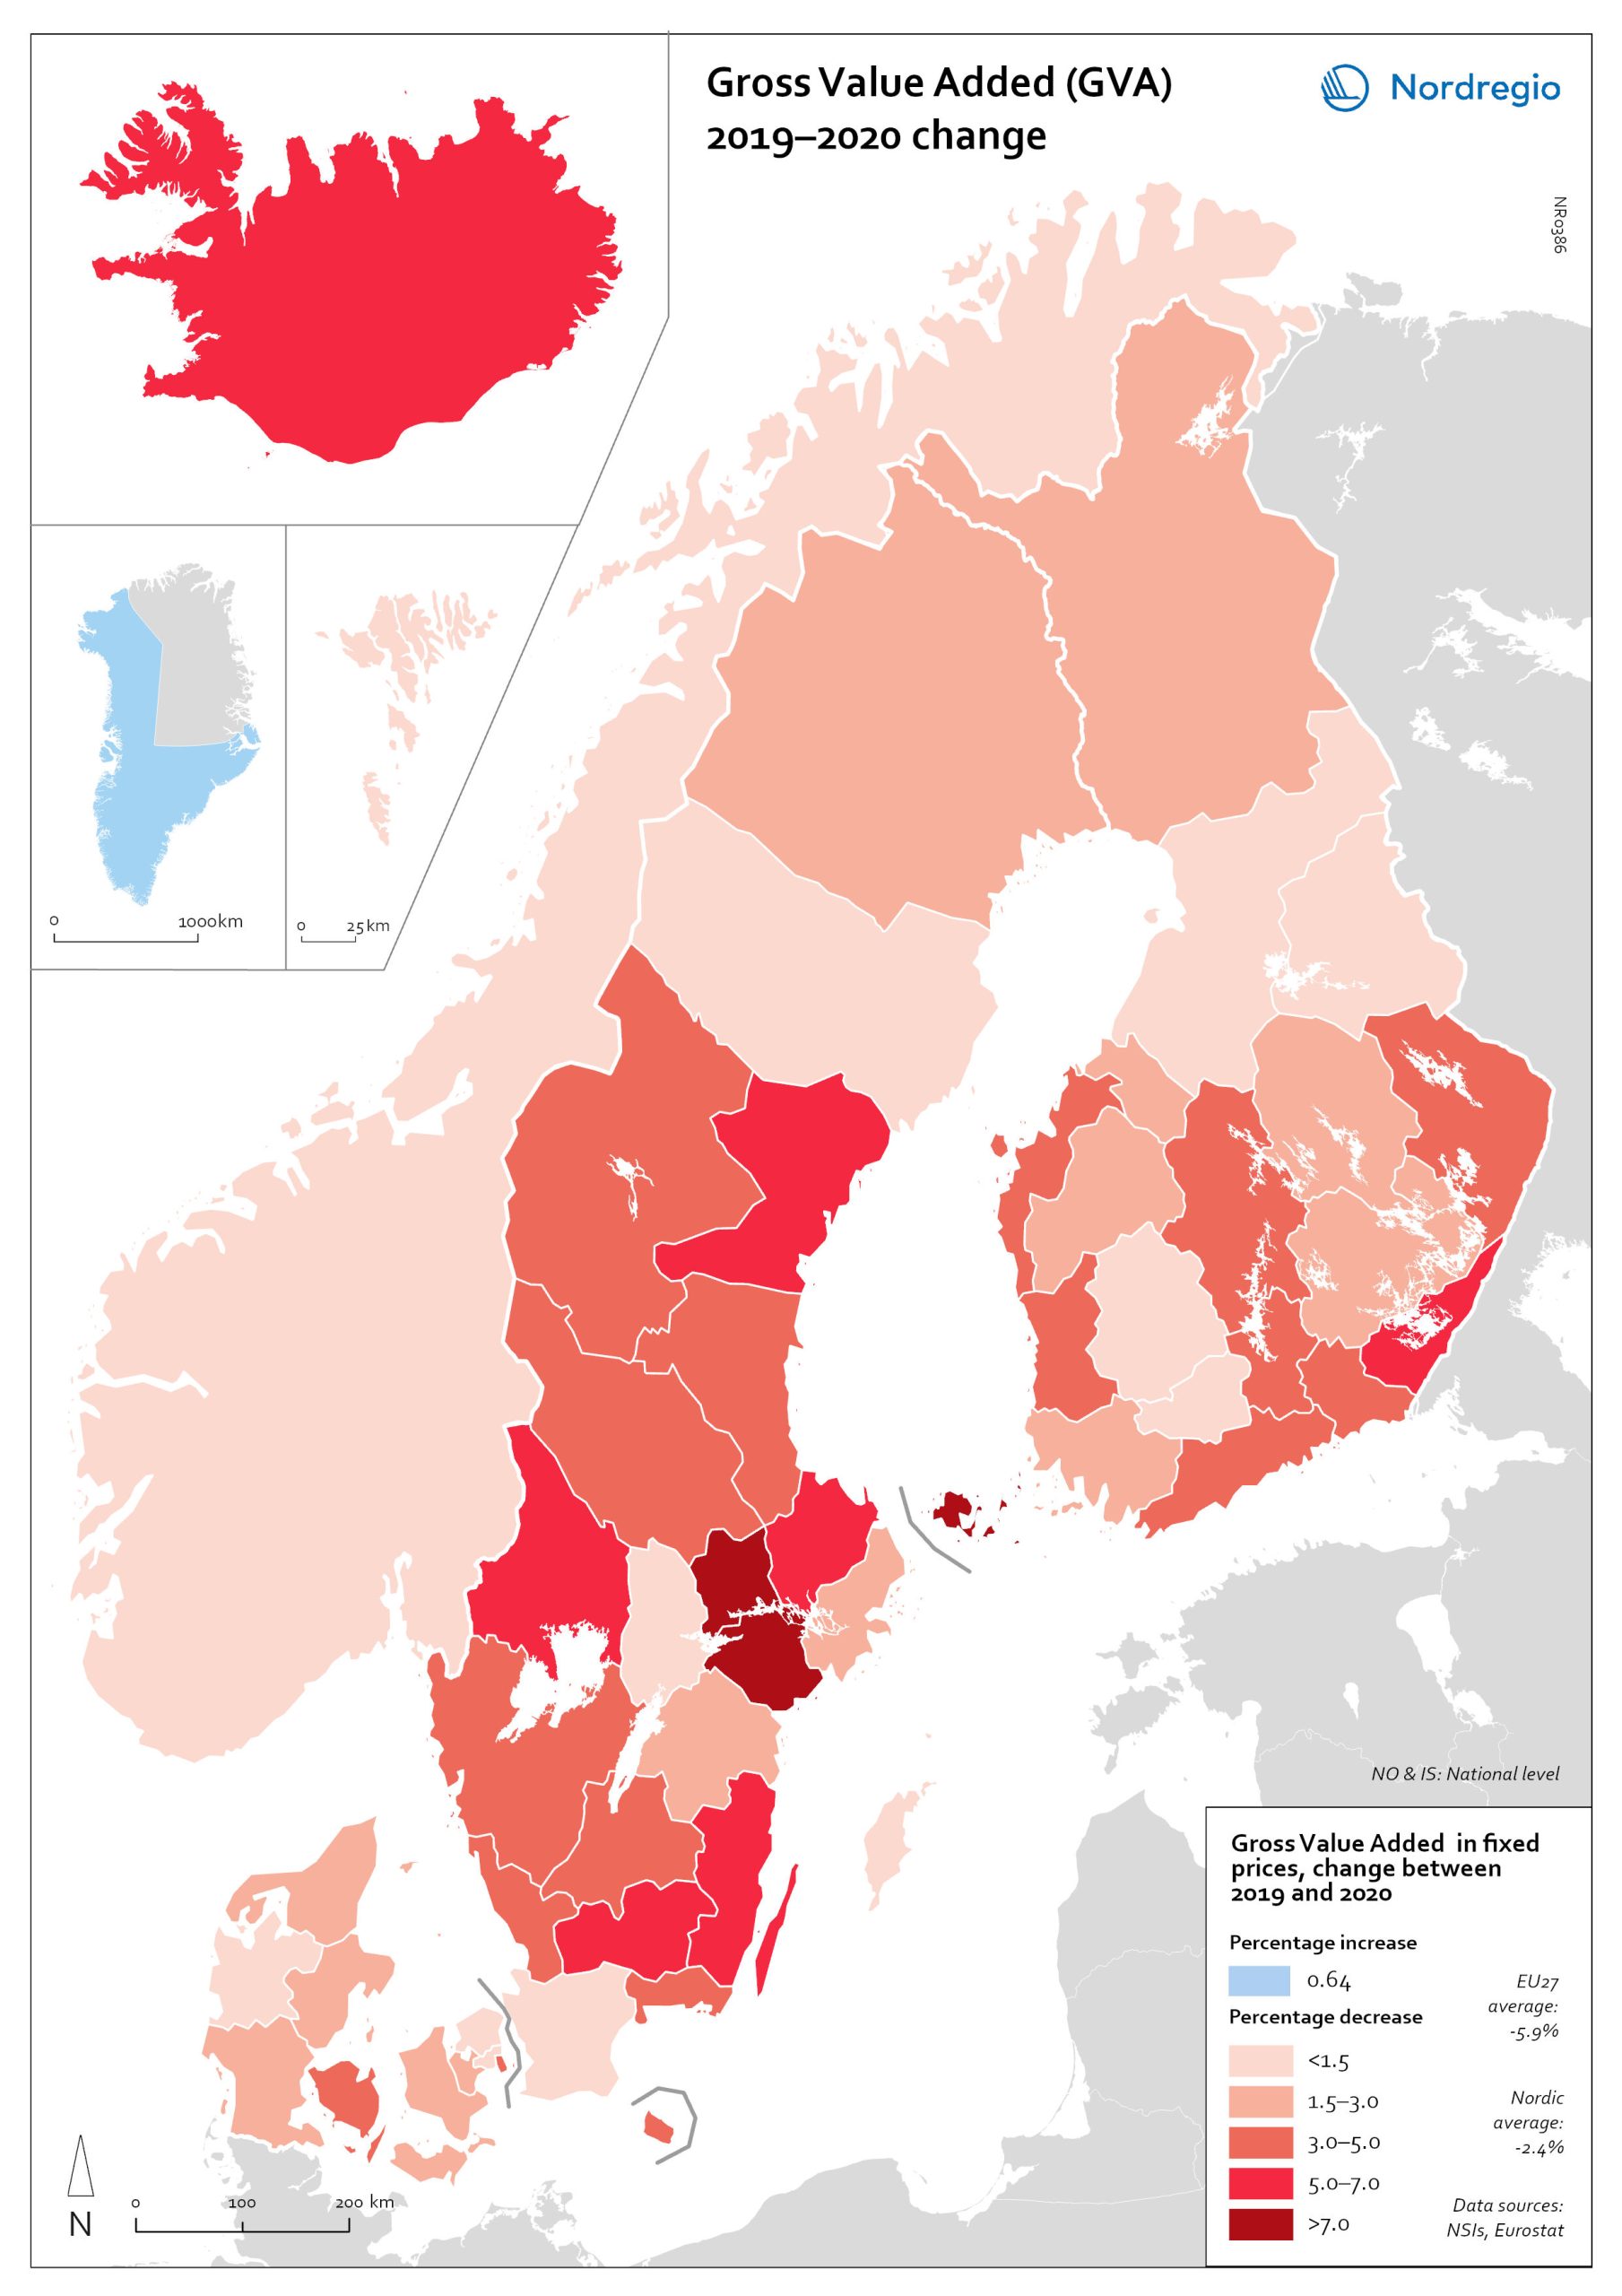
| As shown in the map, aggregated production levels, in terms of Gross Value Added (GVA), contracted in nearly all of the Nordic regions between 2019 and 2020. In general, the variability was comparatively smaller within each country than it was between countries, even when comparing regions with similar economic profiles from different countries. On average, the impact was greater on regions in Sweden and Finland than those in Denmark. Still, some relevant territorial patterns emerge from the changes to regional GVA shown in the map. The contraction was larger in regions with higher dependence on tourism services and hospitality (Åland and some municipalities in South Karelia, Finland, and Bornholm, Denmark), as well as on mass-market retail and logistics, particularly in the areas surrounding the capital regions (Södermanland and Västmanland in Sweden and Greater Copenhagen in Denmark). In Sweden and Finland, a remarkable regional divide can also be traced between territories specialised in transformation sectors with limited vulnerability to the impact of Covid-19, including forestry and specific types of processing (e.g. pulp, cement), like Nord Ostrobothnia, Kainuu and Pirkanmaa in Finland, and Gotland, Västerbotten and Örebro in Sweden. Aggregated output in these regions fell less than in regions with greater exposure to industrial manufacturing, like Kymenlaakso in Finland and Kronobergs in Sweden. Similarly, the impact on the financial centres in Denmark (Greater Copenhagen) and Sweden (Stockholm) was less than regions with mid-sized cities and diversified urban economies, like Vestjylland (Århus) in Denmark and Upsala in Sweden. Interestingly, the shock to the Finnish economy was greater in the Helsinki metropolitan area (-3.6% Uusimaa) than it was for the Tampere region (-0.5% in Pirkanmaa). This may be due to the relatively higher concentration in Pirkanmaa of high-tech and information and communication technologies (ICT), which is one of the sectors that suffered the least during the pandemic. A similar interpretation holds for the Swedish urban areas of Gothenburg (-5.0% in Vastra Gotaland), and Malmö and Lund (-1.2% in Scania). |

