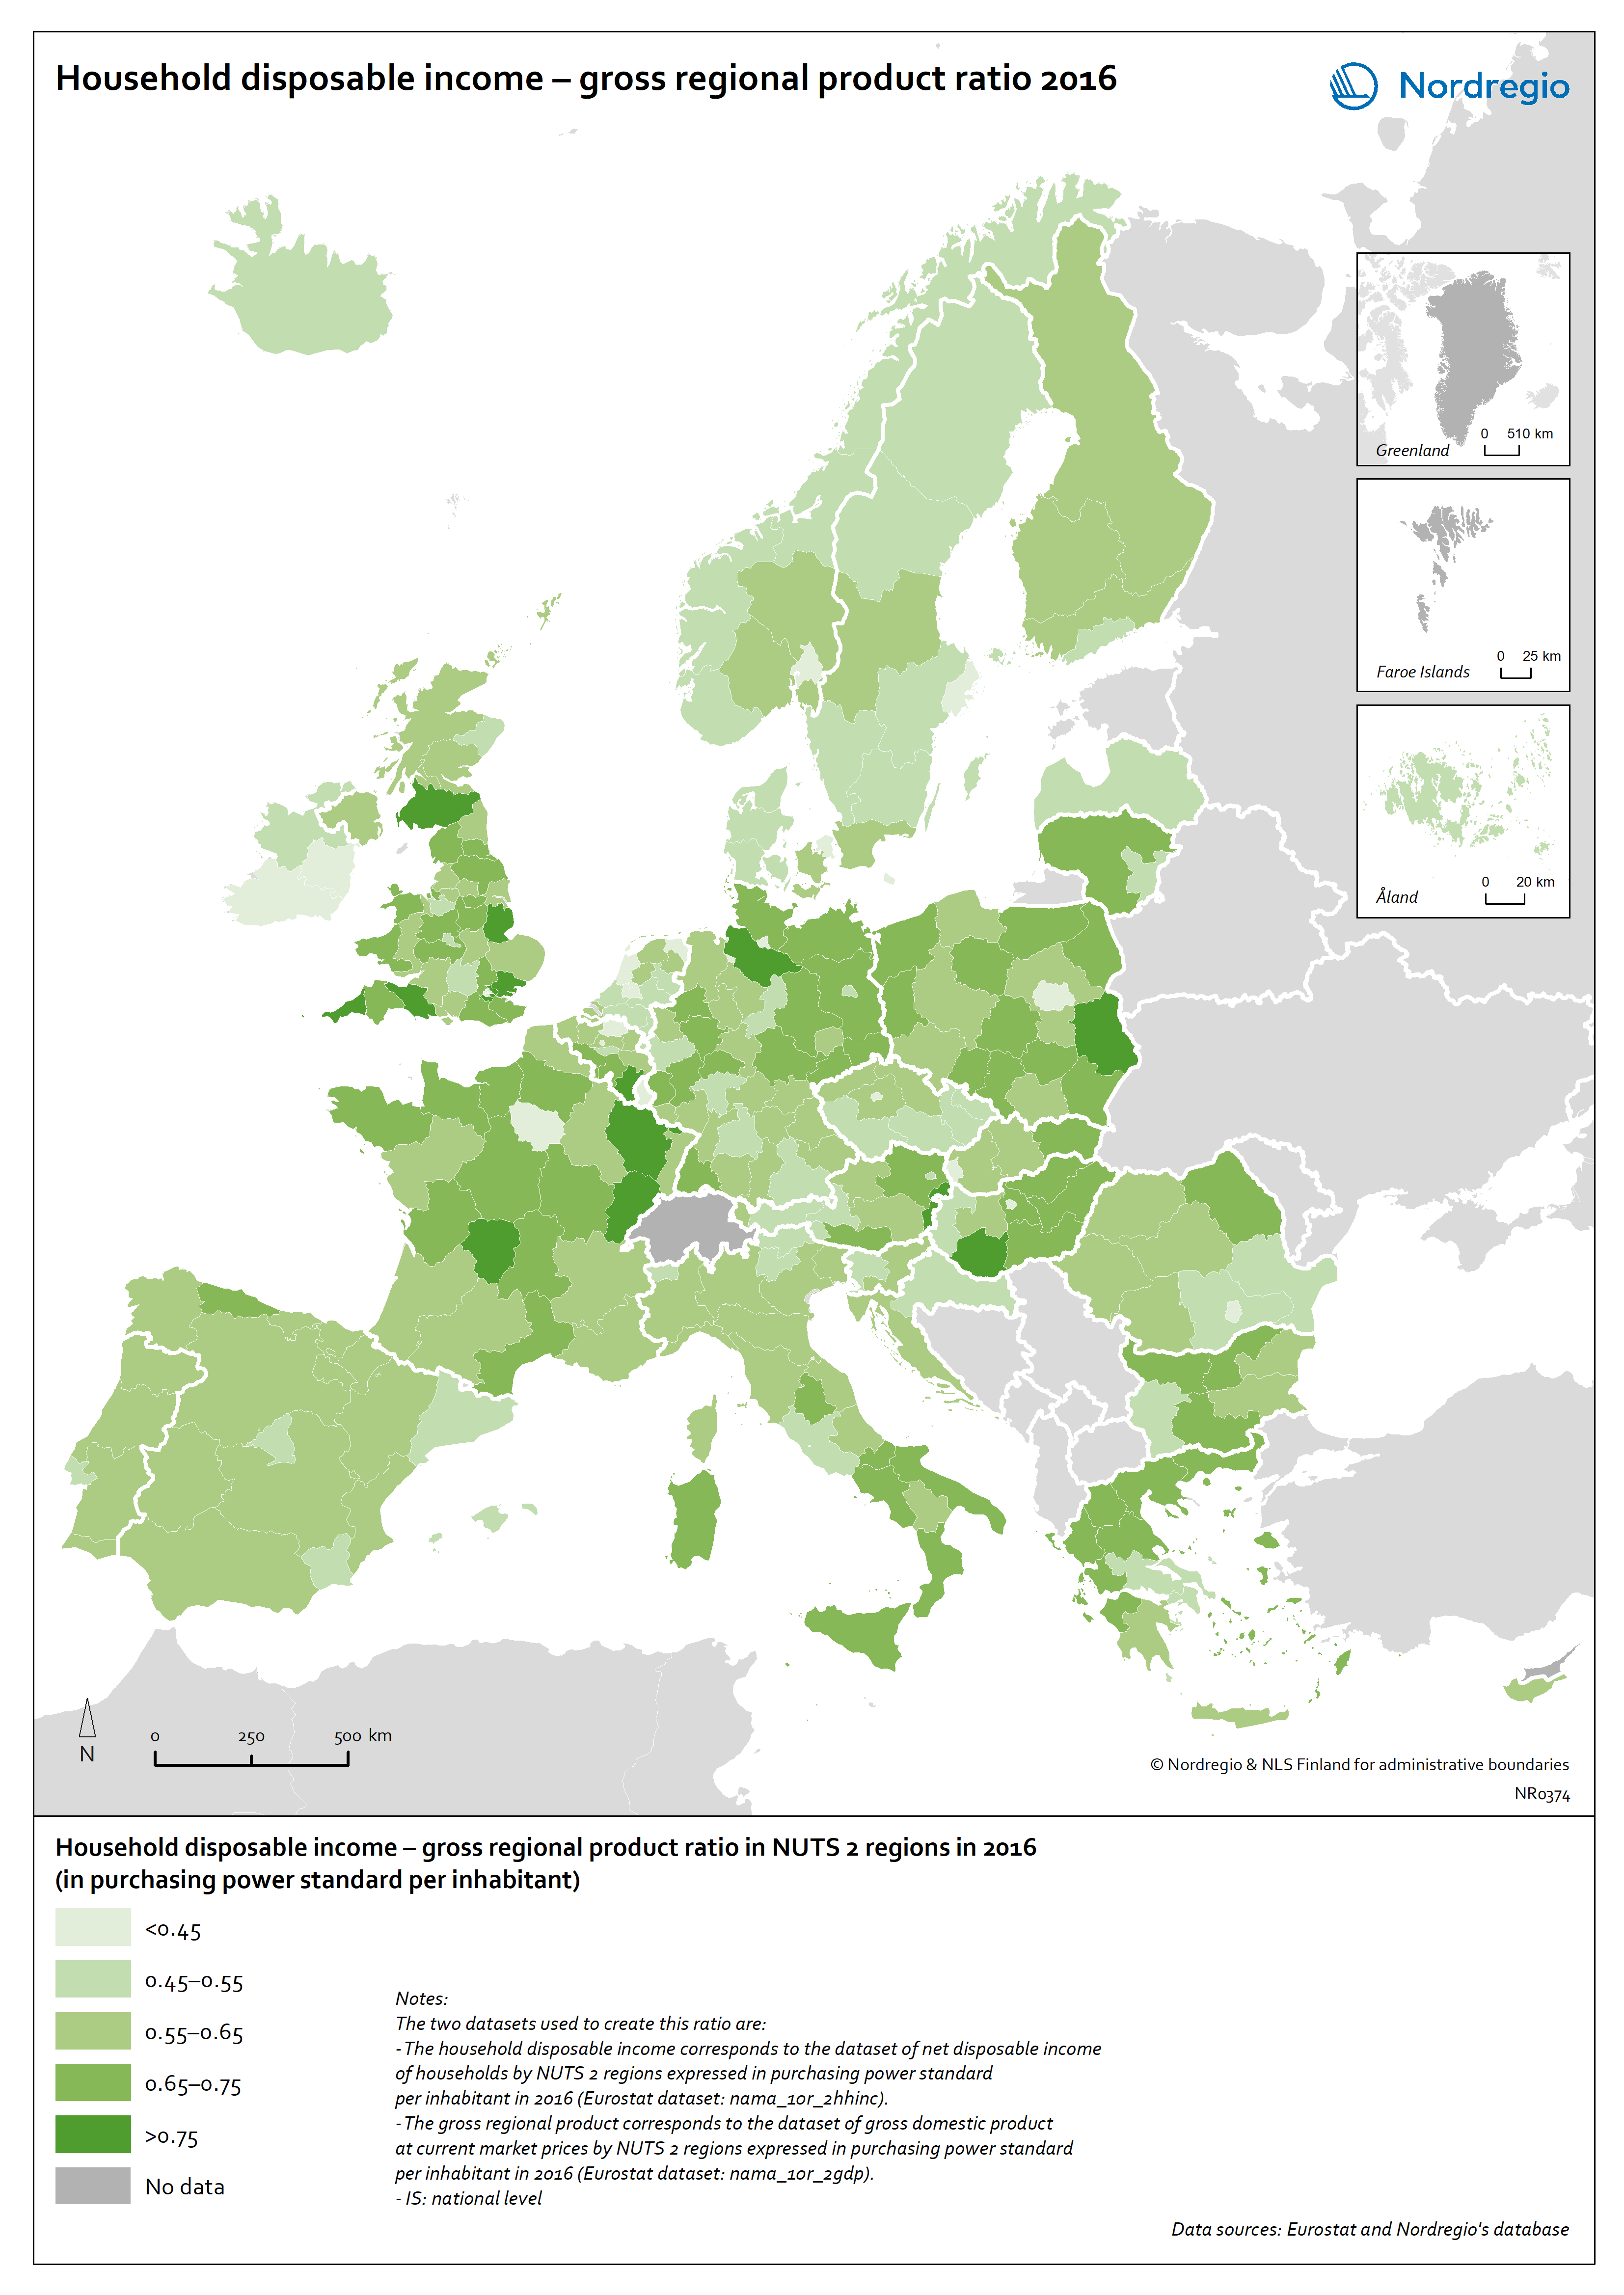
This map shows the ratio between household disposable income (HDI) and gross regional product (GRP) at regional level across Europe in 2016.

A ratio of around 1 indicates that HDI and GRP are at a similar level, in which case GRP could be an accurate measure of individual material wellbeing. A lower value indicates a greater difference between the two values, meaning that GRP cannot be used as a proxy for highlighting the economic situation of the population in a region.
The ratio between HDI and GRP for European regions in 2016 ranges from 0.24 to 0.92, with an average of 0.60. Regions with the lowest ratio are mostly capital city regions, although regions of Ireland also have a low ratio. This is partly due to the presence of large companies transferring some of the generated income to foreign countries (e.g. the country where the company’s headquarter is located). Regions, where HDI is similar to GRP, are mostly peripheral regions in countries such as France, Hungary, Poland and the United Kingdom, for instance in Southern Scotland (0.91).
In the Nordic regions (NUTS 2 level), the value of HDI is on average half the value of GRP, meaning that GRP cannot be used as a good proxy for highlighting the economic situation of the population in these regions. Many regions in Norway and Sweden, as well as Iceland, are close to this Nordic average value of 0.52, which is lower than the European average.
Read the digital publication here.


