This map shows the internal net migration in 2021 as a percentage of the total population.
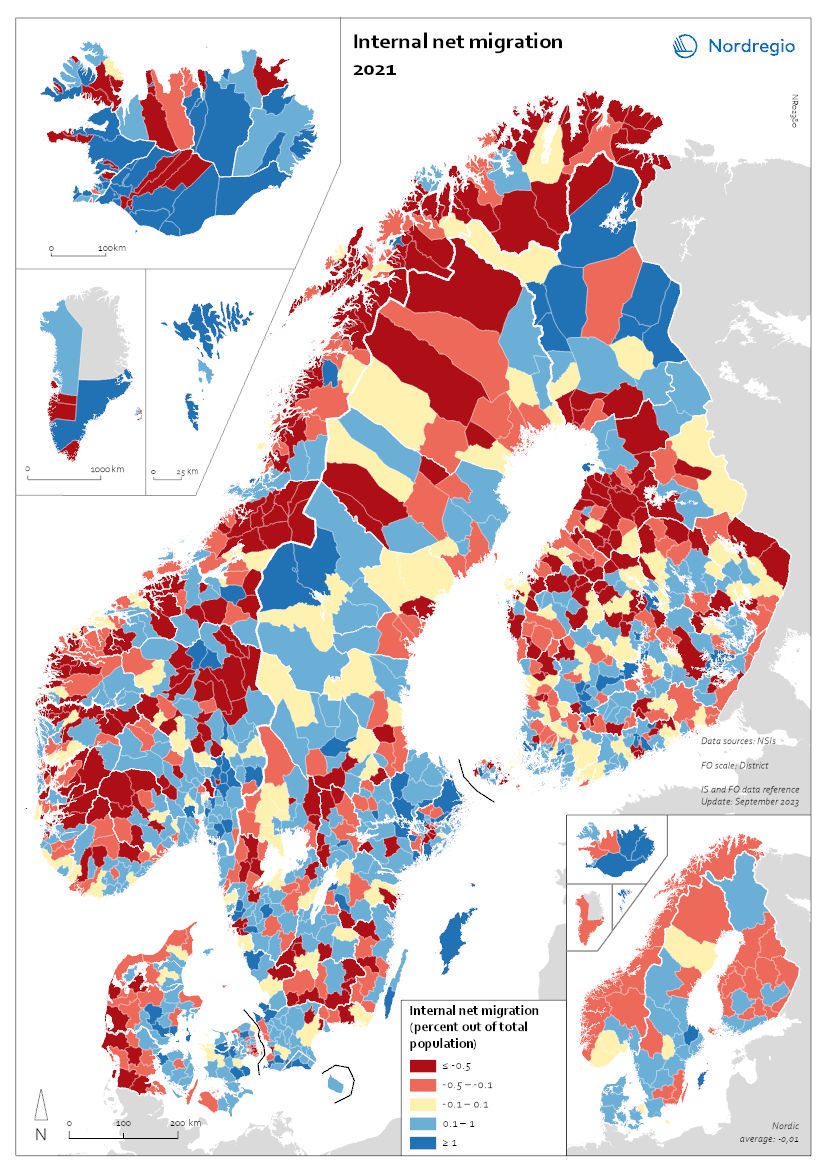
This map shows the internal net migration in 2021 as a percentage of the total population. The small map shows the result on a regional level, and the big map on the municipal level. Internal (sometimes referred to as domestic) net migration refers to migration between municipalities and regions within the same country. International migration is excluded.
In 2021, internal net migration was positive (indicated by shades of blue) or at least balanced (shown in yellow) in many of the municipalities in central and northern Sweden and in central and eastern Finland – areas that traditionally were more likely to lose population due to internal migration. Conversely, several municipalities in the capital regions – such as Stockholm, Oslo, and Copenhagen – exhibited negative internal net migration. Iceland, Greenland, and Åland exhibited mixed internal migration flows, with some municipalities experiencing positive net migration while others faced negative net migration. The Faroe Islands stand as an exception, maintaining only positive internal migration at the municipal level for this year.


