This map shows a typology that divides the Nordic municipalities and regions into four migration categories: positive net migration for both males and females (green on the map), positive male net migration (blue on the map), positive female net migration (yellow on the map), and negative net migration for both males and females (red on the map).
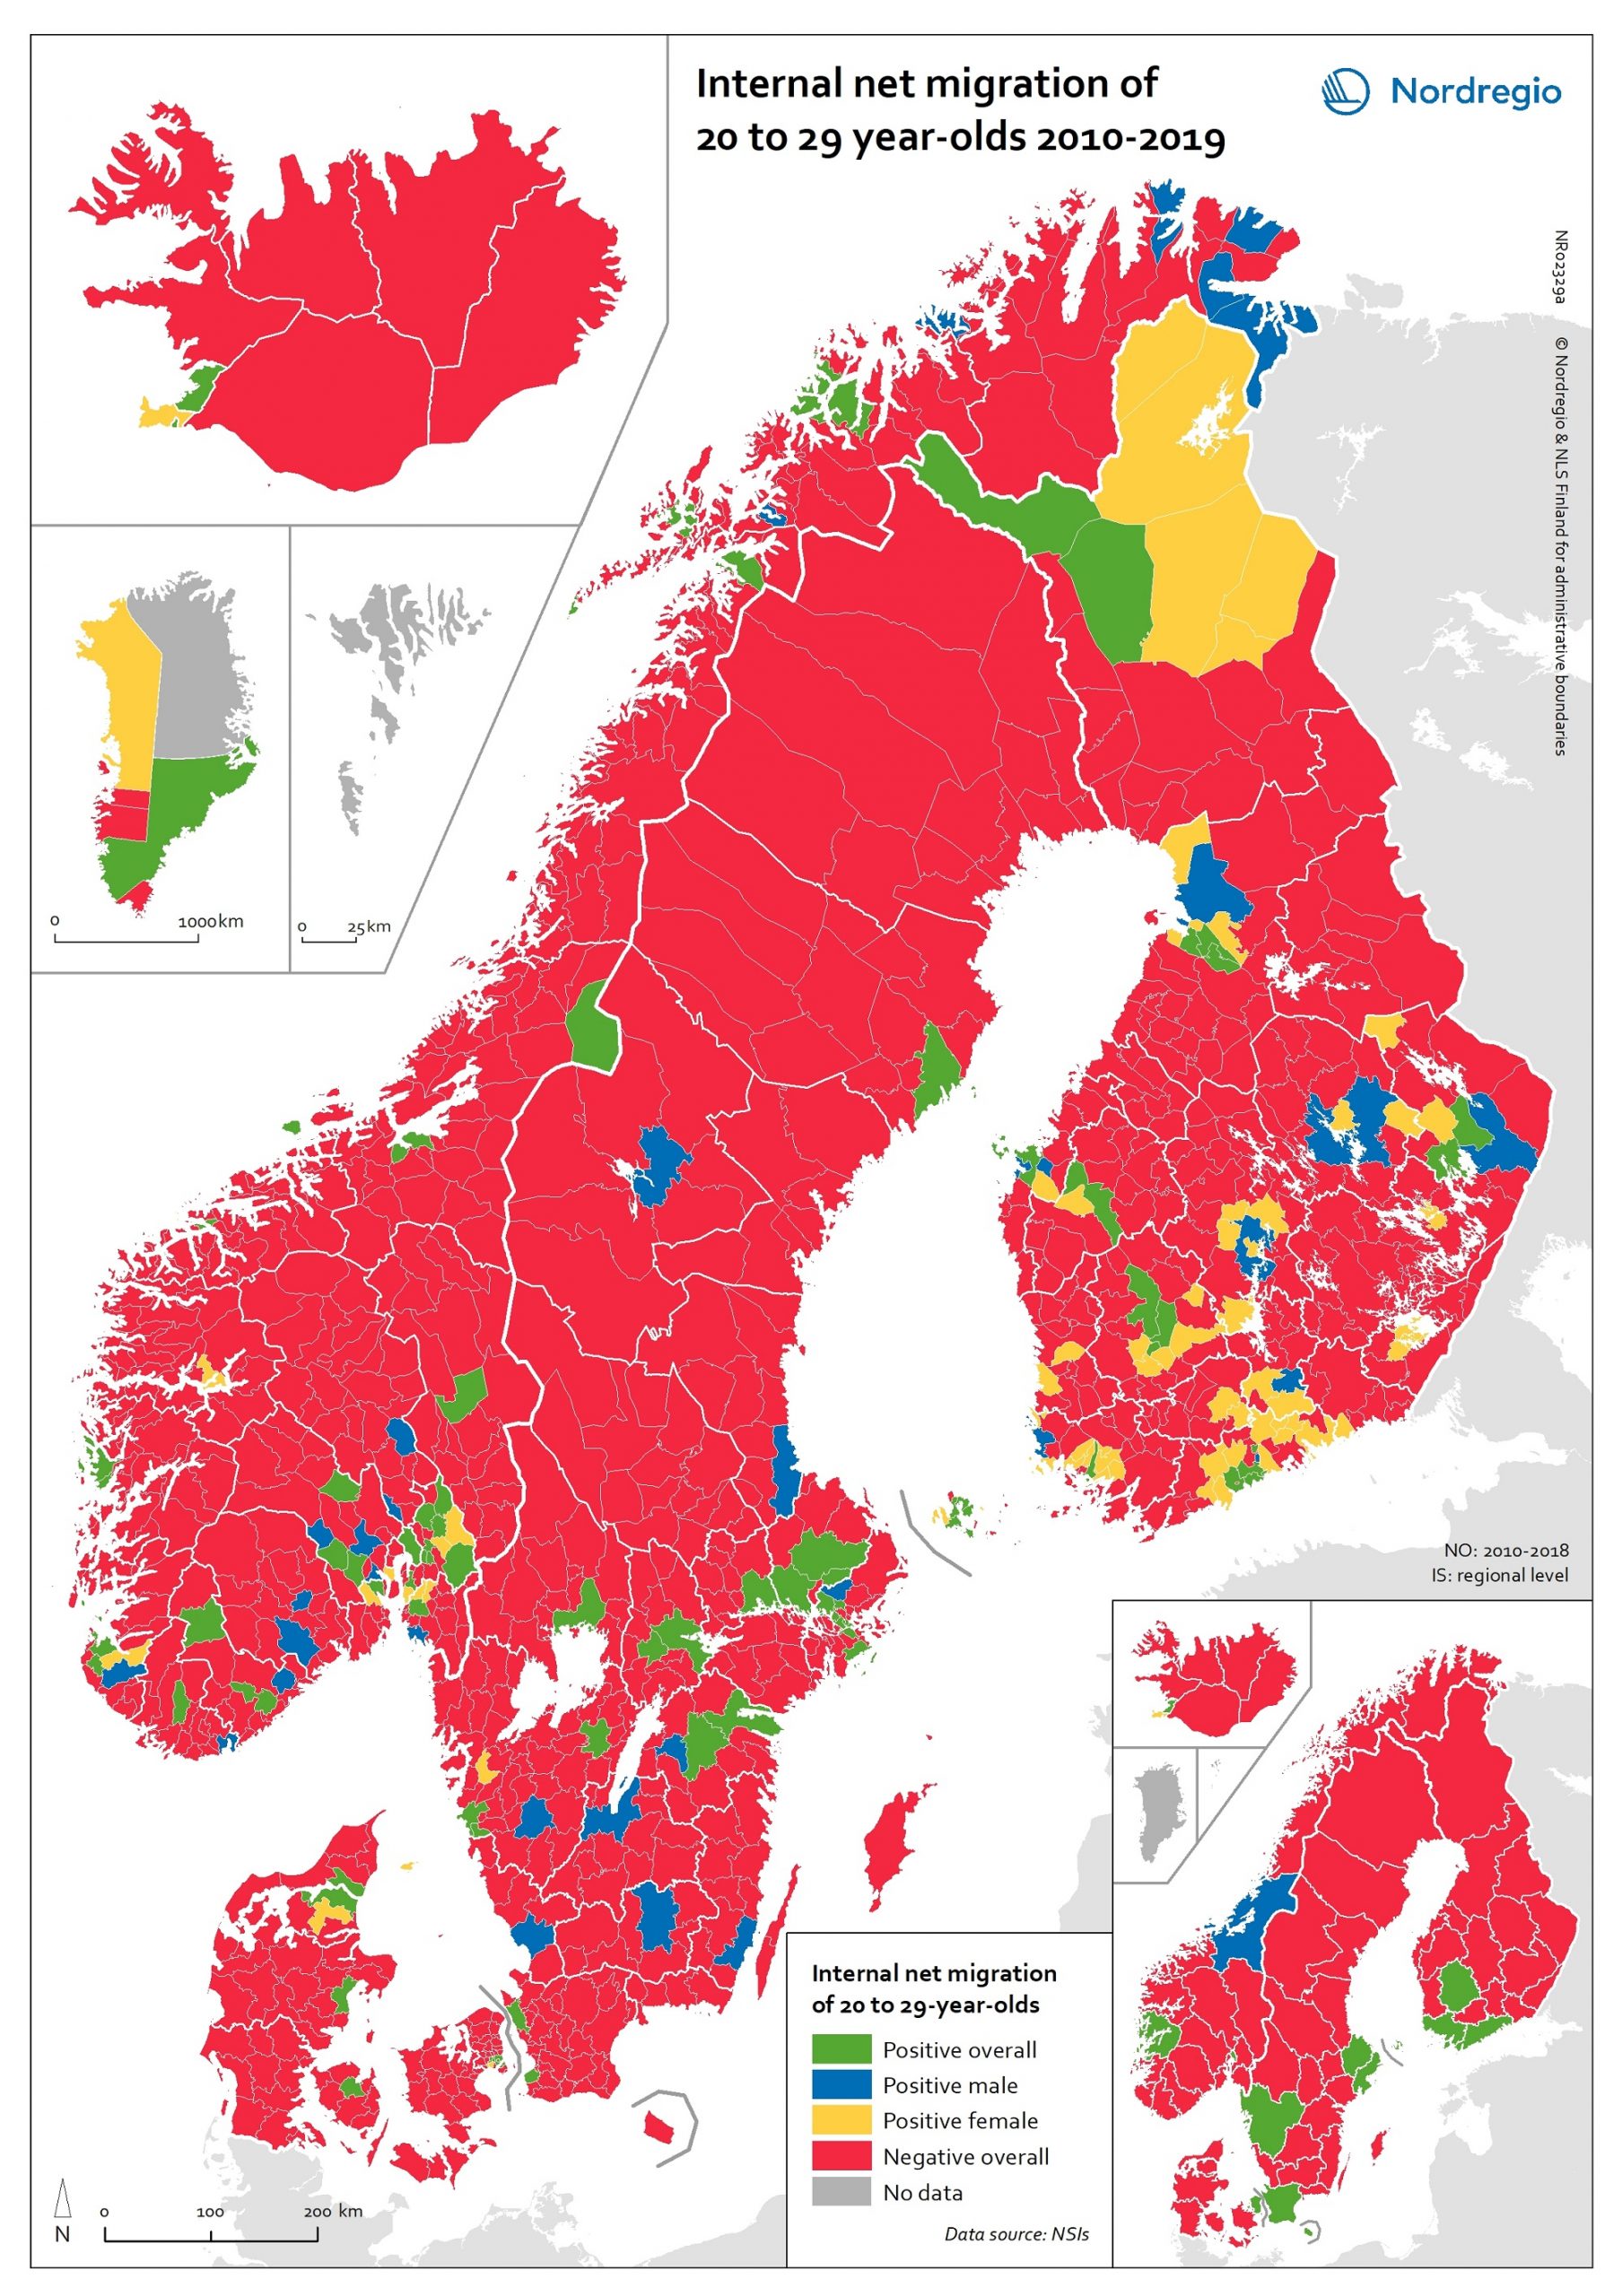
These migration flows of 20 to 29-year-olds are of interest since there is a particularly high level of internal migration among young adults across the Nordic countries compared to other EU countries. While the map shows that the great majority of municipalities experience negative net migration of young adults in favour of a few functional urban areas and some larger towns, it is possible to observe a number of exceptions to this general rule.
The rural municipalities of Utsira, Moskenes, Valle, Smøla, Ballangen and Lierne in Norway have the highest positive net migration rates both for men and women. There are also positive net migration rates for males and females in the peripheral municipalities of Jomala, Kittilä, Lemland and Finström in Finland and Åland. There is positive male net migration but negative female net migration in Gratangen, Loppa, Gamvik, Drangedal and a few other Norwegian rural municipalities, plus Mariehamn in Åland, while several municipalities in remote areas of Finland have positive female net migration but negative male net migration. Some of these patterns may be related to specialised local labour markets, such as fisheries in Loppa, or recreational tourism in Kittilä.
In general, the pattern of net migration among young adults is more diverse in Finland (where 72.0% of all municipalities have negative net migration), compared with 84.6% in Norway, 88.9% in Denmark and 89.0% in Sweden. However, it is important to remember that Danish, Finnish and Norwegian municipalities are smaller in size than their counterparts in the rest of the Nordic Region. These distinctions may impact the results shown by this map. The regional map shows that, with the exception of Suðurnes (Iceland), only regions including major cities experienced positive net migration of young people aged 20-29 years. In Trøndelag (Norway) this trend was only evident for males.
