These map show the number of jobs in the agriculture, forestry and fisheries sectors (NACE A sectors) as a share of the total employment in 2017 (left) and 2009-2017 change (right).
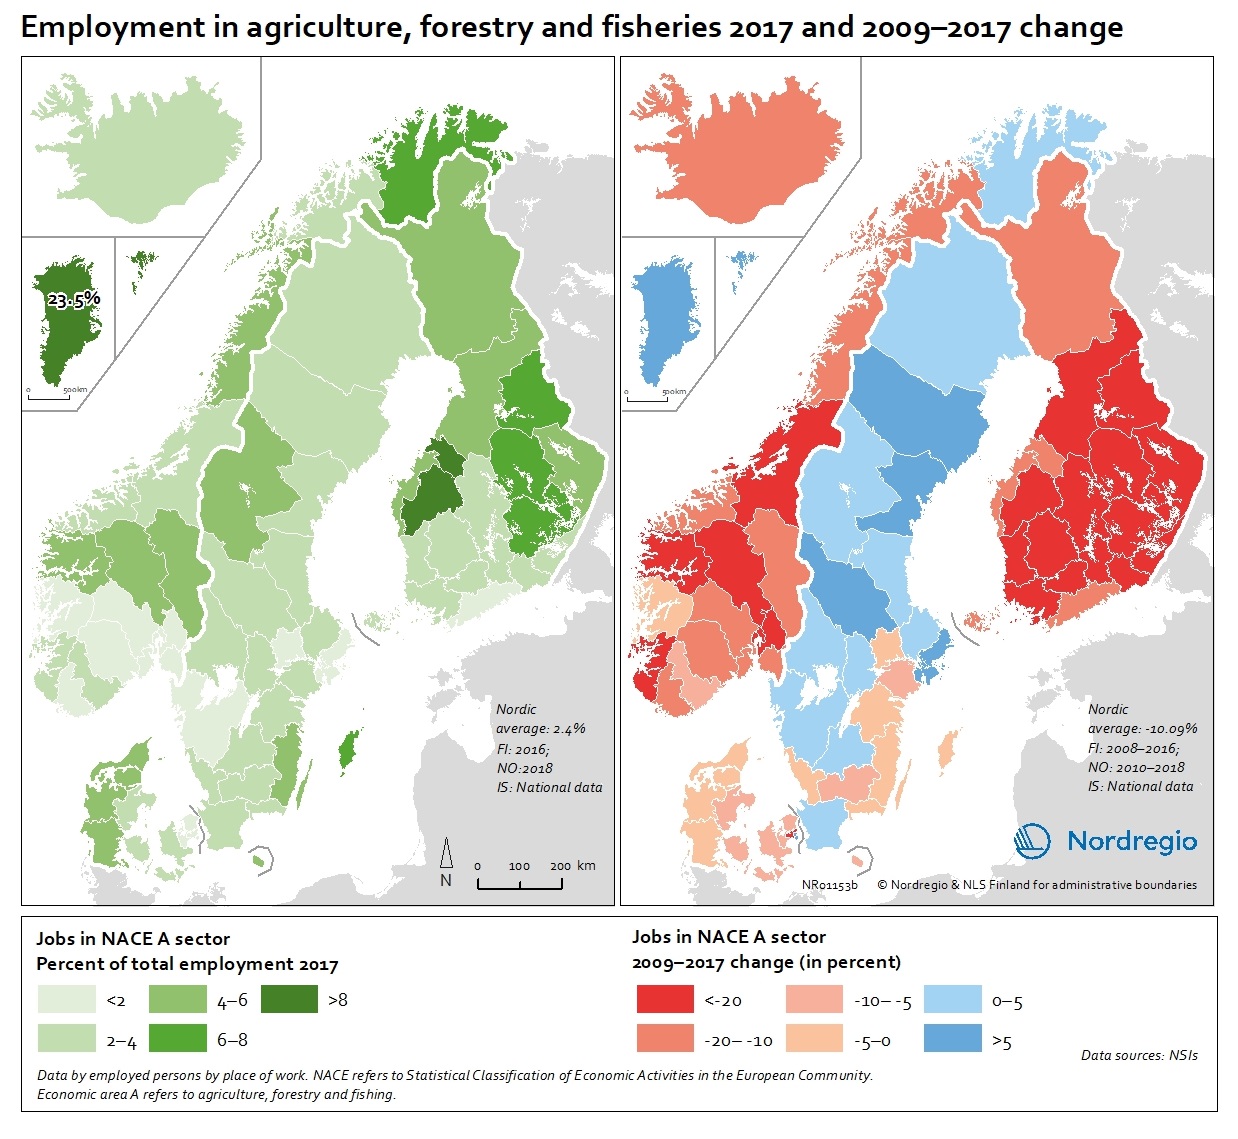
The map (left) indicates ranges of people employed in agriculture, forestry and fisheries sectors between below 2% to above 8%, with the highest proportion being in Greenland with 23.5% in 2017. In the EU-28, the overall proportion of the total workforce with jobs in the NACE-A sectors is an average of 4.6%. Overall, the NACE-A sectors show a sharp decline in employment (right map), particularly in Finland, Iceland and Norway (except northern Norway), where the decline was up to 20% between 2009 and 2017.
Read the digital publication here.