This map shows the proportion of the population aged 80 years or over at municipal and regional levels in 2019.
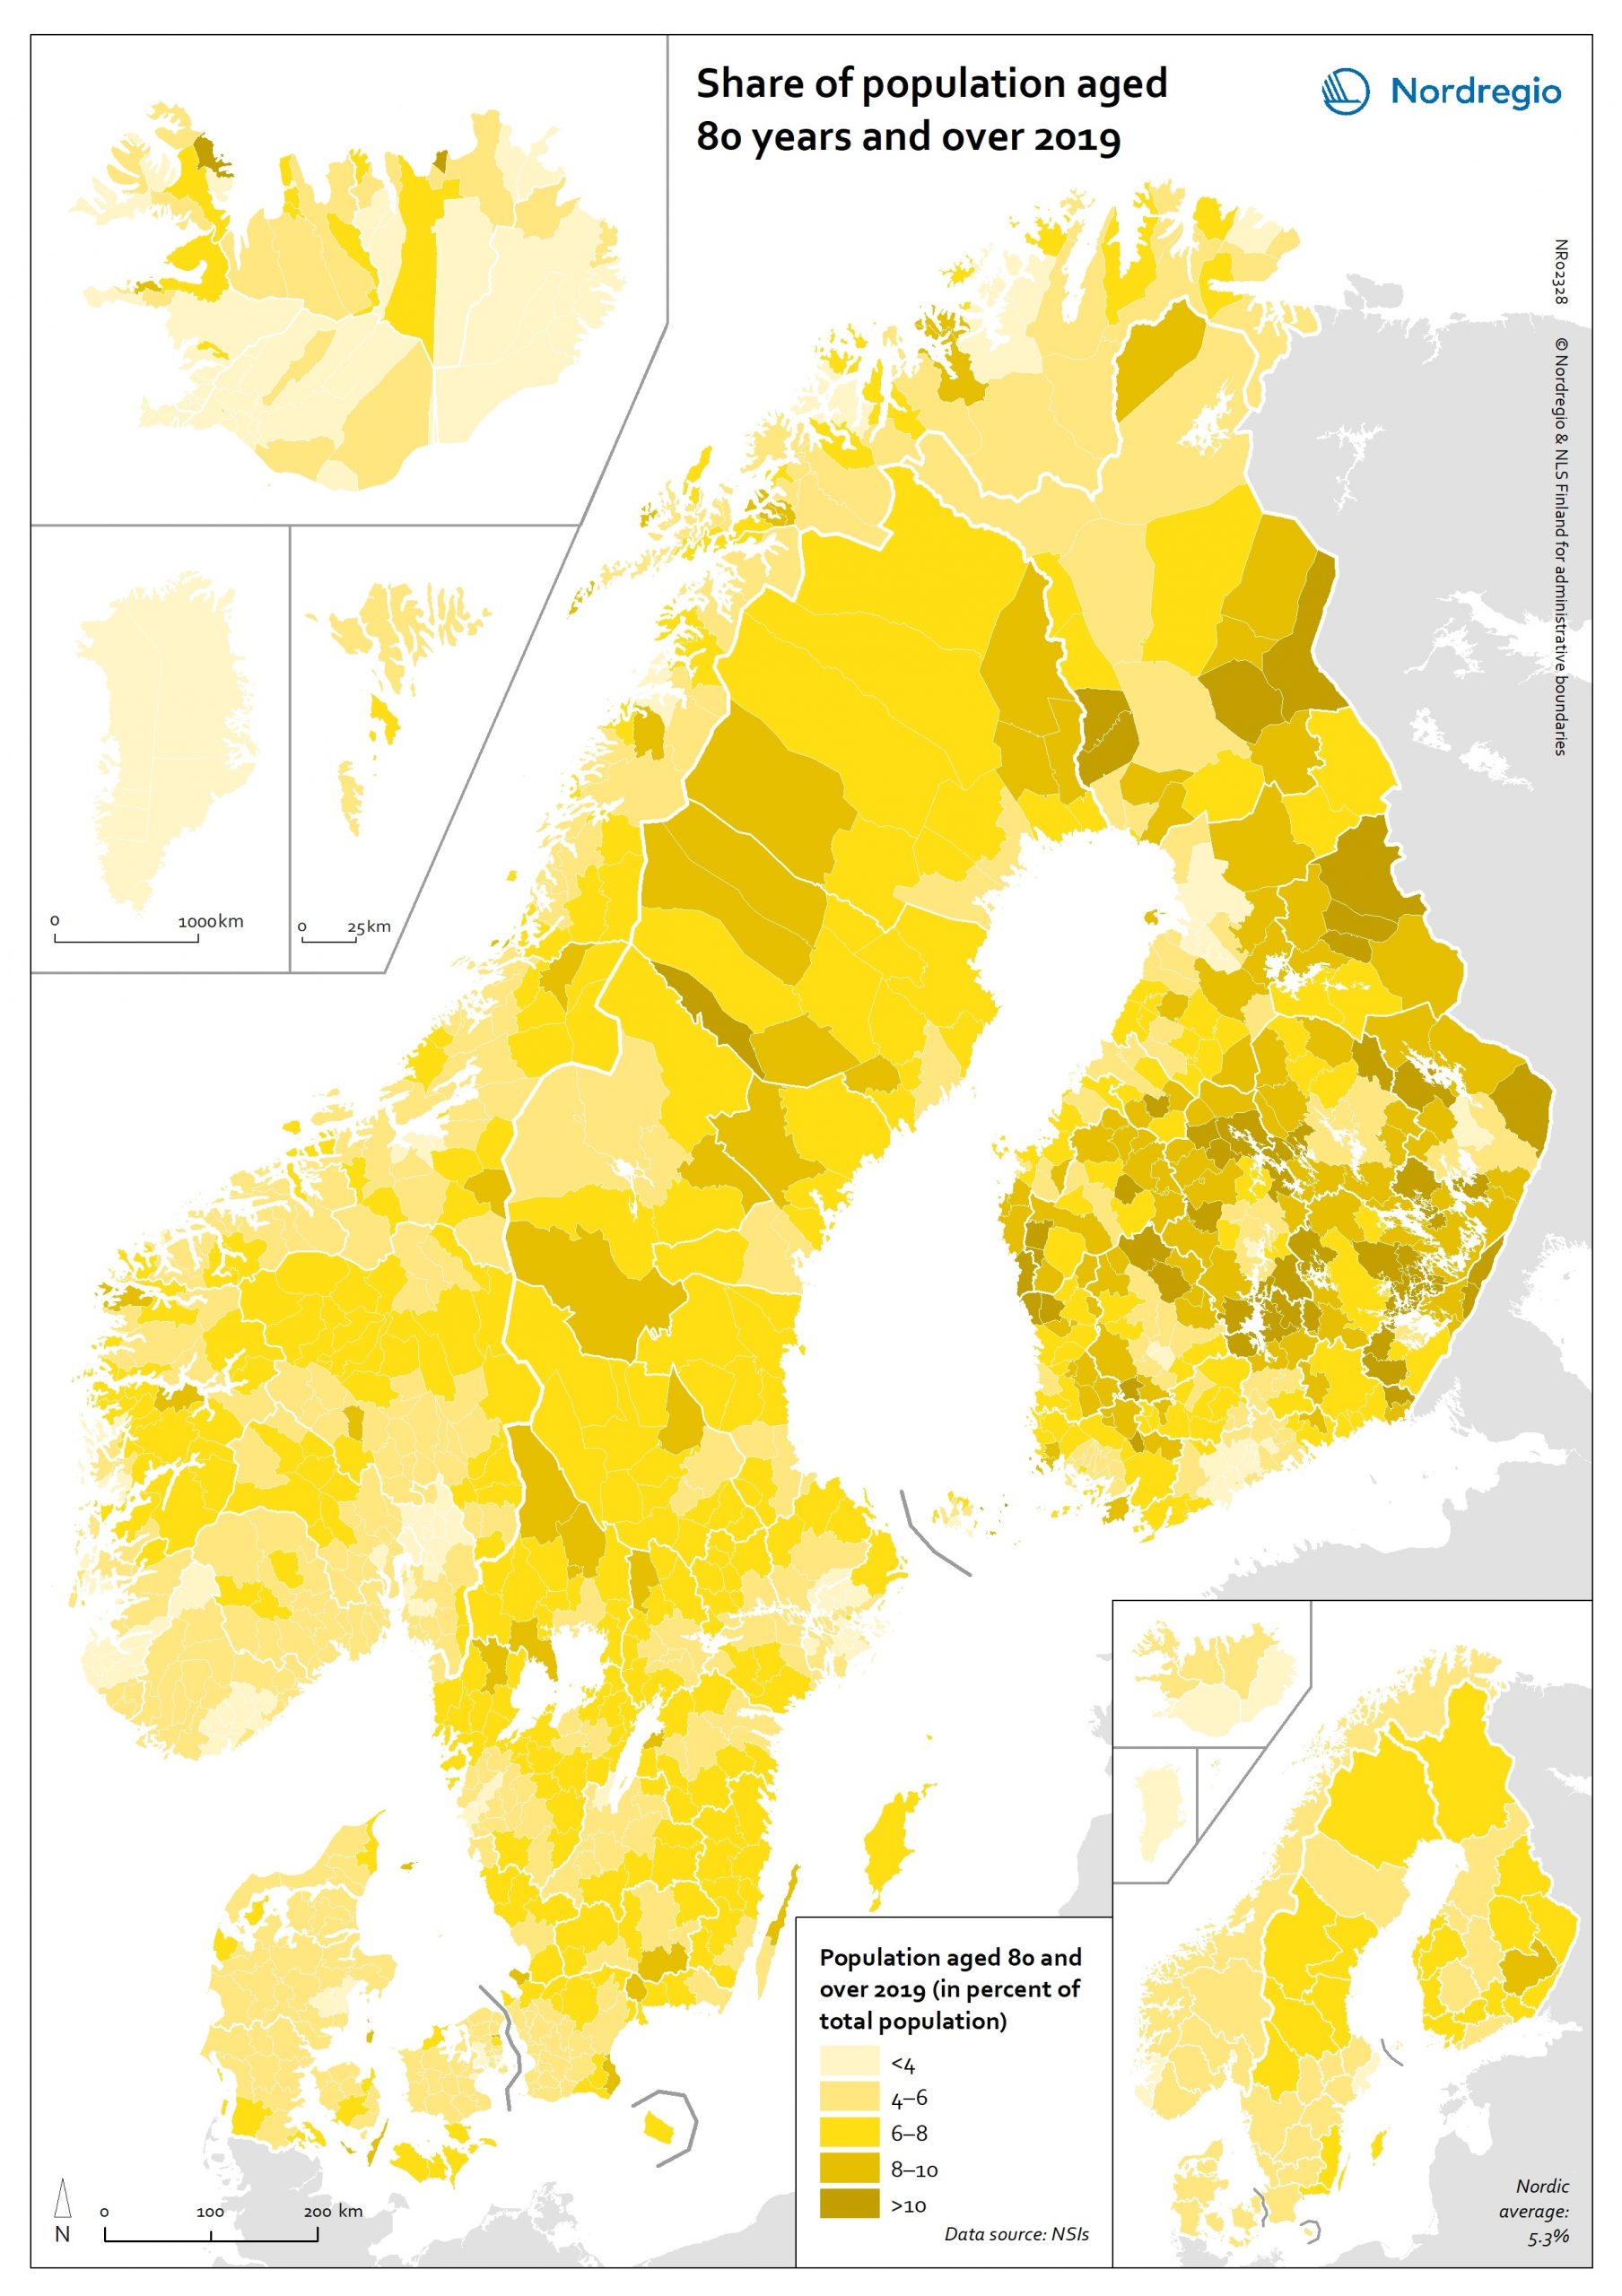
These figures are of particular interest as they provide an overview of those municipalities with an unbalanced age distribution in terms of the over-representation of elderly people, which may hamper their ability to provide welfare services. The darker shades on the map represent higher proportions, and the lighter shades reflect lower proportions. There is a large within-country variation between municipalities in Iceland (from 0.8% to 14.0%) and Finland (from 2.4% to 14.0%), while the share of those aged 80 years and over varies from around 2.0% to 10.0% in the municipalities of Denmark, Norway, and Sweden.
Greenlandic municipalities have a low proportion (between 0.6% and 1.5%), and there is also a low level of variation between the municipalities of the Faroe Islands (varying from 4.0% to 6.8%). When looking at the regional picture, within-country differences are evened out, particularly in Denmark, Norway, and Iceland. Across the Nordic Region as a whole, those municipalities having the highest proportions of elderly people within their populations follow the pattern of municipalities experiencing a decrease in population to a significant extent, except in Greenland.
