This map shows the total population change by municipality in the Nordics between 1990 and 2022 (Iceland: 1992–2022).
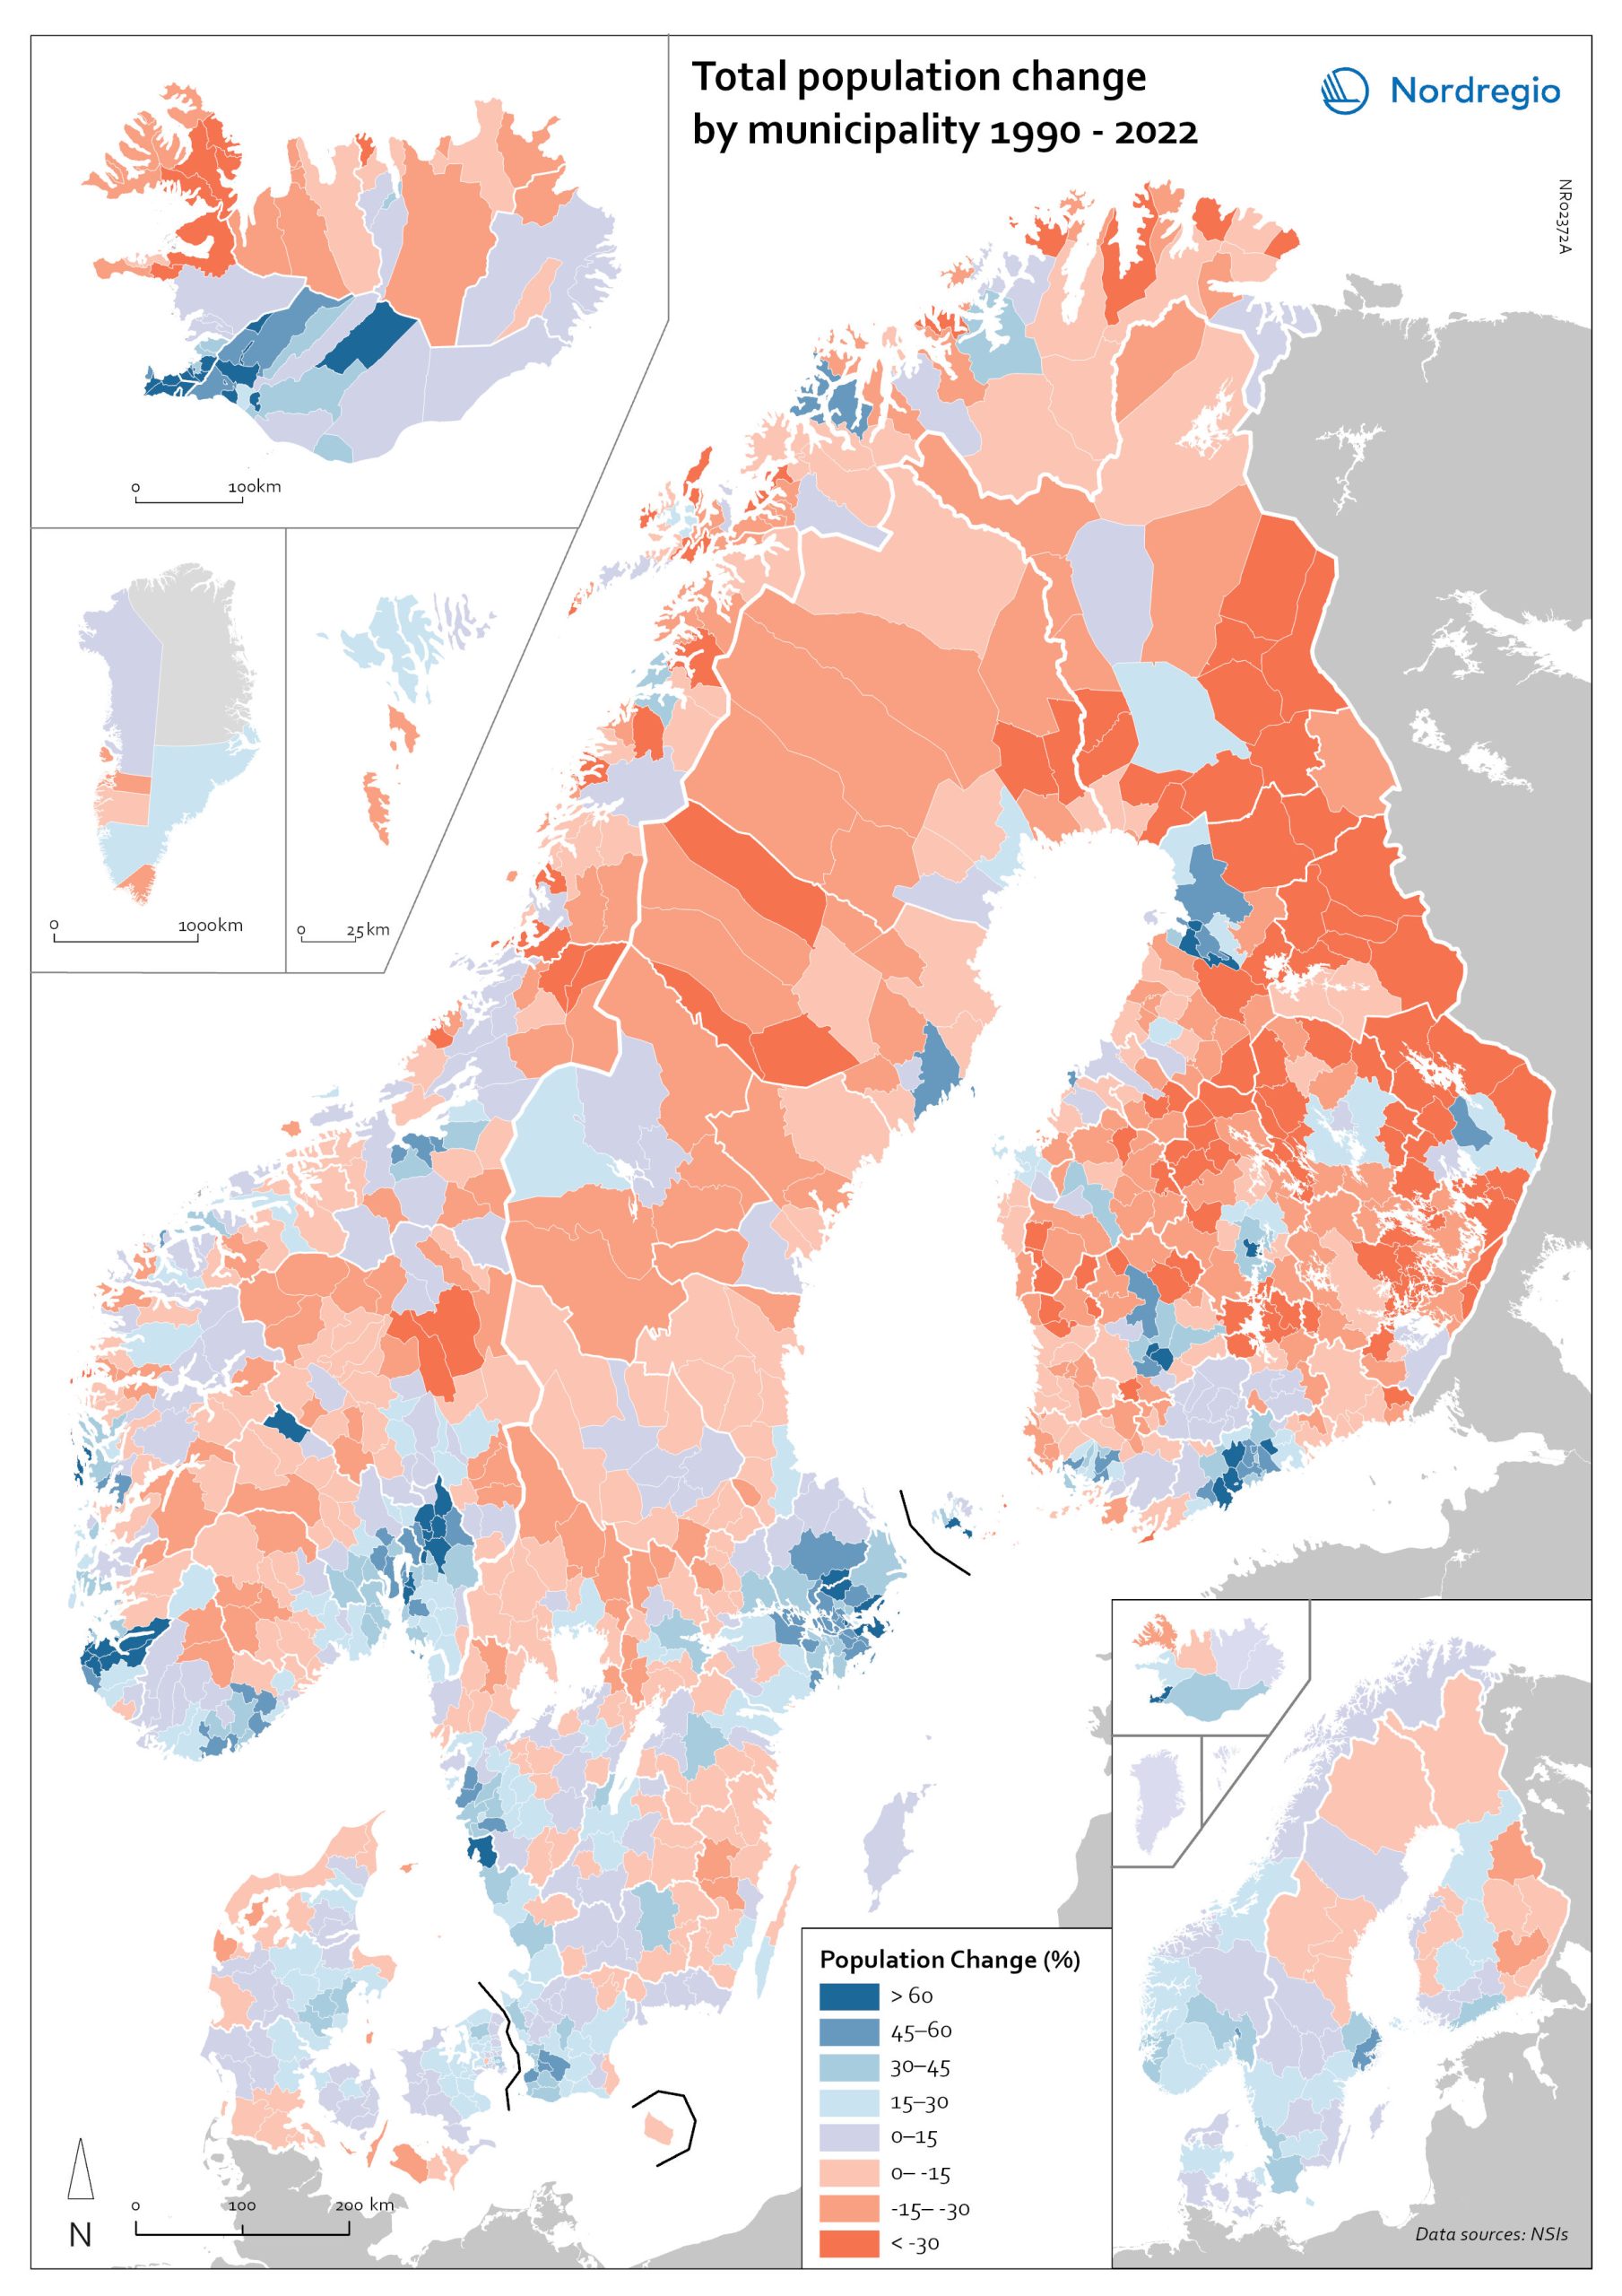
This map displays the total population change (percentage) by municipality (main map) and by region (inset map) between 1990 and 2022. For Iceland, the data covers the period 1992–2022 instead, due to the lack of municipal-level population data prior to 1992. Total population change refers to the percentage change in the number of residents over the period. Red shades indicate population decline, and blue shades indicate population growth.
Population developments have varied widely across the Nordic region over the past three decades. Most urban areas and their surrounding commuter zones have seen strong population growth (typically over 30% and in some cases more than 60%), driven by both natural increase and migration. This pattern is particularly visible around the metropolitan regions of Stockholm, Oslo, Copenhagen, Helsinki, and Reykjavík, as well as university cities such as Uppsala, Lund, Aarhus, Trondheim, and Tampere, and other regional centres.
In contrast, many rural and remote municipalities have experienced long-term population decline. Structural economic changes, ageing populations, and out-migration of young adults have contributed to shrinking populations in large parts of northern and inland Finland and Sweden, as well as rural Norway and Denmark.
There are, however, notable exceptions. Several municipalities in Iceland, along parts of the Norwegian coast, and in selected areas of southern Sweden and Denmark have recorded population growth outside the largest metropolitan zones. This highlights how demographic trends are shaped by a combination of economic opportunities, migration patterns, and local demographic structures.


