The map presents a typology of internal net migration by considering average annual internal net migration in 2020-2021 alongside the same figure for 2018-2019.
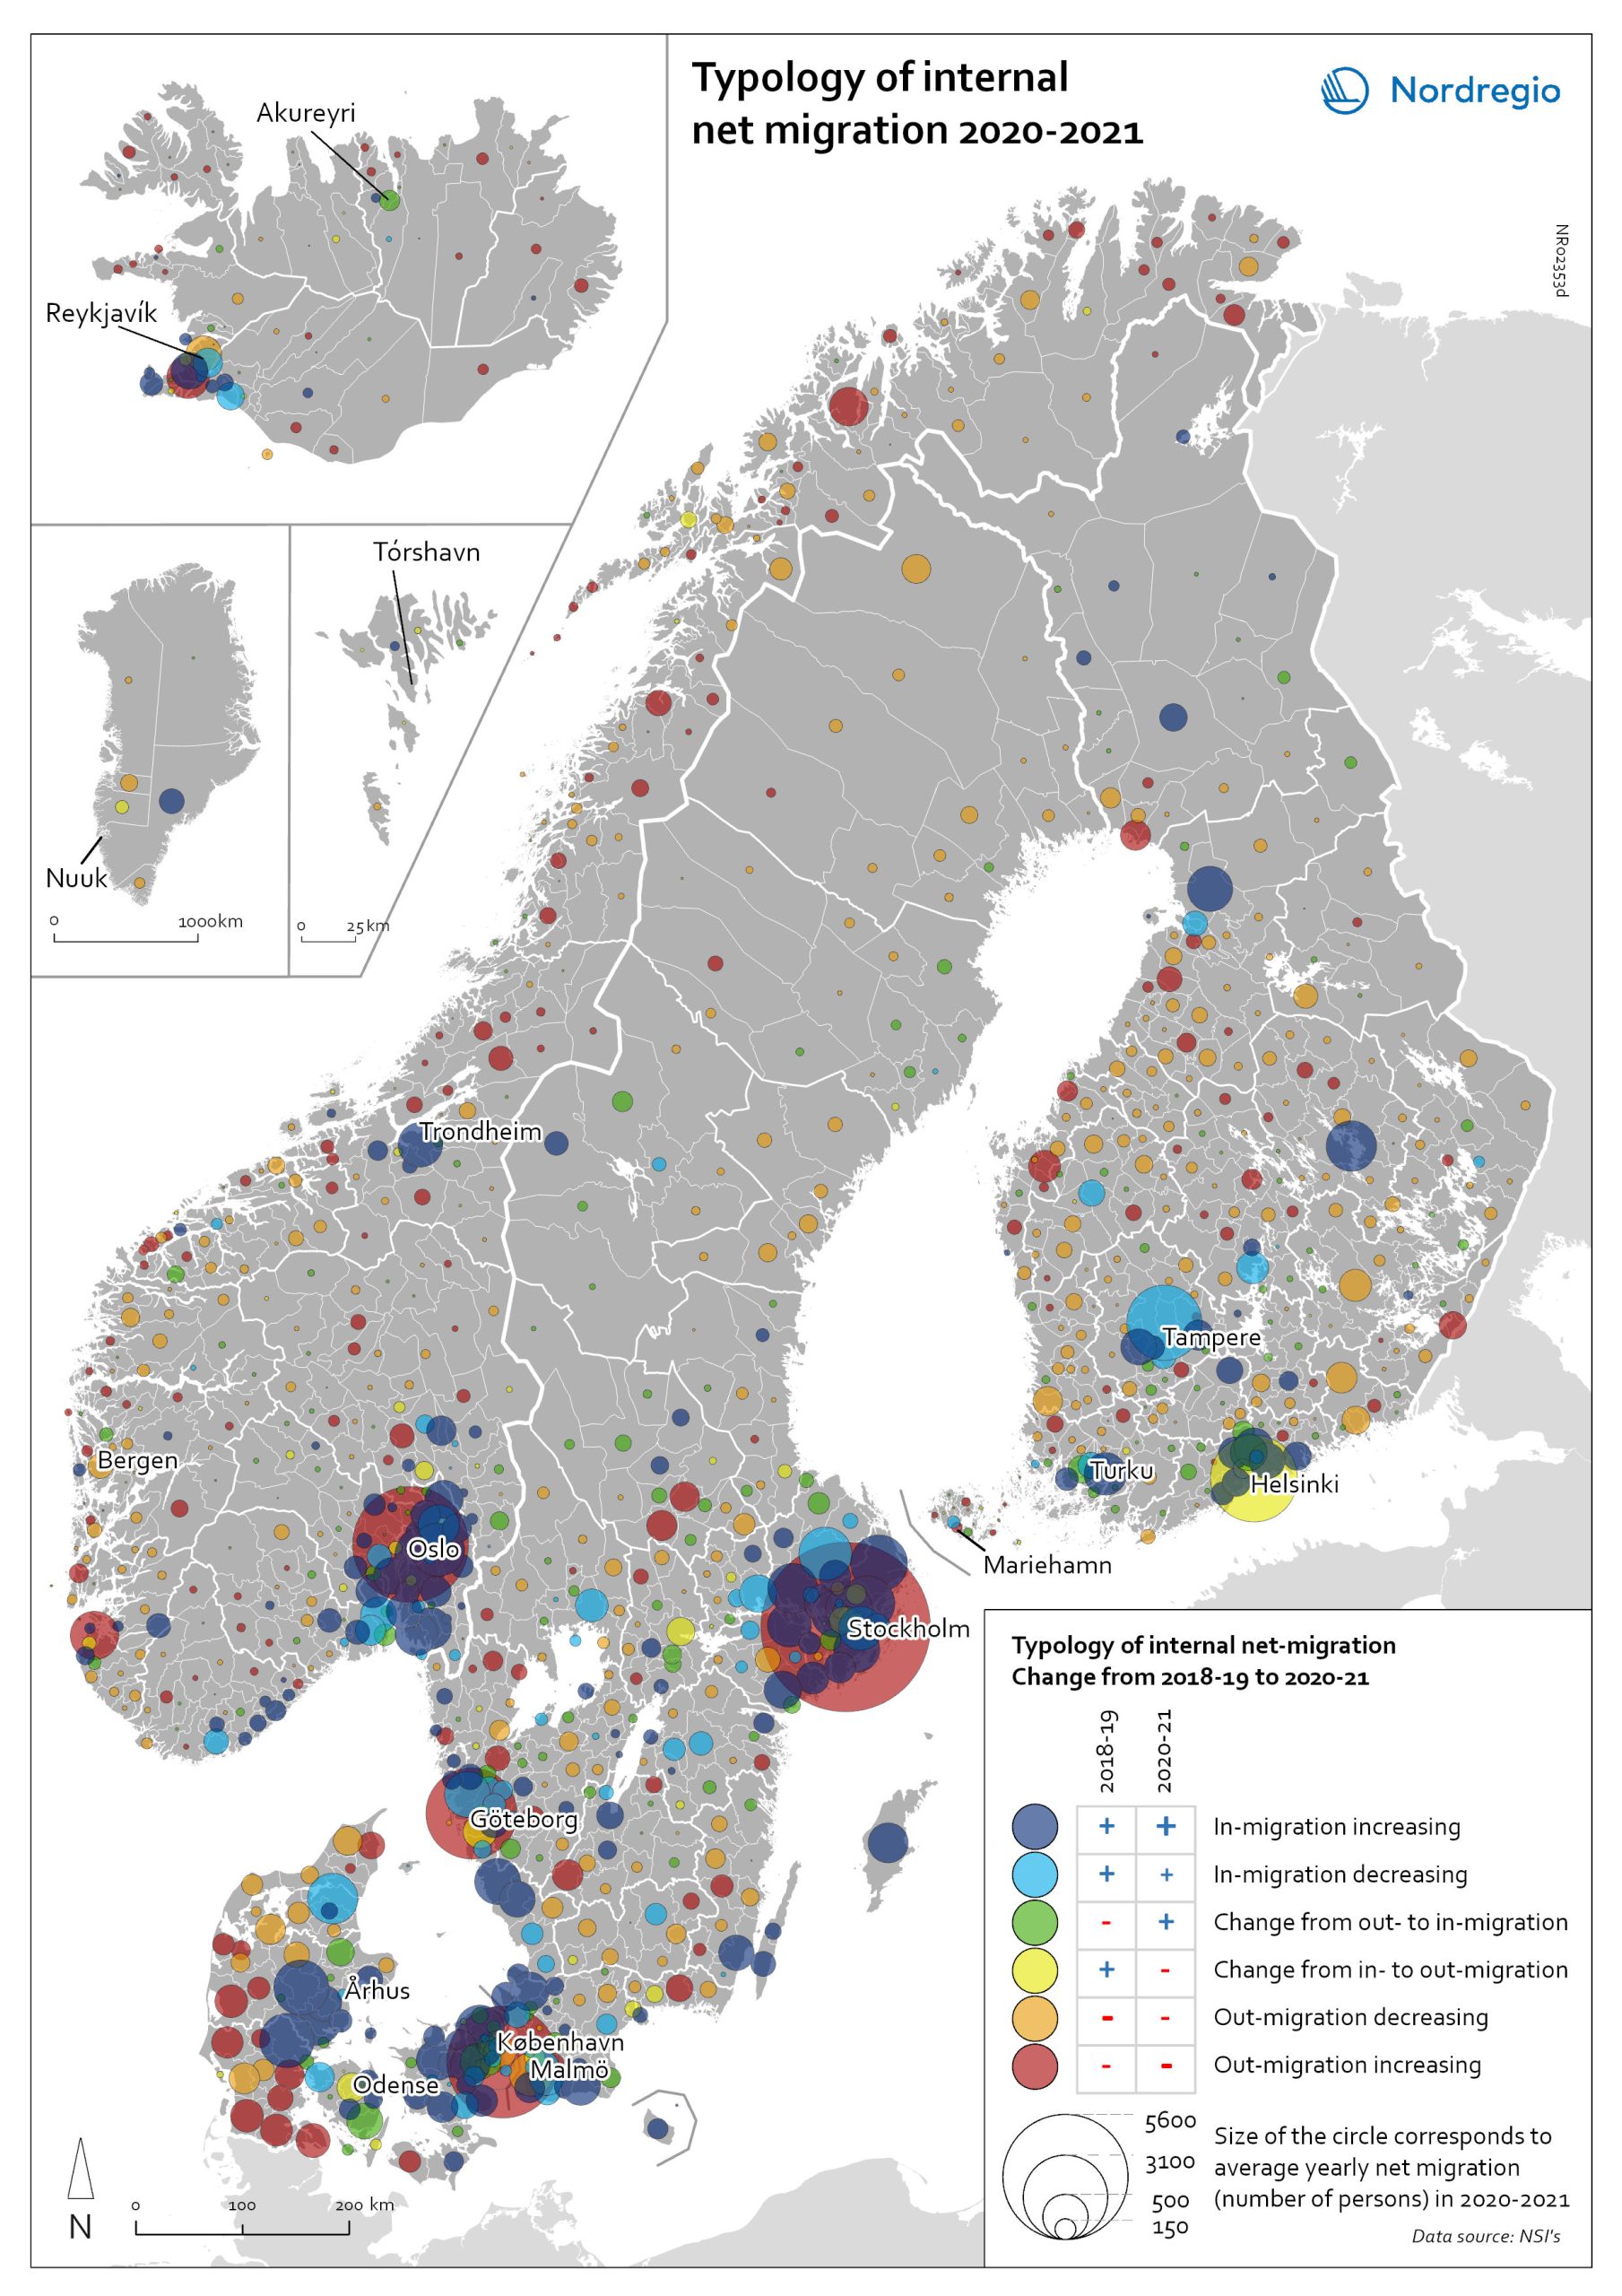
The colours on the map correspond to six possible migration trajectories:
- Dark blue: Internal net in migration as an acceleration of an existing trend (net in-migration in 2020-2021 + increase compared to 2018-2019)
- Light blue: Internal net in migration but at a slower rate than previously (net in-migration in 2020-2021 + decrease compared to 2018-2019)
- Green: Internal net in migration as a new trend (net in-migration in 2020-2021 + change from net out-migration compared to 2018-2019)
- Yellow: Internal net out migration as a new trend (net out-migration in 2020-2021 + change from net in-migration compared to 2018-2019)
- Orange: Internal net out migration but at a slower rate than previously (net out-migration in 2020-2021 + decrease compared to 2018-2019)
- Red: Internal net out migration as a continuation of an existing trend (net out-migration in 2020-2021 + increase compared to 2018-2019)
The patterns shown around the larger cities reinforces the message of increased suburbanisation as well as growth in smaller cities in proximity to large ones. In addition, the map shows that this is in many cases an accelerated (dark blue circles), or even new development (green circles). Interestingly, although accelerated by the pandemic, internal out migration from the capitals and other large cities was an existing trend. Helsinki stands out as an exception in this regard, having gone from positive to negative internal net migration (yellow circles). Similarly, slower rates of in migration are evident in the two next largest Finnish cities, Tampere and Turku (light blue circles). Akureyri (Iceland) provides an interesting example of an intermediate city which began to attract residents during the pandemic despite experiencing internal outmigration prior.
From a rural perspective there are many examples of rural municipalities which have turned their development trajectory from negative to positive in 2020-2021 (green circles). Although many of these municipalities are in proximity to larger urban areas there are also examples of this trend in more sparsely populated regions. Notably, Region Jämtland- Härjedalen and Finnish Lapland, both popular tourist destinations. There are also many rural and remote municipalities which have continued to experience outmigration but at slower rates than prior to the pandemic (orange circles). This is particularly evident in the north of Sweden but also throughout Norway and Finland and in Region Nordjylland and Region Midtjylland (Denmark).

