The map shows the unemployment rate in the Nordic counties at the municipal level in 2018.
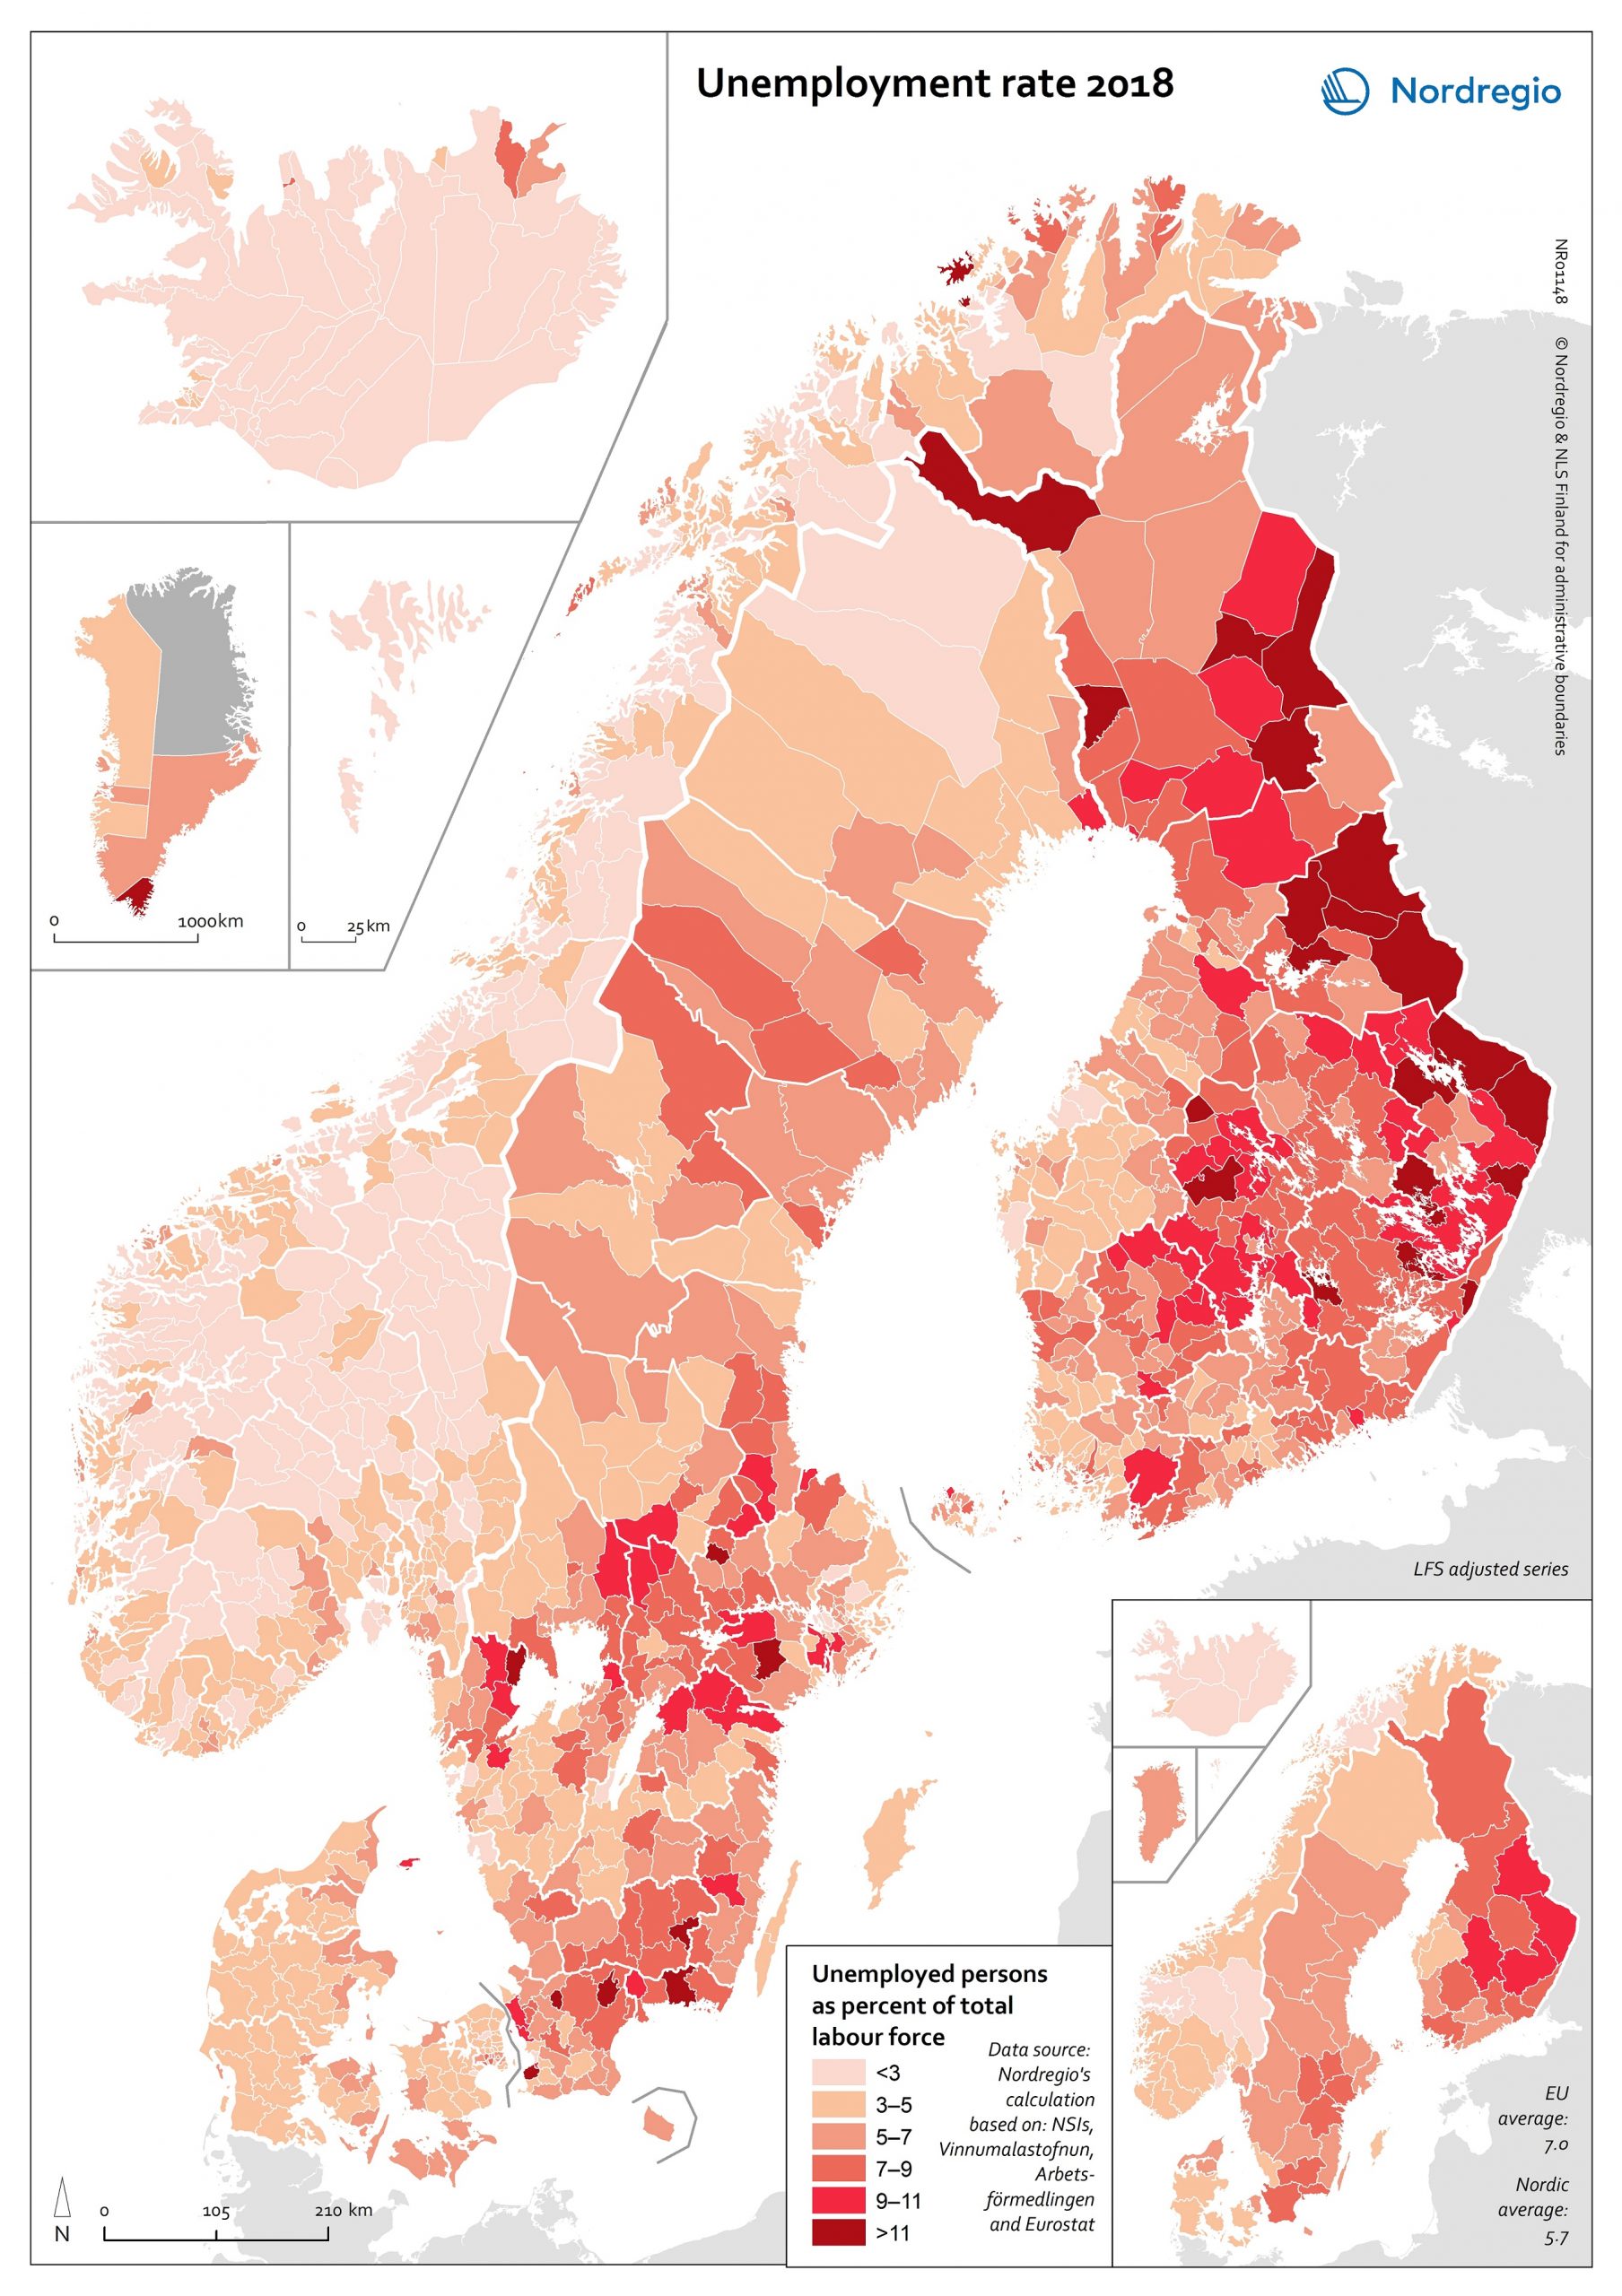
Unemployment is measured as the total number of unemployed (i.e. people who were not in employment, but seeking job and available to take up an employment) as share of the total workforce (i.e. employed plus unemployed). The map is based on data from the labour force survey, which is the official way of measuring unemployment. In order to show the municipal level register data has been used as an allocation key.
The lighter shades on the map represent lower levels of unemployment, and the darker shades represent higher levels. The Nordic Region has a low average unemployment rate (5.7%) compared with the EU average (7.0%). There is, however, substantial regional variation, both within and between countries. The lowest unemployment rates are found in Iceland, Norway and the Faroe Islands. The highest rates can be found in Finland (particularly in the east ern municipalities), parts of southern Sweden, and Kujalleq (Greenland). Unemployment rates in Den mark are higher than those found in Iceland and Norway, but lower than those found in Sweden and Finland – with the highest rates found in Nord Jylland.
The unemployment rate also varies between population groups. In all Nordic countries, for ex ample, the foreign-born population are more likely to be unemployed than their native-born counter parts, particularly if they were born outside the EU (see Figure 4.5). This trend is most pronounced in Sweden and Finland. It can also be observed throughout the EU, where unemployment for foreign-born persons is more than twice that of the native-born population.

