The map shows a typology of European regions by combining information on pre-pandemic unemployment rates with unemployment rates in 2020, based on the annual Labour Force Survey (LFS) that is measured in November.
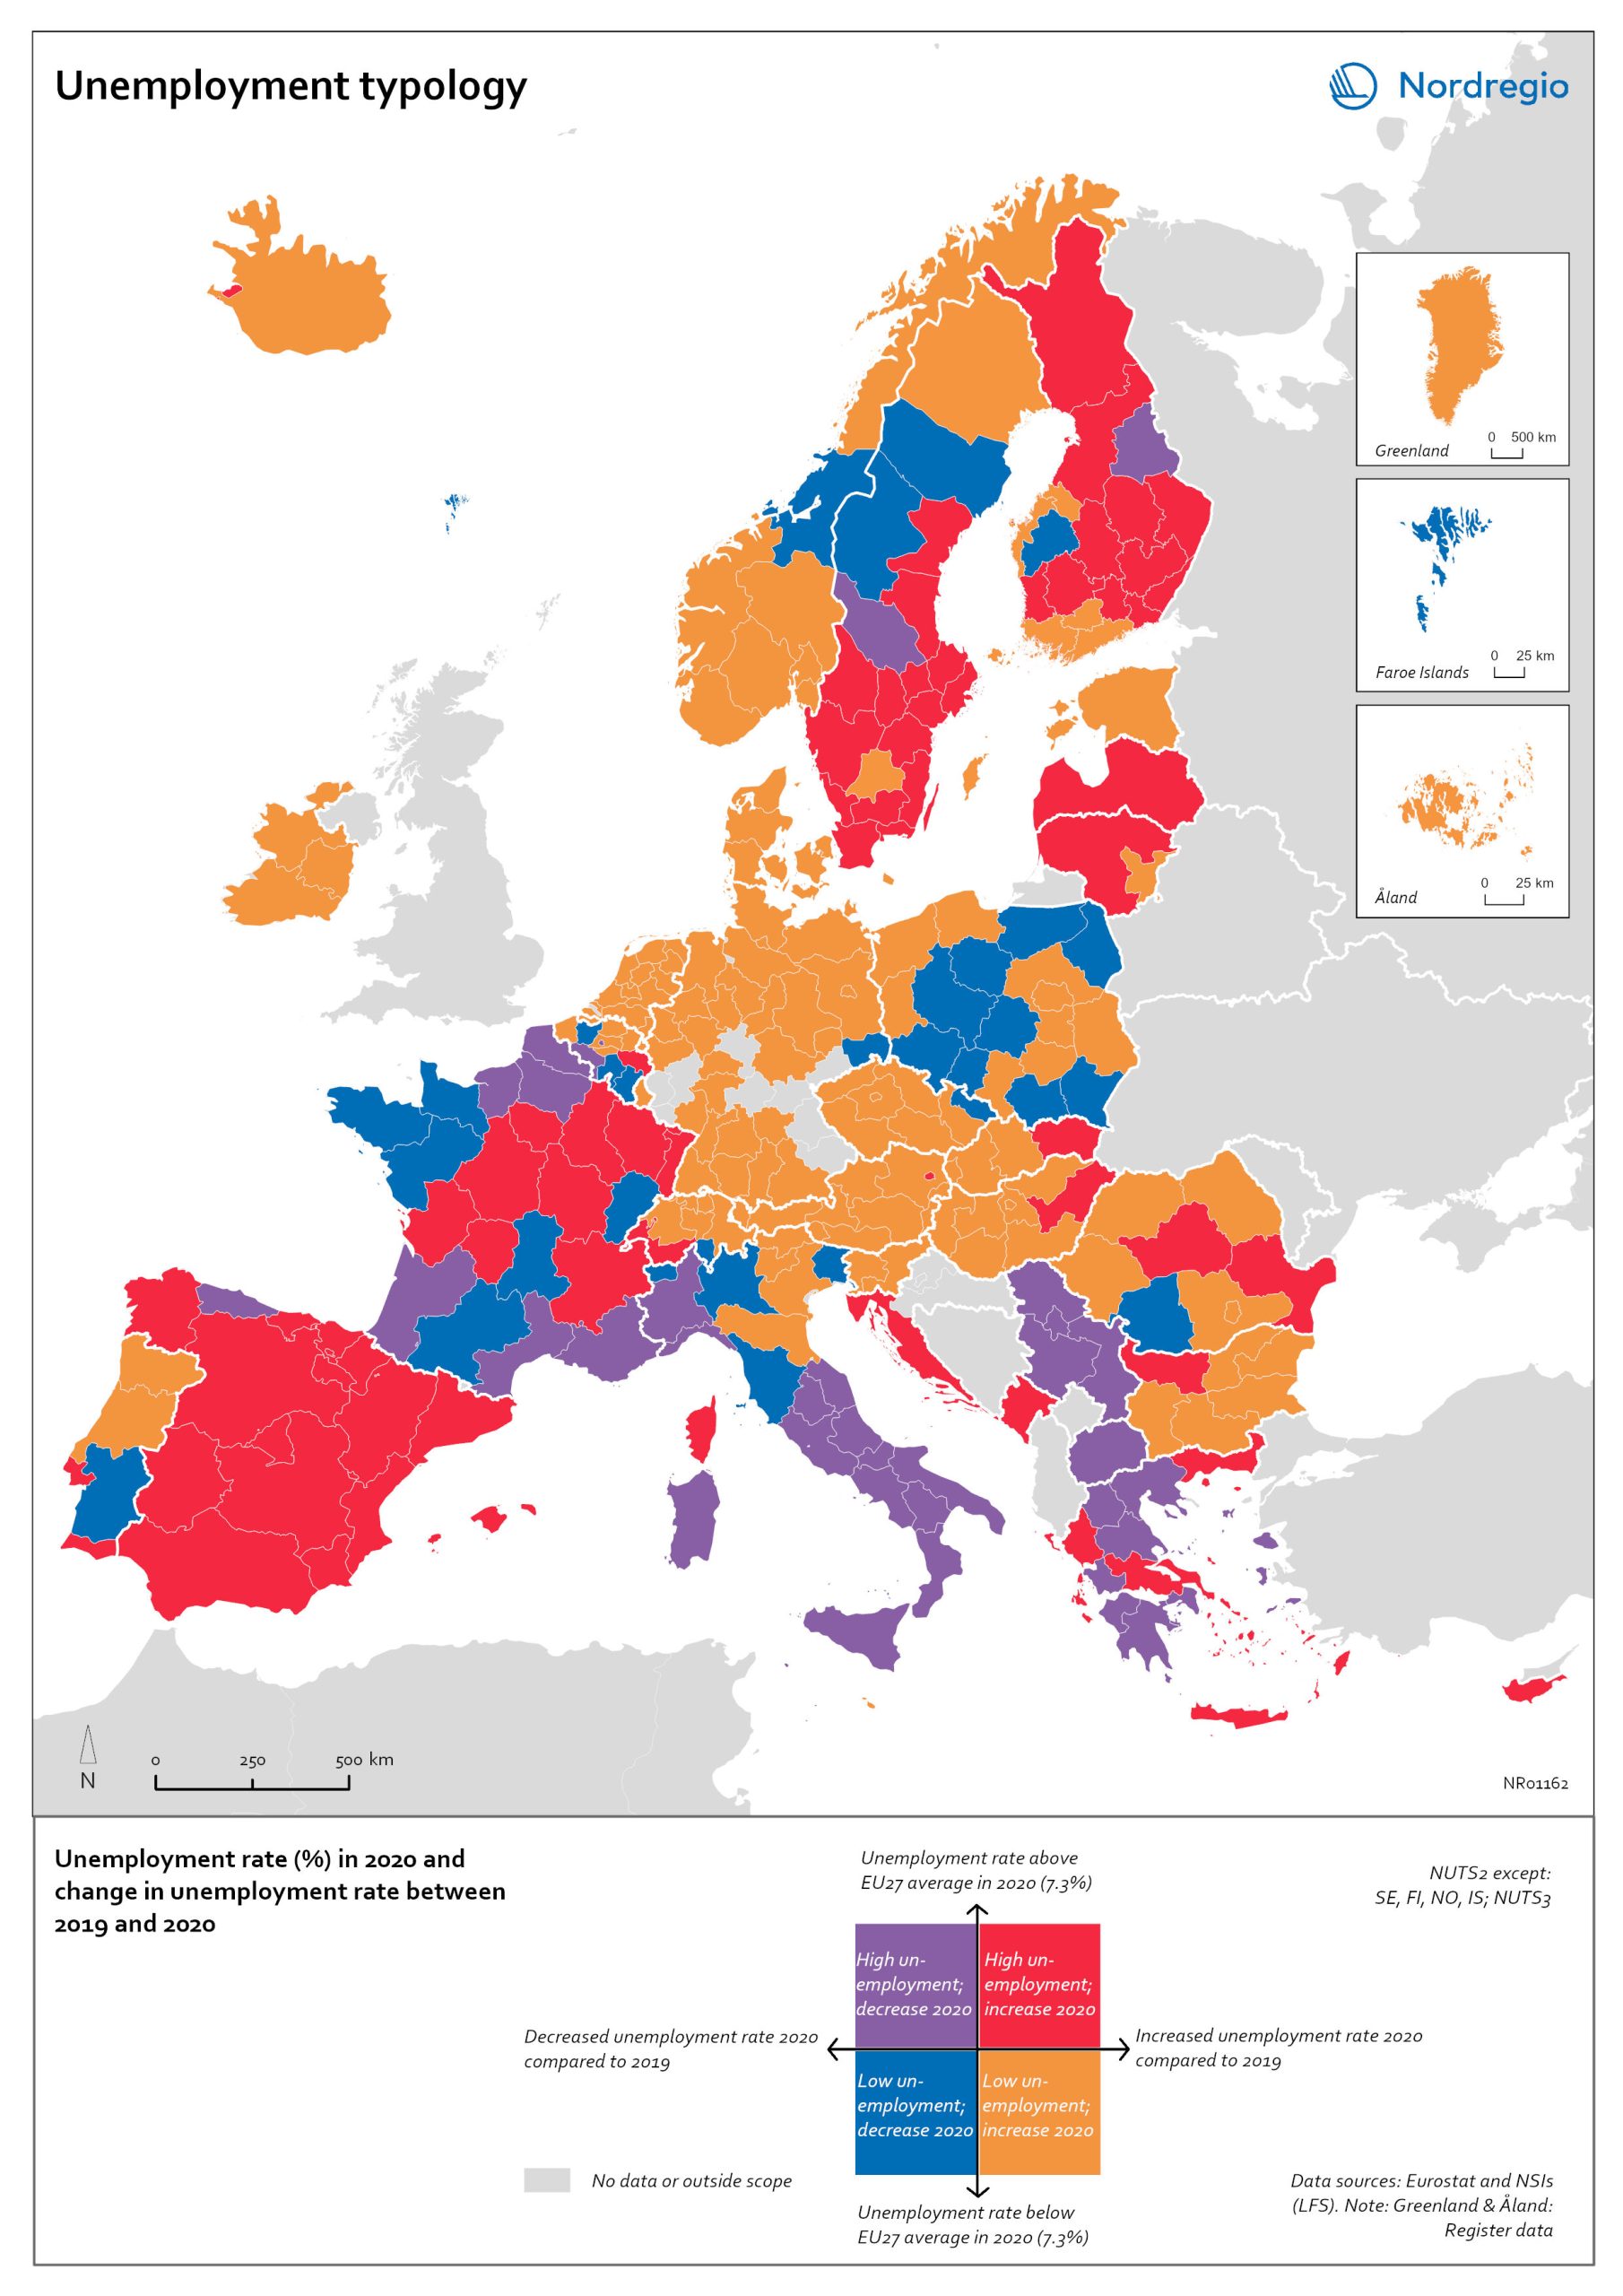
On one axis, the typology considers the extent of the change in the unemployment rate between 2019 and 2020. On the other axis, it considers whether the unemployment rate in 2020 was above or below the EU average of 7.3%. Regions are divided into four types based on whether the unemployment rate decreased or increased and how it relates to the EU average.
Regions falling into the first type, shown in red on the map, had an increase in the unemployment rate in 2020 as well as an above-average unemployment rate in general in 2020. These regions were most affected by the pandemic. They are mainly found in northern and central parts of Finland, southern and eastern Sweden, the capital area of Iceland, Latvia, Lithuania, Spain and central parts of France.
Regions falling into the second type, shown in orange on the map, had an increase in the unemployment rate in 2020 but a below-average unemployment rate in general in 2020. These regions had low pre-pandemic unemployment rates and so were not as badly affected as the red regions, despite the rising unemployment rates. They are located in Denmark, Iceland, Norway, Åland, southern and western Finland, Sweden (Gotland, Jönköping, and Norrbotten), Estonia, Ireland, northern Portugal and central and eastern parts of Europe.

