The map shows the percentage change for work mobility in Nordic regions and municipalities compared to a pre-pandemic baseline.
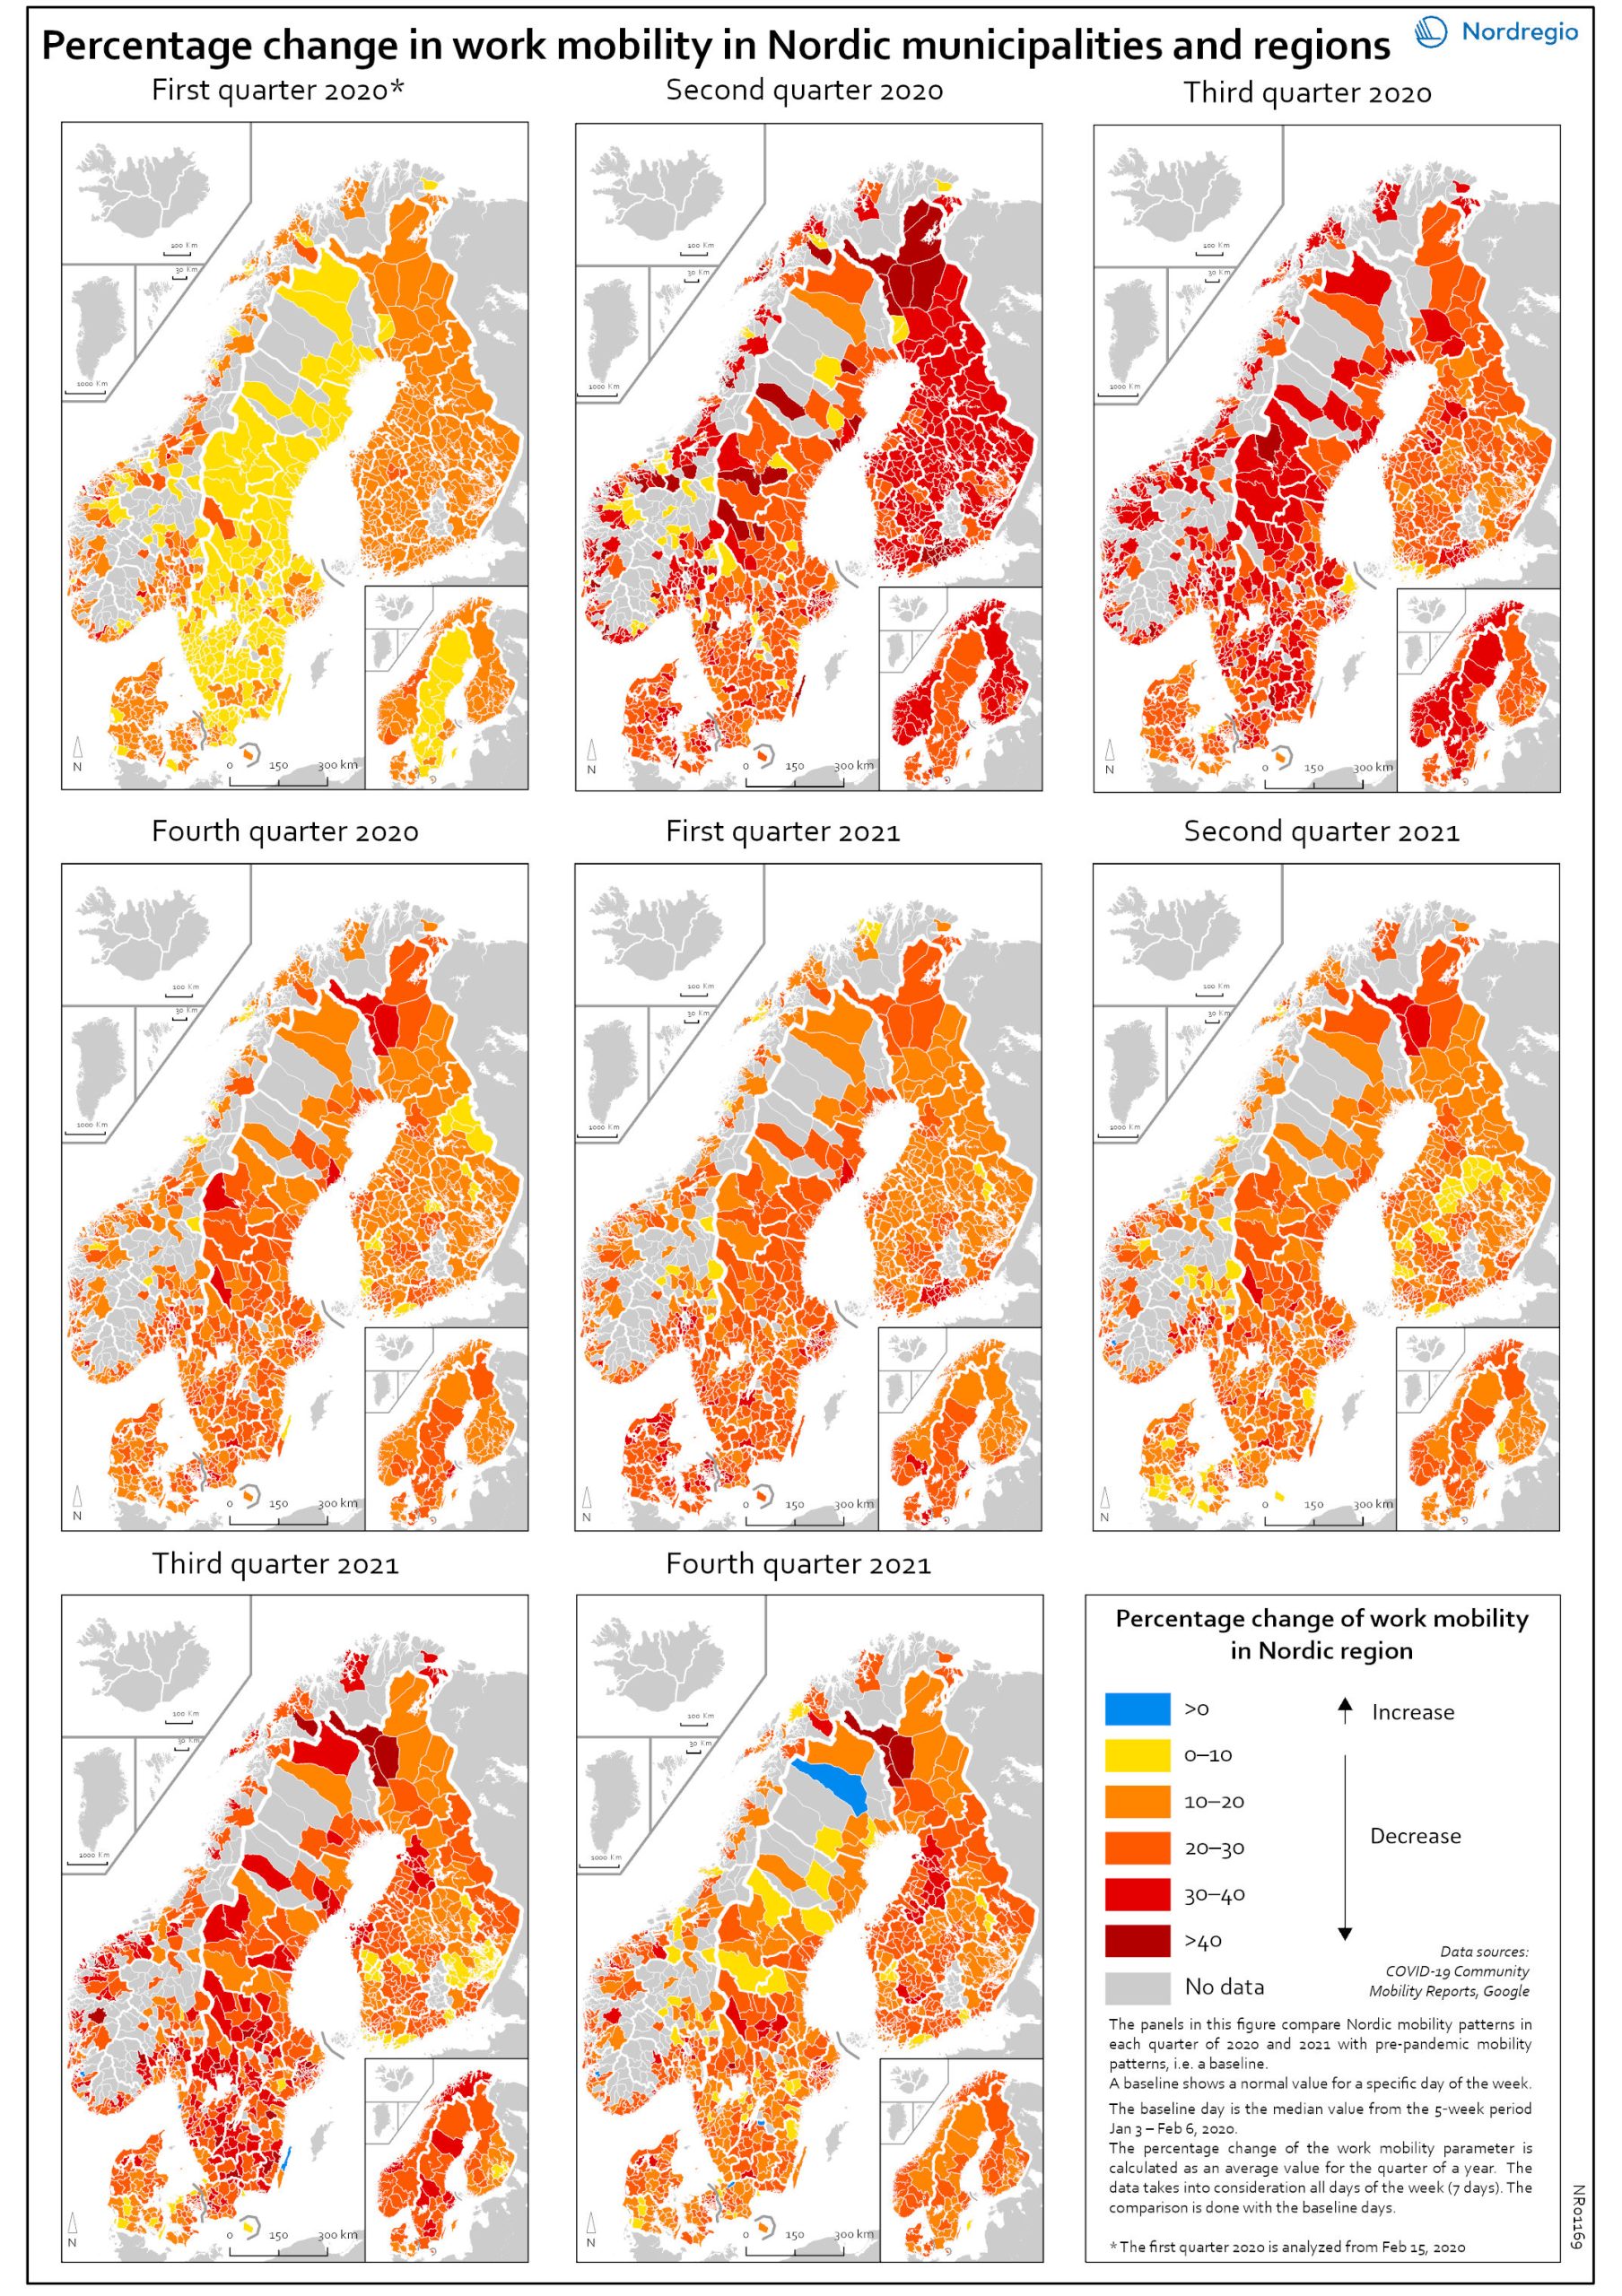
The maps compare Nordic mobility patterns in each quarter of 2020 and 2021 with a pre-pandemic baseline. Based on Google data, the panels illustrate the impact of national restrictions and how those restrictions hampered work mobility. As the restrictions were both national and regional in nature, some regions and municipalities were more affected than others. The darker areas in the map show that work mobility decreased the most Q2 and Q3 2020 and in Q3 2021. The panels also show that mobility decreased later in Sweden than in the other Nordic countries. However, the decrease in Q3 in both 2020 and 2021 may partly be explained by the summer vacation months, when work mobility tends to decrease anyway. In Q4 2021, the overall situation seems to improve, although the pattern is mixed. In a few municipalities the situation is almost back to pre-pandemic baseline while in most municipalities, there is still less mobility in the labour market compared to the pre-pandemic situation.


