Nordregio is an international research institute established by the Nordic Council of Ministers

15 September, 2026

At Risk of Poverty Rate

The map shows the share of people at risk of poverty in 2024. The at-risk-of-poverty rate is a common way of measuring of inequality. Persons at risk of poverty are considered those who have an equivalised disposable income below 60% of the national median equivalised disposable income.
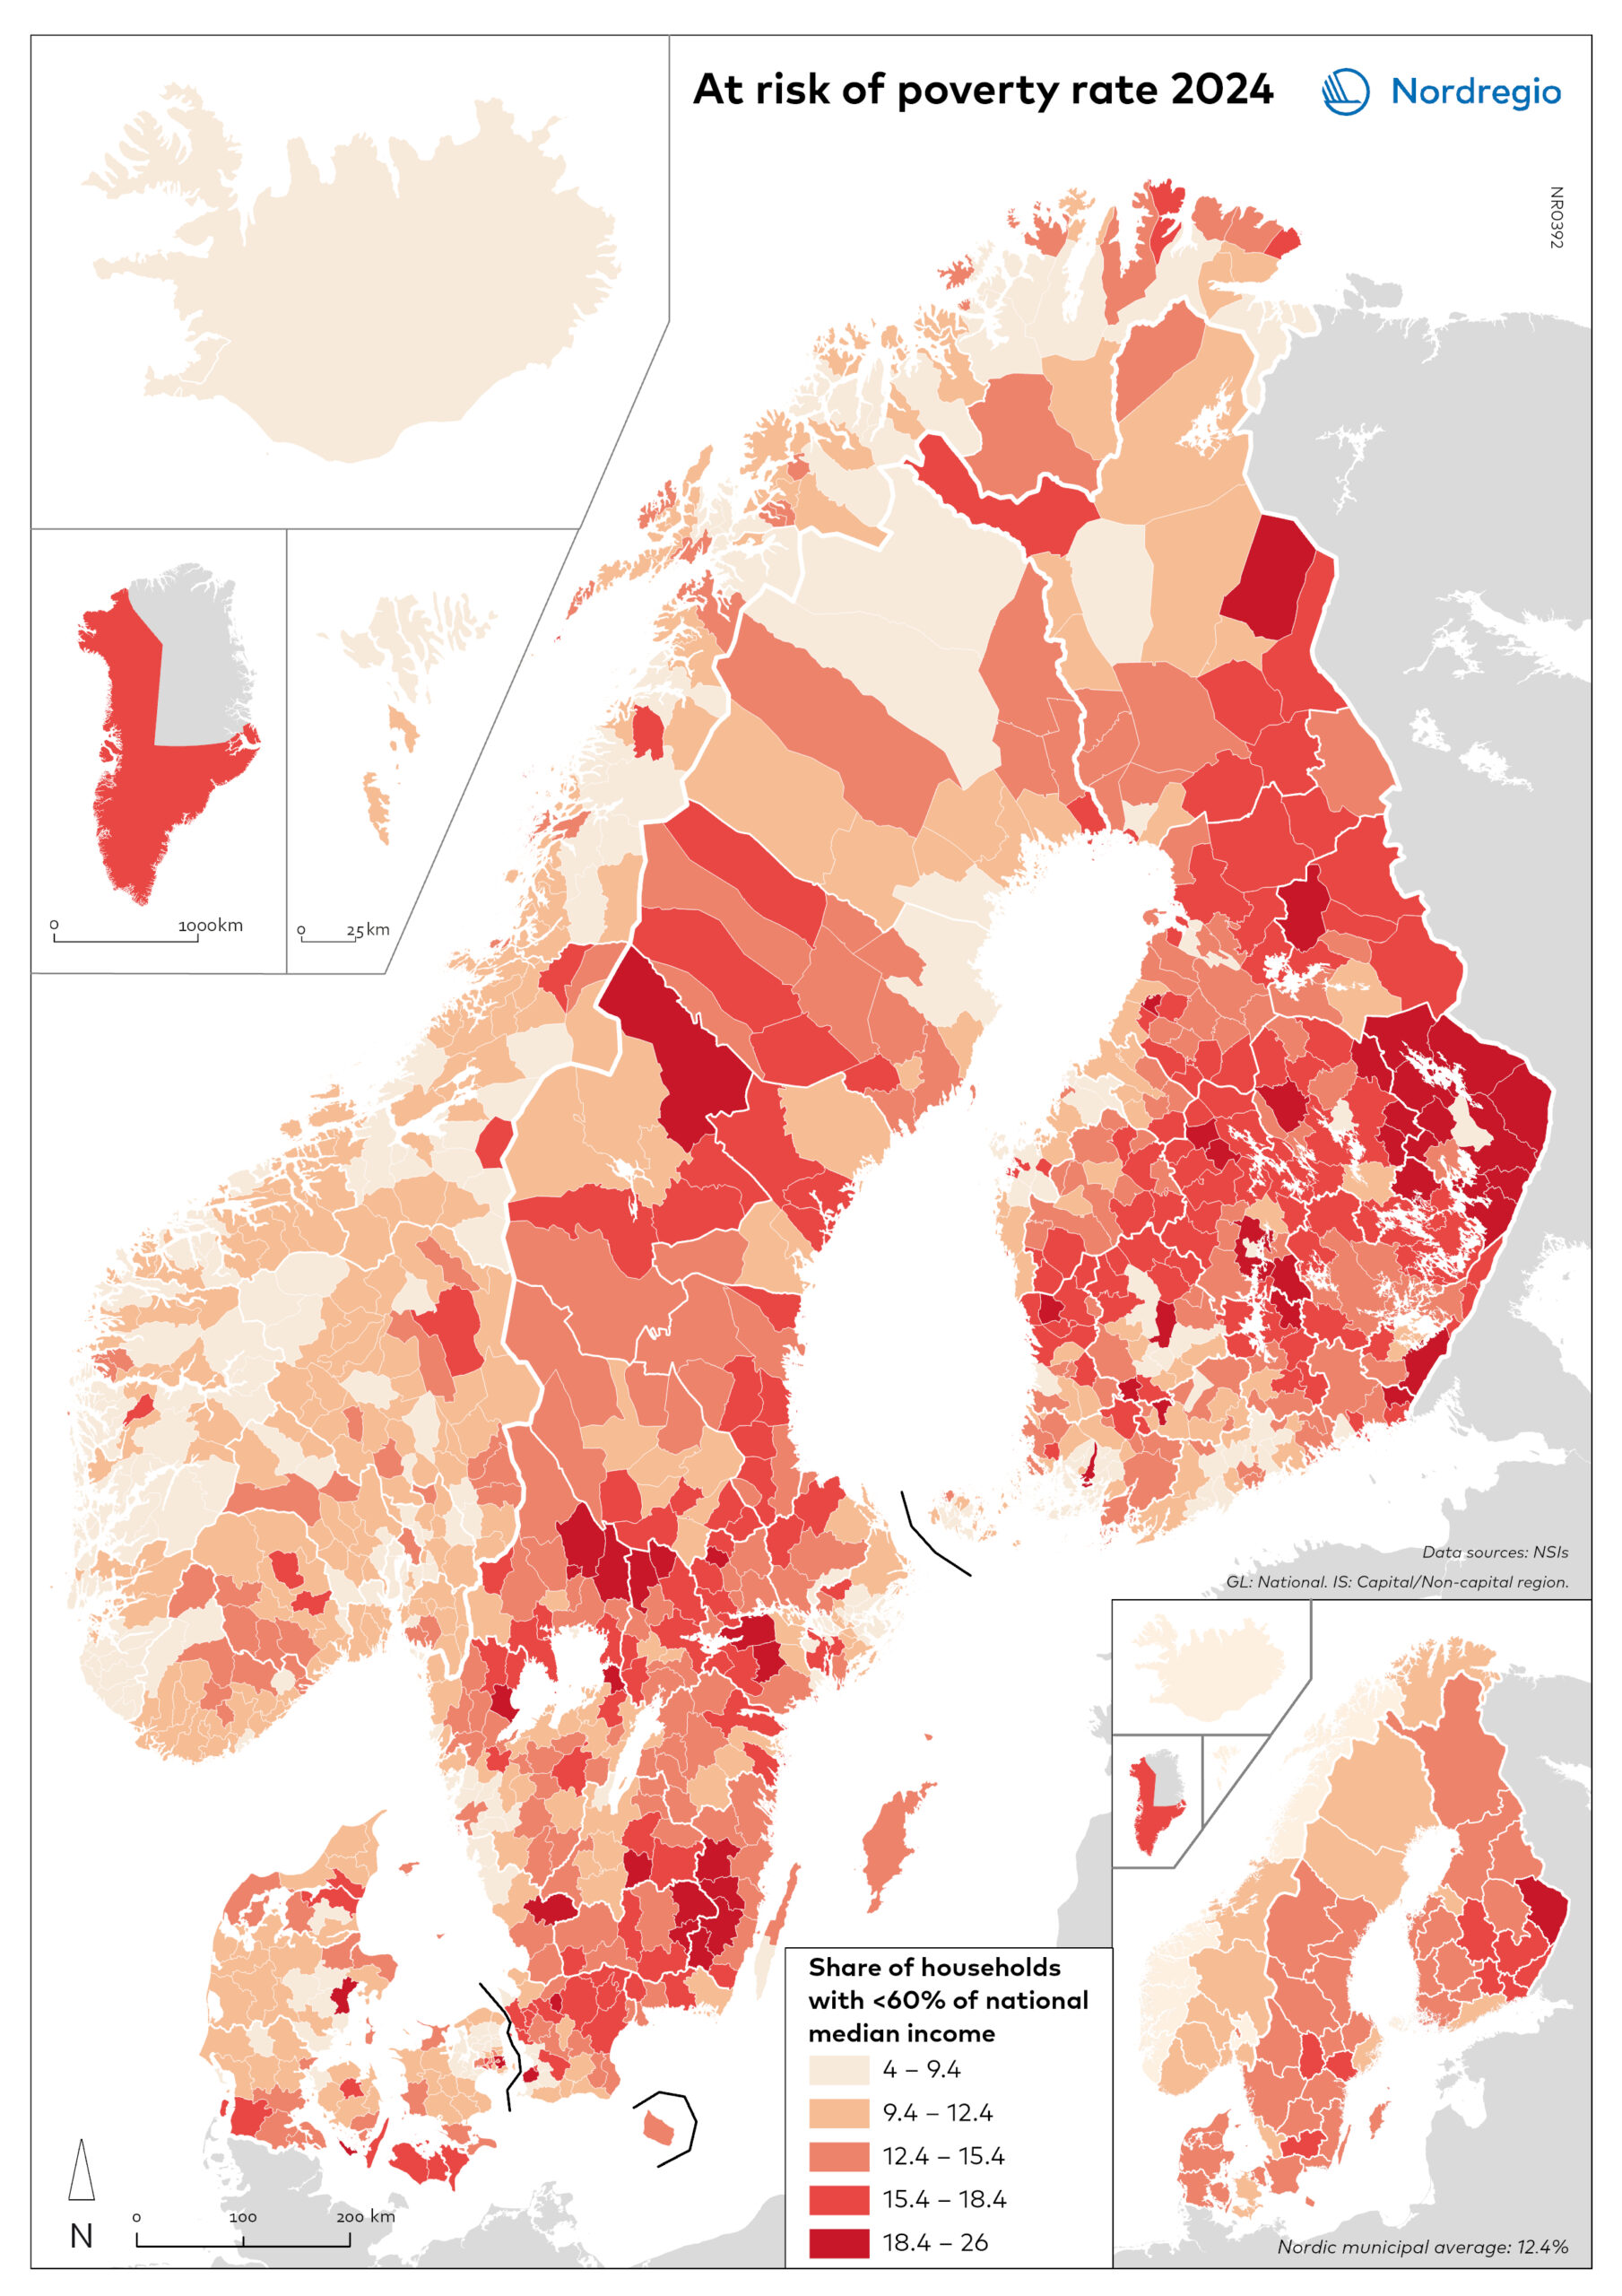
Equivalised means that household income is adjusted to the size and composition of the household. Values for municipalities are compared to their respective national median.

Looking at the map, we almost see a west-east pattern. Lower levels of at-risk-of-poverty are found in Norway, often in coastal municipalities, while many of the municipalities with the highest values are found along Finland’s border to Russia. Greenland presents a national value of 17.9%. Large parts of Iceland and the Faroe Islands are in the lowest group (4–8%). The pattern in Sweden is dispersed. Malmö and Gothenburg municipality have higher values than their neighbouring municipalities. The same goes for Copenhagen and Helsinki, which could suggest that at-risk-of-poverty rates are higher in more urban areas. But Stockholm and Oslo suggest otherwise.

Map Facts

Data have been downloaded directly from National Statistical Institutes (NSIs). The different countries present the data in somewhat different ways. The data for Danish regions are Nordregio calculations based on the municipal data and population data for the same year.
DK: Presented as families with 60 per cent of median income.
FI: Looks at household’s income, where the cash income is lower than 60% of the median available cash income of all households’ equivalents.
FO: Below 60% of the median household income
IS: People belong to the category if they have an equivalised disposable income below the at-risk-of-poverty threshold, which is set at 60 % of the national median equivalised disposable income. Based on SILC survey.
NO: Persons in private households with annual after-tax income per consumption unit, below 60% of the median income. Values for Norway presented as the average of the available EU-scale and OECD-scale.
SE: Based on household income. Defines less than 60% of median household income as “low economic standard”. People living in households whose economic standard is less than 60 % of the national median belongs to this category.
GL: Limited information.

Designer/Cartographer
Benjamin Ullman

Junior Cartographer/GIS analyst

Terms of use

All images are the property of Nordregio. They may be freely used as long as the logo of Nordregio is clearly visible and the source is cited accordingly. Please give also the cartographer/designer/author credit and give full recognition to the data sources if named in the graphic.

If you have any questions, contact us:

Email: [email protected]

Phone: + 46 8 463 54 00

Source: Nordregio at www.nordregio.org