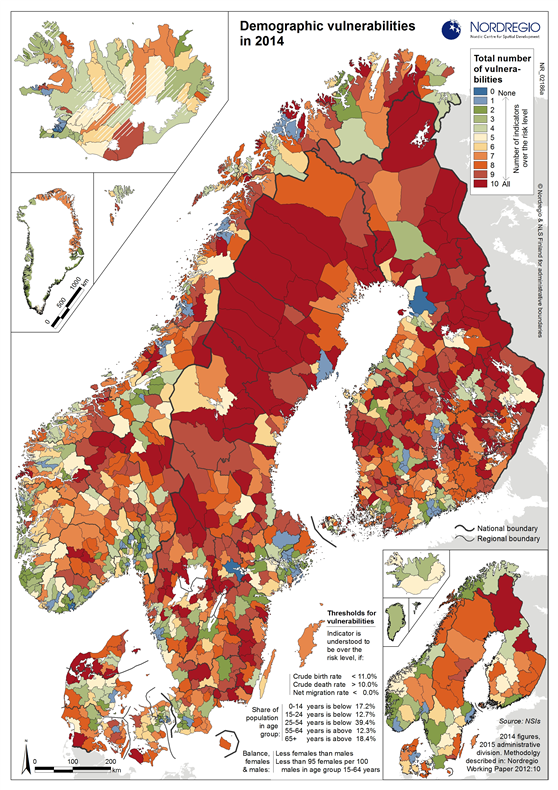
The demographic vulnerabilities map shows the total number of demographic components that are crossing the threshold of vulnerability.
Map Facts
The demographic vulnerabilities map is a summary of ten demographic components on municipal and regional levels. For each component, there is a threshold (i.e., a limit) of vulnerability. The thresholds have been chosen to identify whether or not the component can be considered at risk. E.g., if the component ‘net migration’ (average of 5 years) is negative – below 0% – it is considered a vulnerability. Thus, more vulnerabilities within a municipality or a region indicates a higher level of risk.
The thresholds for each of the chosen age structure components have been calculated based on the Nordic average values. For the other components, the threshold values have been set to a balanced situation. For example, a female population rate below 100 (a low value) will result in a distorted gender structure which reduces the natural reproduction rate. Based on the identification of risk for each of the components, the level of vulnerability has been calculated simply by adding the number of at-risk components together.
Map ID: 02186a
Designer/Cartographer
Linus Rispling
Data source
NSIs
Published 18 June 2015
Terms of use
All images are the property of Nordregio. They may be freely used as long as the logo of Nordregio is clearly visible and the source is cited accordingly. Please give also the cartographer/designer/author credit and give full recognition to the data sources if named in the graphic.